Stock Market Commentary
Last week was full of dramatic price swings. Traders reacted in extreme ways to key earnings results. The wild behavior cascaded out to related stocks. Some of the collateral damage in the blast radius likely came from portfolio managers scrambling to rebalance holdings. I expect this kind of action to continue through the rest of earnings season as the churn zone continues to box in the overall action.
Stock Chart Reviews – Below the 50-day moving average (DMA)
Amazon.com (AMZN)
Amnazon.com (AMZN) is once again one of the most surprising charts in my review. This time AMZN made the list for an upside extreme. A day after plunging 7.9% back toward an 18-month low, AMZN surged 13.5% post-earnings. AMZN reeled in sympathy with Meta Platform’s historic earnings blunder. That move helped forge the historic upside: the largest one day gain in market cap ever. If not for FB, AMZN’s post-earnings gain could have been as little as 4.7%. Sellers held overhead resistance at the 50-day moving average (DMA) (the red line below). Perhaps appropriately, the CNBC Fast Money crew was underwhelmed by AMZN’s earnings results….
Meta Platforms, Inc (FB)
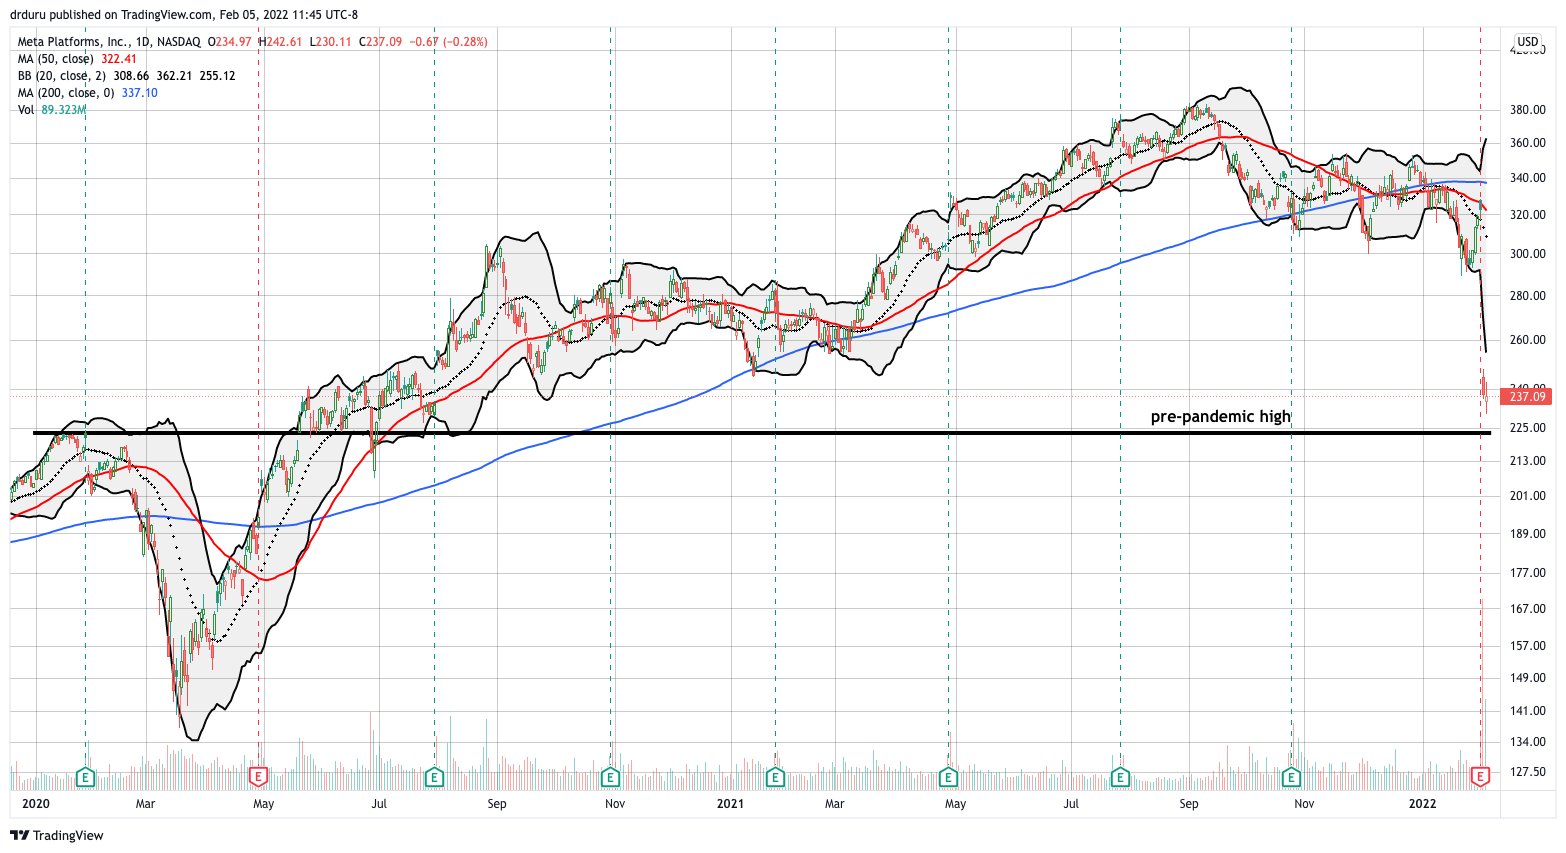
Meta Platforms, Inc (FB) made history with the largest one-day loss in market cap after its 26.4% collapse. I am pretty sure FB pulled off the same milestone when it printed a 19% post-earnings collapse in July, 2018. Amazingly, FB is right on the edge of joining the growing list of companies reversing pandemic-era gains. I have no interest in buying this dip or bottom-fishing. For context, see my previous FB commentary.

Pinterest, Inc (PINS)
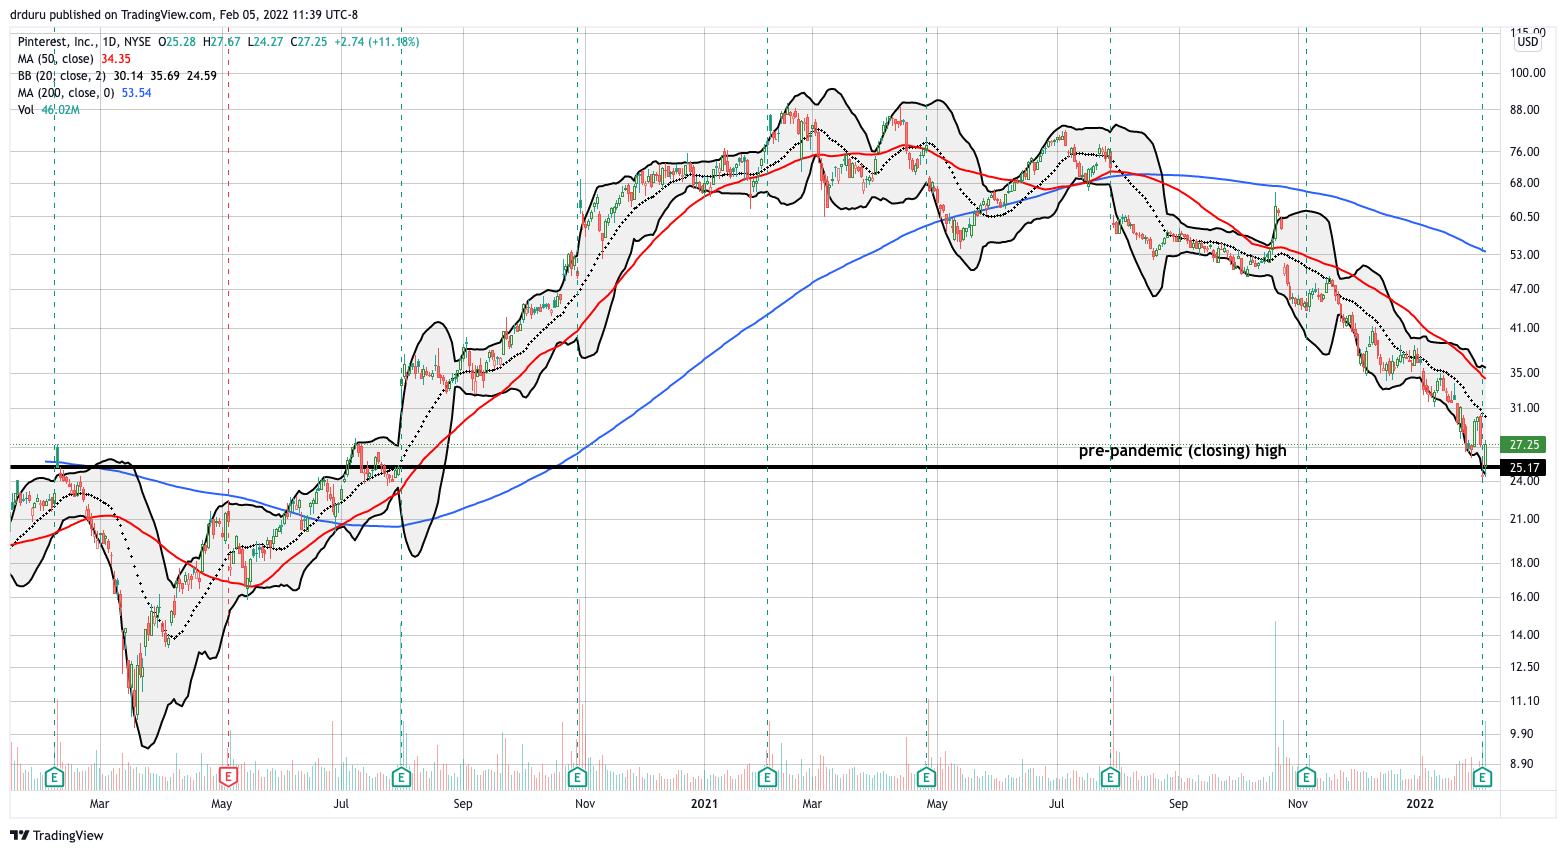
FB did not just exaggerate the post-earnings gains for AMZN. More directly, Pinterest, Inc (PINS) got an exaggerated one-day post-earnings pop thanks to dropping 10.3% in sympathy with FB. The 11.8% post-earnings pop helped PINS rebound from losing all its pandemic-era gains, but the stock just barely closed the previous gap.

Snap Inc (SNAP)
FB took down Snap Inc (SNAP) 23.6%. The next day, SNAP enjoyed a startling 58.8% post-earnings gain. SNAP earned a clean post-earnings win as it gapped above its 20DMA (the dotted line below). Despite the monster gain, SNAP still faded away from overhead 50DMA resistance. Note in the chart below how SNAP earlier filled the gap up from its October, 2020 earnings report.
Intel Corporation (INTC)
The between earnings trade is in play for Intel Corporation. INTC lost 7.0% post-earnings on January 27th. Buyers got active after one more plunge to a 13-month low. I started with March $50 call options. So far, I like the higher intraday lows…
ServiceNow, Inc (NOW)
ServiceNow, Inc (NOW) delivered a ray of light to the universe of expensive software stocks. NOW jumped 9.1% post-earnings despite faders taking the stock off 20DMA resistance. Buyers returned with a vengeance. NOW’s next challenge is converged 50/200DMA resistance.
Lucid Group, Inc (LCID)
I continue to hold Lucid Group, Inc (LCID) although it sits firmly in the camp of extremely expensive growth stocks that are out of favor. Indeed, LCID is 50.4% off its recent high. LCID even failed to set a new all-time high. However, given earlier trades that included loading up on the September 1st plunge and later selling calls against shares, I am now riding the “house’s money” on LCID. Accordingly, I have every reason to hold my core position for the long term. I still dream of one day owning the car to join my shares in matrimony.
LCID was definitely one of those lessons in how to hold on to an expensive growth stock for long-term potential.
DoorDash, Inc (DASH)
Delivery company DoorDash, Inc (DASH) continues to churn its way to new all-time lows. The stock is moving in large chunks: down 7%, down 5%, up 9%, down 9%, down 11%, etc… The market clearly has no idea how to value DASH in the short-term, but the trend says plenty for now.
Teladoc Health, Inc (TDOC)
Teladoc Health, Inc (TDOC) was one of the earliest pandemic-related plays that gave up all its pandemic era gains. Telemedicine was all the rage at the height of the pandemic. Competition came in many forms including a return to old practices in some cases. TDOC rallied into the pandemic so its current troubles have taken the stock price well below pre-pandemic highs. Note how TDOC did not plunge with the market in March, 2020. TDOC churned wildly for about a month and then continued higher until its final peak in early 2021.
TDOC is a more attractive 5.8x sales. However, the company still makes no profits, swallowed an expensive acquisition with Livongo, and remains stuck in an ugly downtrend. TDOC needs to at least stabilize before I can get interested.
Starbucks Corporation (SBUX)
Even Starbucks (SBUX) looks like trouble. SBUX came into 2020 clinging to a recent trading range. Once SBUX cracked the bottom of the trading range, sellers became relentless. Earnings has applied some kind of brake to the descent and created a lot of pre-earnings and post-earnings churn. I expect SBUX to follow the momentum of the break out of this tight consolidation formation (above or below).
Spotify Technology (SPOT)
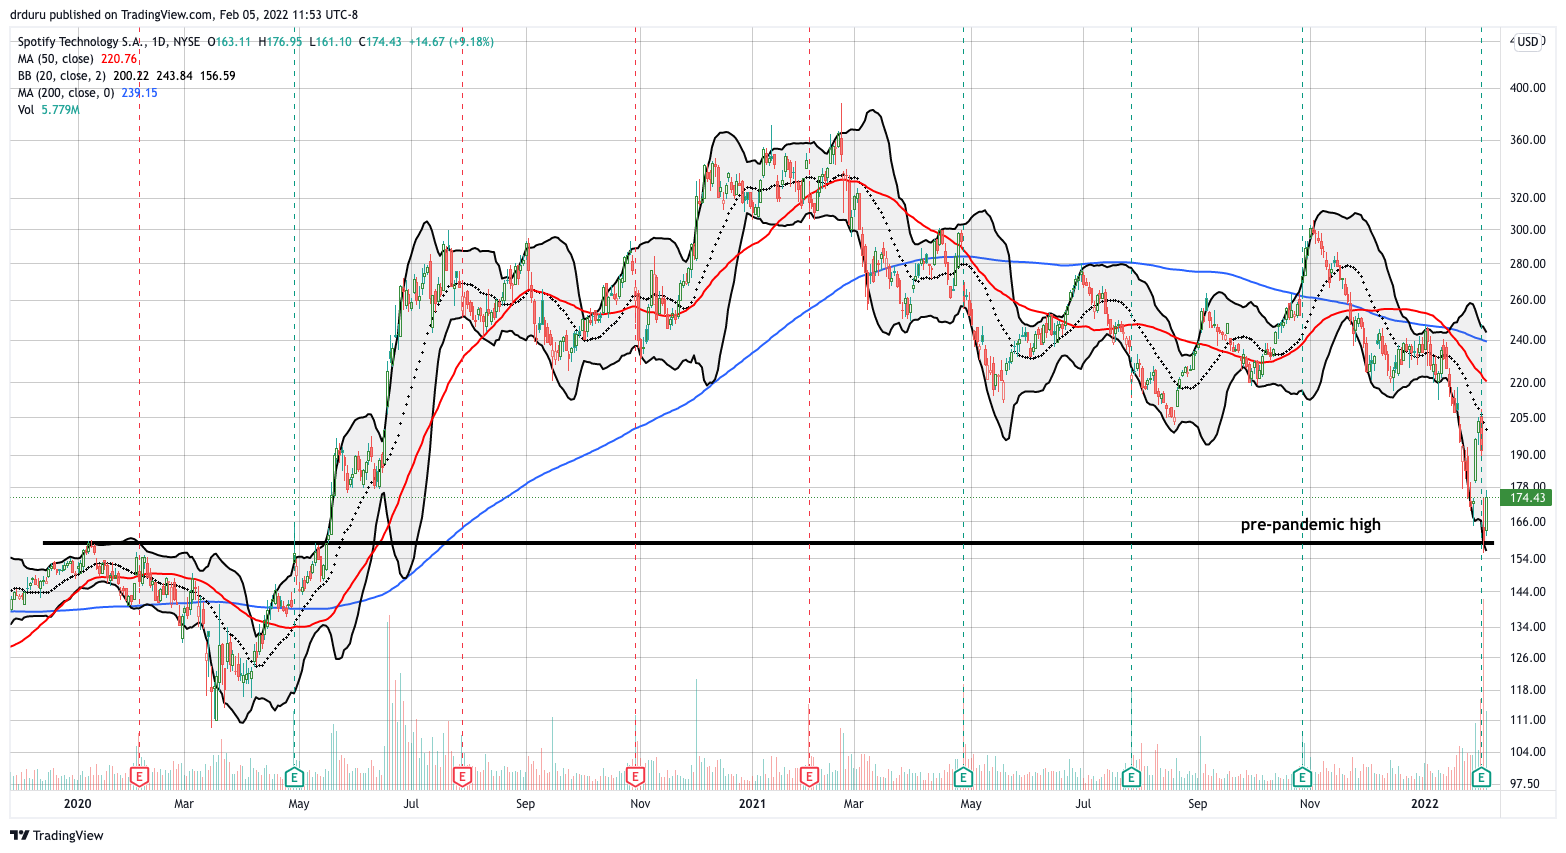
The headlines continue to roll about Spotify Technology (SPOT). The most important headline was a 16.8% post-earnings plunge that took SPOT to its pre-pandemic high. SPOT became one more stock that gave up its pandemic era gains. Buyers reflexively jumped in from there and took SPOT up 9.2% on Friday. Something tells me buying at the pre-pandemic high is becoming its own specialized trade.

The Walt Disney Company (DIS)
I periodically check in on The Walt Disney Company (DIS) but never thought to check the stock against its pre-pandemic high. I was quite surprised to realize that DIS was an early member of the pandemic era fade club. DIS hit that milestone back in November after a disappointing earnings report. Granted, DIS made such slow progress in 2020 that its pandemic era gains were very shallow. As a result, just a “little” selling was enough to take DIS into a complete reversal of its pandemic era gains.
Stock Chart Reviews – Above the 50DMA
Apple Inc (AAPL)
Apple (AAPL) continues to try to hold the torch for the stock market. AAPL confirmed a 50DMA breakout last week. Sellers were only able to nudge AAPL into a “gentle” tap of its 50DMA support. This test is a critical symbol of the stock market’s prospects for maintaining the current bounce away from oversold conditions.
Bassett Furniture Industries, Inc (BSET)
Sometimes bottoms do not play out as expected. Sometimes they work out unexpectedly. Bassett Furniture Industries, Inc (BSET) pulled off both stunts.
Almost a month ago I made the case for a bottoming pattern in BSET. The general selling pressure in the stock market took BSET down to a 16-month low ahead of earnings. I held on only because nothing company-specific happened. Moreover, I saw the additional drop as taking a surprisingly cheap stock down to an even steeper discount. Market participants agreed with me after earnings. BSET ripped higher 33.1% post earnings and printed a fresh 50DMA breakout. I am still waiting for confirmation from a higher close.
United Parcel Service, Inc (UPS)
The real economy must still be healthy if I am correctly interpreting the post-earnings reaction in packaged shipping company United Parcel Service, Inc (UPS). UPS jumped 14.1% post-earnings to an all-time. UPS is a buy the dips from here at least back down to 50DMA support.
Boise Cascade, LLC (BCC)
With the economy of shipping packages apparently doing fine, the fortunes of paper company Boise Cascade, LLC (BCC) make sense. BCC surged 8.2% to an all-time high the same day as the post-earnings reaction for UPS. Buyers delivered spirited follow-through with a 7.8% gain. Unfortunately, sellers reversed that gain by the close of Friday. Still, BCC looks like a winner for a longer-term healthy economy.
KraneShares Global Carbon Strategy ETF (KRBN)
The KraneShares Global Carbon Strategy ETF (KRBN) focuses on trading futures in carbon credits. From Yahoo Finance:
“The advisor attempts to maintain exposure to carbon credit futures that are substantially the same as those included in the index. The index is designed to measure the performance of a portfolio of liquid carbon credit futures that require physical delivery of emission allowances issued under cap and trade regimes. It is non-diversified.”
Clearly business is brisk! I regret just now learning about this machine of profits. KRBN is up 179% since its inception July 30, 2020. All I can do now is wait for at least a return to the 50DMA uptrend for a buying opportunity.
Be careful out there!
Footnotes
Source for charts unless otherwise noted: TradingView.com
Full disclosure: long BSET, long DIS, long LCID, long INTC calls
FOLLOW Dr. Duru’s commentary on financial markets via StockTwits, Twitter, and even Instagram!
*Charting notes: Stock prices are not adjusted for dividends. Candlestick charts use hollow bodies: open candles indicate a close higher than the open, filled candles indicate an open higher than the close.
Grammar checked by Grammar Coach from Thesaurus.com

You can add AVLR to the “bounce of prepandemic high”. Also KMX sitting there.
Thanks for the additional tickers! Maybe soon someone can figure out a “dynamic” ETF for stocks that have given up all their pandemic era gains…