Housing Market Intro and Summary
A hawkish Federal Reserve has changed the game for the housing market. At first, I thought the normalization in monetary policy would generate a “settling in” for the housing market. However with inventories tight, a scarcity in available labor, rising material costs, and a dysfunctional supply chain, higher rates may actually have little impact on housing prices. Instead, homes will get unaffordable for those already standing at the edges of the market. Investors have started pricing in the lower profits that could eventually come with this mix of headwinds. If the sharp shift in new home sales to the lower-end of the market is any indication, higher rates could shift demand instead of reduce it. The coming Spring selling season should reveal the full extent of the cooling effect of the headwinds from higher rates.
Housing Stocks
The iShares Dow Jones US Home Construction Index Fund (ITB) out-performed the S&P 500 (SPY) in 2021 with a 49% gain versus 27%. Fortunes have reversed so far this year. ITB is down 18.4% year-to-date. The S&P 500 is down 5.6%. Moreover, ITB has suffered and sustained a breakdown below the critical support line from its uptrending 200-day moving average (DMA). ITB is trading near its closing low of the year which in turn is near the lows from last October. Accordingly, the pressures from the change in monetary policy upended the seasonal trade in home builders. Assuming the accompanying outperformance is over for home builders, I have focused my seasonal dip-buying on ITB over individual home builders.
LGI Homes (LGIH) is the high-flyer among the home builders I track. However, its soaring days ended way back in May. ITB left LGIH behind from there. While ITB hit new all-time highs in December, LGIH barely managed to trade above its 200DMA. LGIH is already down 23.1% this year. The stock reversed all its gains from the March, 2021 breakout.
KB Home (KBH) provided a brief hope that home builders could fight through the headwinds and resume their typical seasonal strength. KBH soared 16.5% after reporting earnings last month. Those gains evaporated in 4 days. Sellers continue to pressure KBH. A steep 7.1% loss took KBH down to its October lows (like so many other home builders).
Housing Data
New Residential Construction (Single-Family Housing Starts) – December, 2021
Single-family home starts decreased to 1,172,000 which was 2.3% below November’s starts (revised upward from 1,173,000 to 1,199,000). Starts were 8.5% below last year’s peak starts. December, 2020 delivered the highest level of starts since September, 2006. Builders were scrambling to respond to the pandemic-driven, historic surge in demand. In other words, housing starts remain quite healthy.
![Housing starts Source: US. Bureau of the Census, Privately Owned Housing Starts: 1-Unit Structures [HOUST1F], first retrieved from FRED, Federal Reserve Bank of St. Louis, January 29, 2022.](https://fred.stlouisfed.org/graph/fredgraph.png?g=LqDh)
Each region declined on a year-over-year basis. The West suffered a third straight double digit decline. Housing starts in the Northeast, Midwest, South, and West each changed -16.7%, -9.1%, -4.9%, and -23.4% respectively year-over-year. The South and West were the two regions that decreased sequentially.
For the year 2021, housing starts totaled 1,123.1 units. This healthy 13.4% increase from 2020 was boosted by the plunge at the beginning of the pandemic.
Existing Home Sales – December, 2021
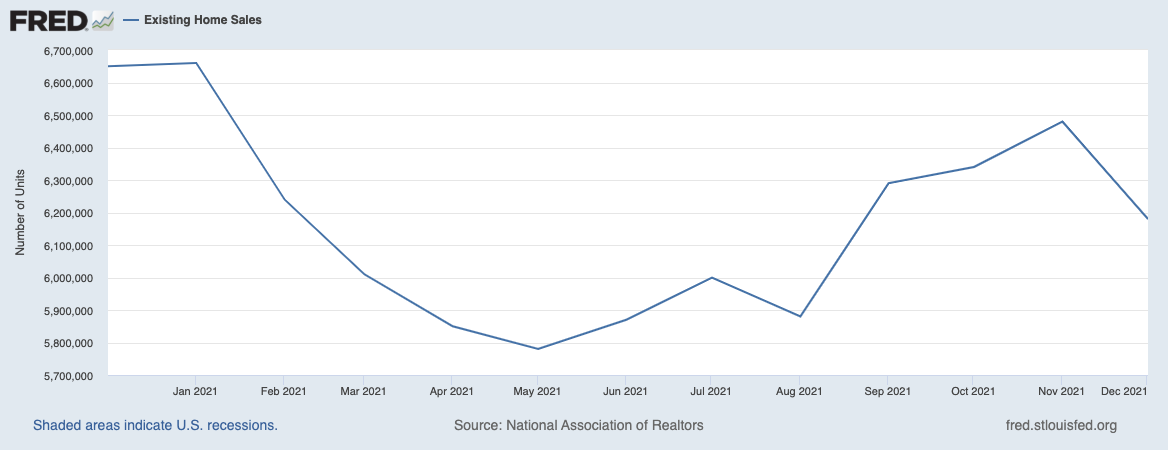
Existing home sales surged in September. However, a steep monthly decline in December took sales below September’s rebound. As a result, the seasonally adjusted annualized sales in December of 6.18M decreased 4.6% month-over-month from the upwardly revised 6.48M in existing sales for November. More importantly, year-over-year sales decreased 7.1%. The existing homes market goes into 2022 with a continuing normalization.
The National Association of Realtors (NAR) returned to blaming supply constraints for slowing sales: “…the pull back was more a sign of supply constraints than an indication of a weakened demand for housing. Indeed, “sales for the entire year finished strong, reaching the highest annual level since 2006.”
(For historical data from 1999 to 2014, click here. For historical data from 2014 to 2018, click here) Source for chart: National Association of Realtors, Existing Home Sales© [EXHOSLUSM495S], retrieved from FRED, Federal Reserve Bank of St. Louis, February 5, 2022.

December’s absolute inventory level of 910K homes plunged 18.0% from November, a fifth consecutive month-over-month decline. Inventory dropped 14.2% year-over-year (compare to November’s 13.3%, October’s 12.0%, September’s 13.0%, August’s 13.4%, July’s 12.0%, June’s 18.8%, May’s 20.6%, April’s 20.5%, March’s 28.2%, and February’s 29.5% year-over-year declines, unrevised). “Unsold inventory sits at a 1.8-month supply at the present sales pace, down from 2.1 months in November and from 1.9 months in December 2020.” The on-going year-over-year decline in inventory is on a 31-month streak and dragged absolutely inventory levels to a new all-time low. The NAR lamented it will take “years to correct” the supply problems facing housing.
The average 19 days it took to sell a home in December was one day higher than November.
The median price of an existing home increased 0.1% from November to hit $358,000. Prices have increased year-over-year for 118 straight months which is an all-time record streak. November’s price hike was a 15.8% year-over-year gain.
First-time home buyers increased to a 30% share of sales in December, up from 26% in November. The NAR’s 2017 Profile of Home Buyers and Sellers reported an average of 34% for 2017, 33% for 2018, 33% for 2019, 31% for 2020, and 34% for 2021. Once again, I am noting that the share of first-time home buyers is not changing much overall despite the on-going narratives about either the lack of affordable housing or the rush of first-time millennials to the housing market. December’s rebound in share for first-timers is particularly notable given the month’s sharp decline in inventory. Investors also increased in share. Their share of sales returned to 17% from 15%.
Every region experienced a year-over-year decline in sales. The regional year-over-year changes were: Northeast -15.7%, Midwest -2.6%, South -5.3%, West -10.2%.
For the third month in a row, the South’s median price soared year-over-year. The regional year-over-year price gains were as follows: Northeast +6.3%, Midwest +10.0%, South +20.2%, West +8.4%. The South has provided stretched homebuyers an oasis of affordability, so I am still watching to see whether sustained price gains accompany a sales slowdown in the South. The region could be another key test of the headwinds coming from tighter monetary policy.
Single-family home sales decreased 4.3% from November and declined on a yearly basis by 6.8%. The median price of $364,300 was up 11.9% year-over-year.
California Existing Home Sales – December, 2021
Market normalization did not impede California from hitting the highest annual level of existing sales since 2009. For the second month in a row, the California Association of Realtors (C.A.R.) described competitiveness as “elevated” but “less heated.” At 101.2, the statewide median sales-price-to-list-price ratio dropped to its lowest point since February. The median time to sell a house is still a mere 12 days – just 1 day longer than a year ago.
California’s existing homes sales decreased 5.4% month-over-month and contributed to an overall losing trend of 6 months over the last 8. For December, the C.A.R. reported 429,860 in existing single-family home sales. Sales decreased 15.7% year-over-year. At $796,570 the median price ended a 3-month losing streak by increasing 1.4% over November. The median was up 11.0% year-over-year. The $382 price per square foot dropped from November’s $393 and is up 15.8% year-over-year.
Inventory fell yet again. The record low inventory levels add credence to the notion that slowing sales do not reflect slowing demand. However, the worsening supply crunch does mean the market still has a long way to go to normalize. The Unsold Inventory Index (UII) dropped from 1.6 to 1.2 months of sales. The UII was 1.4 a year ago. Active listings fell 24.1% year-over-year.
New Residential Sales (Single-Family) – December, 2021
The jump in December new home sales looks unseasonably strong. However, the rebound brought sales back to the trend line. I continue to expect sales to sustain this trend despite the growing headwinds in the market. New home sales of 811,000 were up 11.9% from November’s 725,000 (significantly revised down from 744,000 – the third straight large downward revision). Sales were down 14.0% year-over-year. Note that December, 2020 was the second to last month of the pandemic era peaking in sales.
![new home sales Source: US. Bureau of the Census, New One Family Houses Sold: United States [HSN1F], first retrieved from FRED, Federal Reserve Bank of St. Louis, February 3, 2022.](https://fred.stlouisfed.org/graph/fredgraph.png?g=LBkZ)
At $377,700 the median home price fell sharply off the all-time high, down 9.2% month-over-month but still up 3.4% year-over-year. The chart below highlights the sudden drop. Perhaps this pullback is a return to trend. The sharp drop was almost entirely driven by a surge in share of sales in the $200,000 to $299,999 range. Each of the top three price tiers lost notable share. This sudden shift could be a sharp move toward affordability as mortgage rates start to rise with no price relief from all the other headwinds in the housing market.
![new home median sales price Source: U.S. Census Bureau and U.S. Department of Housing and Urban Development, Median Sales Price for New Houses Sold in the United States [MSPNHSUS], retrieved from FRED, Federal Reserve Bank of St. Louis; February 3, 2022.](https://fred.stlouisfed.org/graph/fredgraph.png?g=LBmU)
The monthly inventory of new homes for sale decreased from 6.5 to 6.0. The absolute inventory level of 403,000 delivered a fifth month of gains. I thought seasonal factors were at play. However given the surge of sales in December, the inventory is likely a response by builders to persistent strength in demand.
Regional sales numbers were mixed with a second straight month of exceptionally large year-over-year swings. The Northeast returned to steep drops with a loss of 34.1% for December. The Midwest plunged 23.2%, a third straight month with a significant decline. The South also declined double digits again, this time a drop of 17.5%. The West was the only region with a gain; it was up 2.1%. The disparities continue to reflect the uneven pandemic-related migrations and location choices for people seeking work and remote work. The West was a relative loser in 2020.
Home Builder Confidence: The Housing Market Index – January, 2022
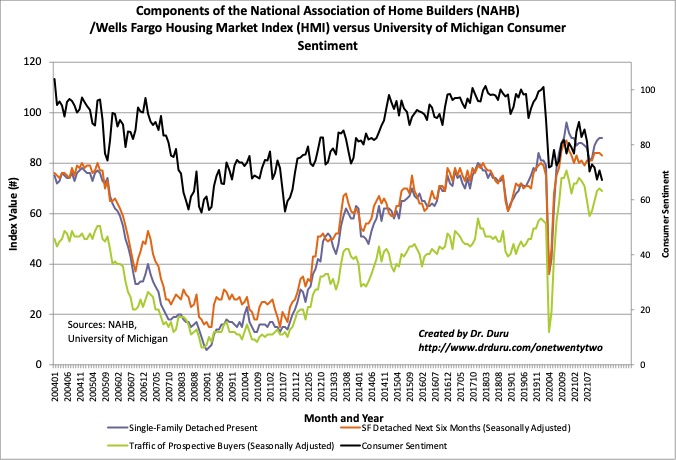
The overall rebound in all three components of the NAHB/Wells Fargo Housing Market Index (HMI) remains intact despite a small pullback in January in 2 of the 3 components. The HMI started 2021 at 83 and ended at 84 on the heels of 4 straight months of gains. The streak ended with January dropping by a point to 83. Normalization for builders has arrived in the form of sustained high levels.

Source for data: NAHB
The NAHB blamed inflation fears and supply issues for the slight drop in home builder sentiment. These same issues somehow did not impede previous gains in sentiment. Still, the problems are serious: “Higher material costs and lack of availability are adding weeks to typical single-family construction times…NAHB analysis indicates the aggregate cost of residential construction materials has increased almost 19% since December 2020.” That anchor point is important because the housing market was at its strongest in December, 2020. In other words, imagine how much stronger the housing market could be without the supply issues and inflationary pressures.
The NAHB went on to warn that January’s sentiment measurements occurred before the recent rise in mortgage rates. Affordability will likely decline in 2022 and presumably builder sentiment will fall in parallel. At some point extremely low consumer sentiment may also bleed into home builder sentiment.
While HMI declined by just a point, the regions were very divergent. The Northeast surged from 69 to 80 in December and plunged back to 71 in January. The reversal is more consistent with the recent declines in new home sales in the Northeast. The Midwest fell from from 76 to 74. The South declined from 89 to 87. The West was the only region with a gain. The West inched higher from 87 to 88.
Home closing thoughts
New homes are a record share of housing inventory
While the inventory of existing homes continues to shrink, home builders are cranking out as many homes as the supply chain will allow. The imbalance has created a surge in the share of inventory sitting in new homes. Redfin (RDFN) reported that “more than one-third (34.1%) of U.S. single-family homes for sale in December were new construction, up from 25.4% a year earlier and the highest share on record.” Houston leads all metros with a 39.4% share.
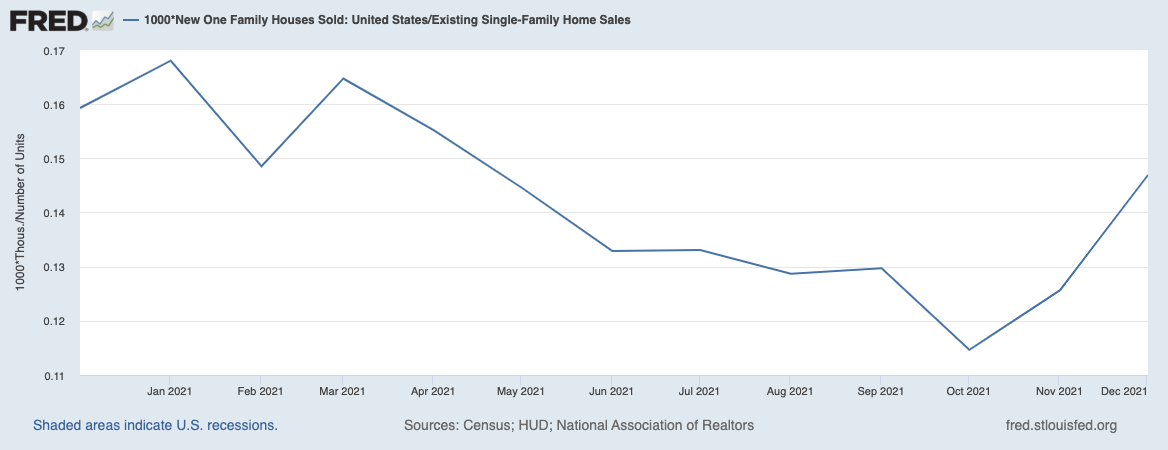
Despite the recent surge in the share of inventory, the percentage of single-family home sales going to new homes is still slightly below the share from a year ago. This share might be something to watch as Redfin claimed that over time the share has remained consistently around 11%. In other words, the demand for new homes is very strong relative to existing homes. The chart below divides new single family homes by existing home sales (see above for sourcing info).

A Preoccupation with Old Homes?
A quirky story from Marketplace offered an explanation for part of the inventory imbalance: we are too attached to old homes. From M. Nolan Gray, a city planner and housing researcher at the University of California-Los Angeles:
“I don’t think love of old houses is necessarily a problem. But I think a problem that we’re not necessarily contending with is the lack of new housing. So we do tend to give special privilege to older housing. There’s a lot of discourse about the need to preserve as much housing as possible. And we’re really only sort of coming around to recognizing the need to build a lot of new housing, and also just kind of accepting the fact that a lot of new housing is actually nicer in a lot of respects.”
Housing Alternatives
Finally, some people are not attached to any particular home at all. I love the idea Nataliea Abramowitz developed to use Airbnb (ABNB) as a launching pad for exploring different communities while she worked remotely. She plugged into ABNB’s roots helping travelers connect with neighborhoods.
“I first looked on Airbnb kind of as a joke, kind of not really thinking I would find anything in my price range…Before I knew it, I had made a list called ‘TTG,’ which stood for ‘time to go,’ and it was 50 homes strong.”
Be careful out there!
Full disclosure: long ITB shares and call spread, long ABNB, long MTH


Housing stocks sitting at their July 19, Oct 21 Lows….seems like they will make a break one way or the or the other soon.
Yep. This is a very critical juncture!