Stock Market Commentary:
The week’s trading started with intraday extremes to the downside and upside. With such wild swings at work, it is tempting to look backward and conclude that timing bottoms and tops are possible. This reach for precision distracts from the discipline required to navigate through the volatility. Relying on trading and investing rules prevent infection from the market’s manic behavior, tantrums, and euphoria. The outcomes are beyond any one person’s control. However, the decisions and actions are controllable with discipline. This market of extremes places a high premium on this approach.
The Stock Market Indices
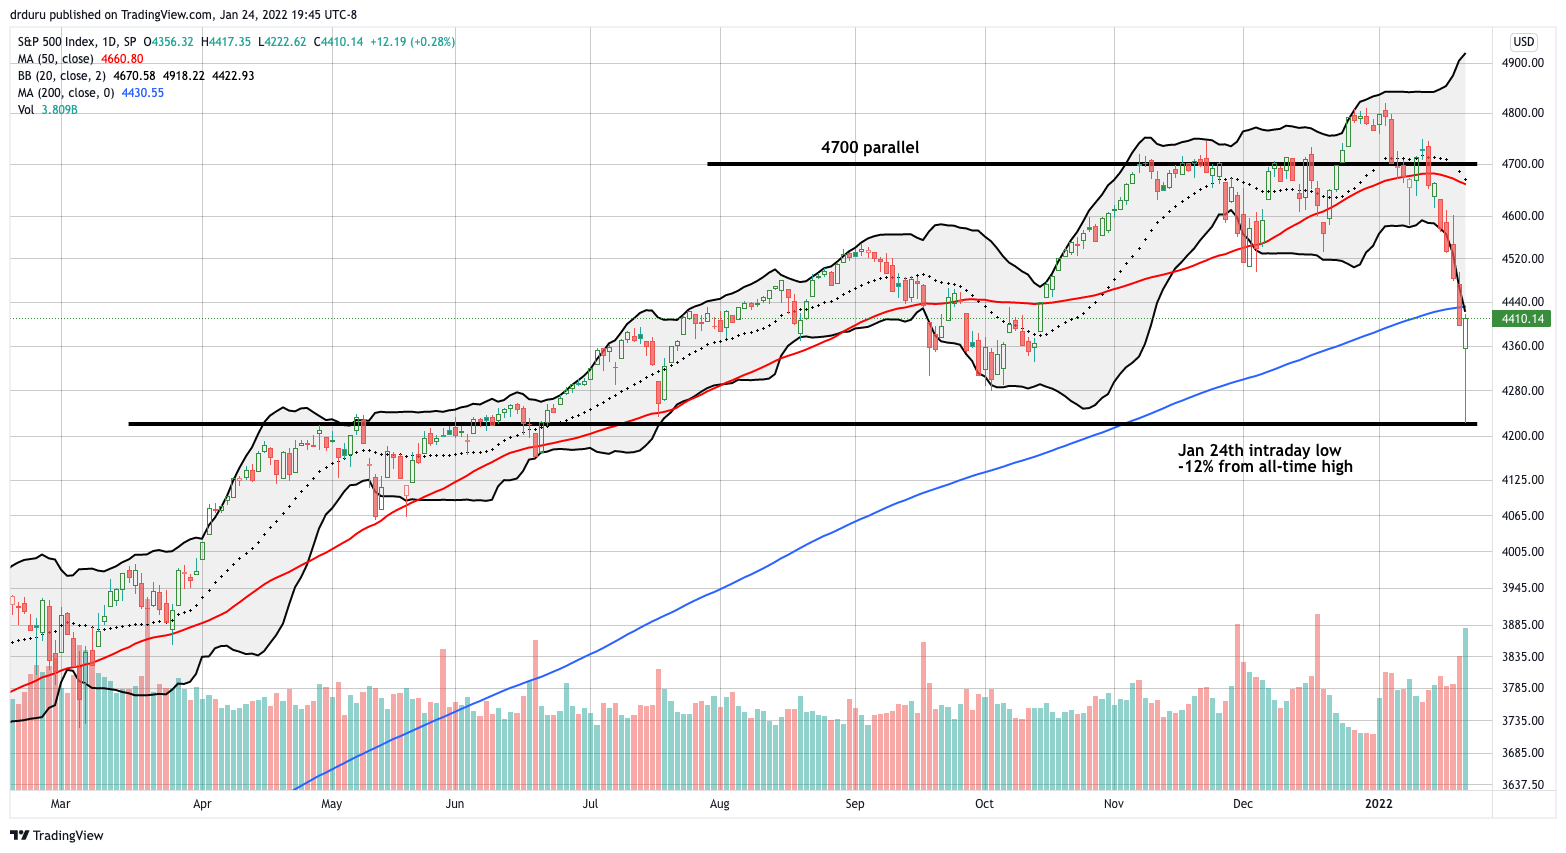
In the previous “Market Breadth”, I claimed that “…there is likely only so much further the S&P 500 will fall before a significant oversold bounce unfolds.” That decline turned out to be 4%. From there the S&P 500 (SPY) rallied sharply to close out the day with a 0.3% gain. Buyers saved the index from a confirmed breakdown below 200-day moving average (DMA) support (the blue line below). At the lows, the S&P 500 extended well below its lower Bollinger Band (BB) to reach prices last seen during a brief pullback last June.
Extreme oversold conditions were rampant across the stock market. Per my plan, I went into bullish mode. As the S&P 500 tested the October low, I added to an existing SPY Feb 04 $450/$460 call spread with a $440/$435 weekly calendar call spread. The short side coincides with the 200DMA. For this position I am betting that either the index stalls around its 200DMA for most of the week, and/or implied volatility implodes for this week’s expiration faster than for next week’s expiration. If SPY just races ahead, my $450/460 call spread will quickly benefit.

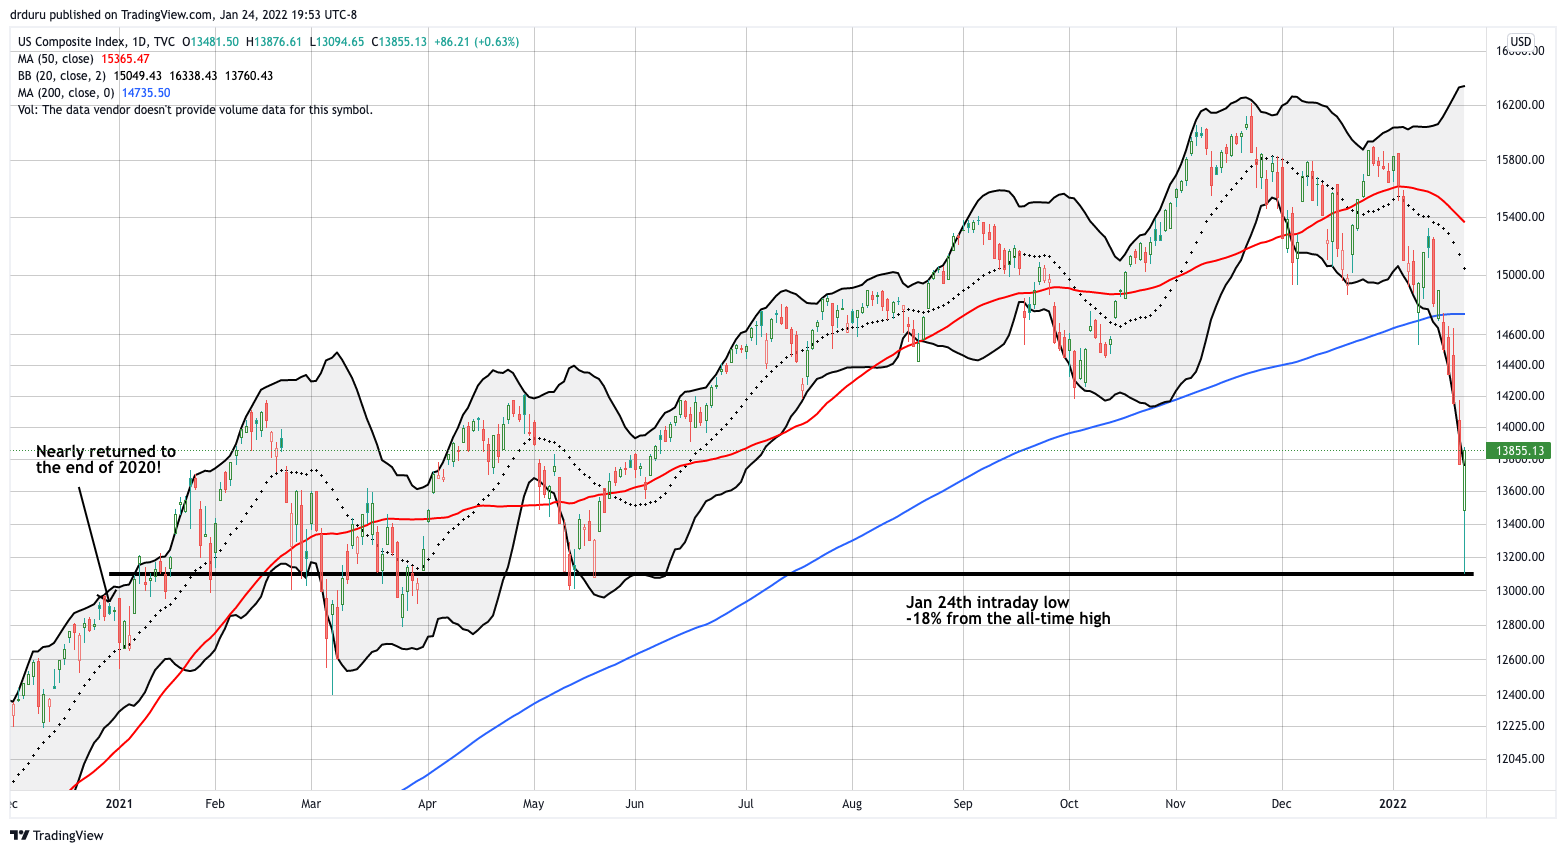
At its intraday low, the NASDAQ (COMPQX) approached bear market territory. The 18% loss from the all-time high stopped just short of the 20% decline that defines a bear market. Moreover, the NASDAQ just barely avoided wiping out all its gains for 2021. Buyers were particularly aggressive in the NASDAQ. The tech-laden index leapt from a 4.9% intraday loss to a 0.6% gain.
All but one of the extremes described below occurred during bear markets. I consider myself warned!

The iShares Russell 2000 ETF (IWM) is the worst off of the indices so perhaps it makes sense it fared best on the rebound from oversold conditions. IWM dropped to a 13-month low before rebounding to a 2.3% gain. Buyers were so aggressive that IWM almost pulled off a bullish engulfing bottoming pattern. I held off adding more IWM call options. I will make a move on follow-through buying.
Stock Market Volatility
The volatility index (VIX) finally lost a battle with the faders. The VIX tested the October, 2020 highs before the market’s buying frenzy sent the VIX back down to a 3.6% gain. Near the peak of the surge, I bought SVXY shares.
The Short-Term Trading Call with Discipline Over Precision
- AT50 (MMFI) = 24.5% of stocks are trading above their respective 50-day moving averages (fell as low as 15.5%)
- AT200 (MMTH) = 31.3% of stocks are trading above their respective 200-day moving averages (fell as low as 25.8%)
- Short-term Trading Call: bullish
AT50 (MMFI), the percentage of stocks trading above their respective 50DMAs, dropped below the 20% threshold that defines oversold trading conditions. Consistent with my plan, I flipped the short-term trading call to bullish. I did not wait to see the close because the market has been racing through extremes of selling for over a week already. The technicals solidified my assessment: the indices traded well below their lower BBs and the VIX stretched extremely high above its upper BB. This is a time for discipline and not for precision. Timing an exact bottom is not the goal of the AT50 trading rules. Instead, the rules prevent selling into a panic and enable profiting from a rebound out of oversold conditions.
As a reminder, most oversold periods last 1 to 2 days. Since the market did not close in oversold territory, I am bracing for an oversold close. At the time of writing S&P 500 futures are down over 1%. Holding that loss could easily close out the stock market in oversold territory just in time for the Fed to sweat out their next decisions on monetary policy.
So what about a bottom for the stock market? I contend that today’s extremes punched out a sustainable bottom. Think of a climactic selling frenzy to price in everything the market fears. The market needs new surprises to motivate even more sellers beyond the level of the current panic. Financial markets are reportedly pricing in 3 to 4 rate hikes this year on top of the Fed ending its dividend reinvestments. Fears should already be high for the worst in Ukraine. The main short-term unknown that could generate fear is earnings season. Could a bellwether like Apple (AAPL) deliver results awful enough to cast a pall on corporate profits for the next quarter or two? Certainly, such a thing is possible, but I am not willing to bet on it.
Regardless, I prefer to stand by the discipline of the trading rules that have stood the test of time than try to forecast today’s idiosyncratic fundamental outcomes.
Be careful out there!
Footnotes
“Above the 50” (AT50) uses the percentage of stocks trading above their respective 50-day moving averages (DMAs) to measure breadth in the stock market. Breadth defines the distribution of participation in a rally or sell-off. As a result, AT50 identifies extremes in market sentiment that are likely to reverse. Above the 50 is my alternative name for “MMFI” which is a symbol TradingView.com and other chart vendors use for this breadth indicator. Learn more about AT50 on my Market Breadth Resource Page. AT200, or MMTH, measures the percentage of stocks trading above their respective 200DMAs.
Active AT50 (MMFI) periods: Day #446 over 20%, Day #3 under 30% (underperiod), Day #5 under 40%, Day #13 under 50%, Day #46 under 60%, Day #226 under 70%
Source for charts unless otherwise noted: TradingView.com
Full disclosure: long QQQ call spread, long IWM calls, long SPY call spread and calendar call spread, long SVXY
FOLLOW Dr. Duru’s commentary on financial markets via StockTwits, Twitter, and even Instagram!
*Charting notes: Stock prices are not adjusted for dividends. Candlestick charts use hollow bodies: open candles indicate a close higher than the open, filled candles indicate an open higher than the close.

I don’t think we’re at the bottom yet. I think we need at least one more day of washout (and maybe two or three), with the markets down about 2-3% before we will get at least an intermediate bottom. People are not frightened enough yet. A VIX over 40 day would be a decent indicator.
Earnings so far have been largely good, and earnings ‘ultimately’ (that could take a while in a market like this) will drive a stock’s price.
Credit spreads still look OK, unlike back in March of 2020. Studies have shown that stocks can still do OK, even in a rising rate environment.
But we need a good washout day (or two). So I don’t think we’re at the bottom yet. T2108 (or AT50, either or both) down to low double digits would be a good indicator from my perspective.
Remember what happened back in March of 2020? T2108 got ‘compressed’ to close to zero, ‘way down into single digits. Even YOU were depressed from what I recall. The mentality needs to move in that direction. But what a buying opportunity that was…
Nevertheless, your thesis is good. Nobody knows where the bottom is, but my take is we aren’t there yet.
Thanks for the reminder from the stock market collapse! 🙂 Yes. That period was extremely rough for all but the coldest short sellers. However, it was a historic collapse. An outlier of outliers. As a result, it is not something to anticipate. At the end of it all, the extreme oversold conditions not only ended, but the stock market literally never looked back. It was amazing to behold on the way down and back up. So it still paid to stick to the rules after the dust settled.
Many times I have heard folks who would otherwise be bullish conclude that a complete washout needed to create a bottom. In these cases I always remind myself…if I am not the one doing panic selling, then who is? Without complete knowledge, I have to stick by the rules.
Having said all that, managing risk is still important. Accordingly, I never declare some extreme is THE bottom. I just think THIS bottom will last long enough for some good bullish swing trades. If we enter a bearish market, then we definitely know bottoms are just resting stops before lower lows.
Another strong open, weak close day. This could go on for a while. Sentiment is particularly negative now, but that in itself won’t do much… at least for a while. T2108 is at 18%, last I saw.
I still don’t think we’ll see at least a short term bottom until there is a really good down day (or two), e.g. down another 3-5%, along with a good spike in the VIX. In the meantime, I am just nibbling, but will take bigger bites should we get some real fear in the market. When I start getting scared (as during the 2020 collapse, not to mention December of 2018), that’s usually the time I need to force myself to buy….but it’s never easy to do. Like Walter Deemer said “When the time comes to buy, you won’t want to.” It’s not very scientific
(is the market??), but it has worked for me in the past. We’ll see if we get that opportunity.
I’m hopeful that we DON’T end up with a market that slowly, painfully just grinds lower and lower…for a long time.
Everything you say makes sense. Deemer was particularly wise!
If we are descending into a bear market, I suspect what we get will exactly be a painful grind lower with occasional bouts of false hope. It is interesting to consider that bear markets are now so rare (thank you Fed!) that I don’t think there is any good way to wait them out with consistent rules… unless you just stick with the moving averages.
Last time MMFI less than 20 on multiple days in a week—Pandemic and before that Oct 2018 (back drop of Fed increasing Rates and Trump tweeting about it). Not the inflation problem we have now though. Agree with JIM bottom to come and people aren’t scared enough yet. Money leaving pre-profit companies like crazy. Fundamentals seem to be coming back.
Dr, whats your thoughts on SU? Can apparently make money when Oil is 35-40 dollars a barrel. Increased their dividend recently.
My convention is the longer the market stays in oversold, the more likely it will go lower. We are reaching that point here!
The chart on SU looks good. Note earnings are coming next week though.
Dividend plays are good in general at this market juncture.