
The stock market convincingly followed through on last week’s bullish divergence that indicated strengthening stock market breadth.
At the time of the bullish divergence, AT40 (T2108), the percentage of stocks trading above their respective 40-day moving averages (DMAs), powered higher even as the S&P 500 (SPY) lost 1.0%. The index also suffered a 50DMA breakdown. AT40 is short-term indicator of stock market breadth. As AT40 increases, more and more stocks participate in the stock market’s gains. As AT40 decreases, fewer and fewer stocks participate in the stock market’s gains.
Now, a longer-term measure of stock market breadth, AT200 (T2107), the percentage of stocks trading above their respective 200DMAs, stretched toward a major milestone. At 53.1%, AT200 is close to reversing all its losses from the big breakdown that preceded March’s stock market collapse.
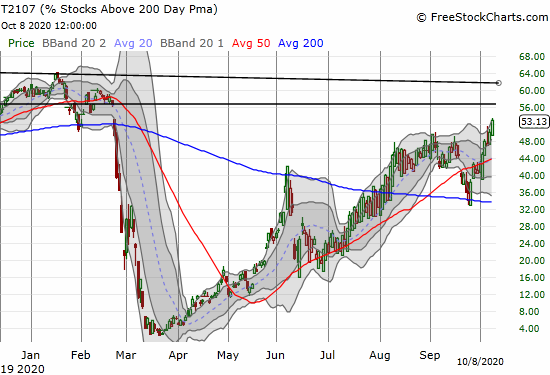
AT200 indicates more than half the stock market is once again trading above an important long-term moving average. This broadening of stock market breadth is very bullish. Moreover, AT40 still has 10 percentage points of upside before it hits overbought levels. In other words, the stock market has more room to run before a bearish case looms again.

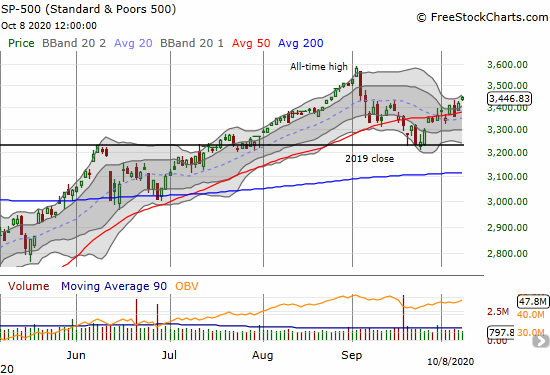
In synch with AT40, the S&P 500 (SPY) has room to run before it regains all-time high status. The index closed at a one month high and confirmed its 50-day moving average (DMA) as support. The S&P 500 cleared the consolidation pattern pivoting around the 50DMA.
The NASDAQ is moving similarly to the S&P 500. While its performance on the day lagged a little, the tech-laden index is in the same relative position as the S&P 500.

The Flip Flop that Launched Further Stock Market Breadth
There is of course an irony to the stock market’s breakout, confirmation of support levels, and strengthening breadth. On Tuesday (October 6th), the bullish case blew apart at the seams. Ahead of the market close, President Donald Trump abruptly tweeted a demand that Republicans end negotiations with Democrats on a stimulus package for the American economy ailing from the coronavirus pandemic. Trump indicated his willingness to wait until after the Presidential election next month. The stock market responded with swift selling. Suddenly, the S&P 500 broke down below 50DMA support.
Within hours, the President stood down and flip flopped. Trump returned to twitter to launch a new set of stimulus negotiations. Stock futures immediately launched higher. By Wednesday morning the S&P 500 obliged with a small gap right back over its 50DMA. The bullish case returned to the driver seat in a flash.
The whiplash headlines and stock market action flash back to the clamor over the U.S. trade war with China. After the trade balance hit a 10-year low (a trade deficit) in December, 2018, things finally turned around. Just ahead of the pandemic, the trade balance hit its highest point of Trump’s administration. The current recession plunged the trade balance to a new 14-year low.
Source: U.S. Bureau of Economic Analysis and U.S. Census Bureau, Trade Balance: Goods and Services, Balance of Payments Basis [BOPGSTB], retrieved from FRED, Federal Reserve Bank of St. Louis, October 8, 2020.
In the end, the stock market moved on even as the trade war simply took a pause. Clearly, the stock market is perfectly happy with deep trade deficits in the U.S. The clamor of stimulus negotiations promises to deliver dynamics similar to the trade war with China. Lesson learned: just buy the Trump dips.
Be careful out there!
Full disclosure: no positions