
Housing Market Intro and Summary
The housing downturn ended almost as quickly as it began. V-shaped recoveries are evident across a spectrum of data, especially in home builder sentiment and new home sales. Home builders continue to describe extremely strong demand that, in many cases, goes beyond the release of buying power pent-up by the pandemic-driven shelter-in-place orders from March to May.
Now it is time to reconsider the divergent performances in the market for housing as an economic recession continues apace. In the last Housing Market Review, I described this divergence as a notable split between the fortunes of housing and the employment picture. KB Home (KBH) summarized the situation well in its earnings conference call: (from the Seeking Alpha transcript, emphasis mine):
“Well, I do think there’s still pent up demand, because the country shut down in the strongest selling period of the year, the demographics didn’t go away. And I think the headline employment, unemployment numbers are not necessarily home buyers, it’s low level wage service employees or whatever. So there’s a lot of demand out there from the demographics and the people that are employed and there’s no inventory.”
The U.S. will be grappling with these two economies for some time to come. Some workers who lost jobs will not return to the workforce for some time to come. Those who do return will find themselves further behind on their finances, hopes, and dreams. Meanwhile, the workers who were able to maintain employment and even buy homes are racing ahead with a lot of monetary and fiscal stimulus further bolstering their prospects.
As home builder earnings continue to unfold, a more subtle divergence has emerged across various stocks. KB Home suffered a post-earnings setback with an 11.9% loss. The stock finished filling that gap last week.
TRI Point Group (TPH) set up high expectations with its June sales report. Despite strong follow-through with its earnings report, TPH sold off by 4.5%.
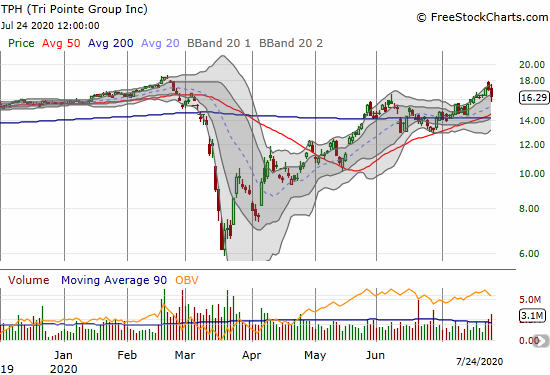
I will review the results in detail in a future post. My initial read is that analysts were disappointed that sales guidance for the second half of the year was overly conservative. I think the company explained its conservatism quite well. I used the pullback as a buying opportunity.
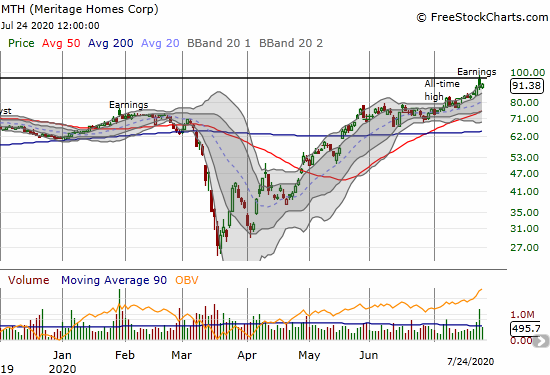
Meritage Homes (MTH) hit a fresh all-time high ahead of earnings. The stock surged as much as 9.7% before closing the day flat. Buyers tentatively returned the next day for a 2.1% gain. Meritage Homes has been a difficult company to read and MTH a difficult stock to read. I will reviewing the earnings results particularly closely as the stock is behaving as if further upside is limited for now.
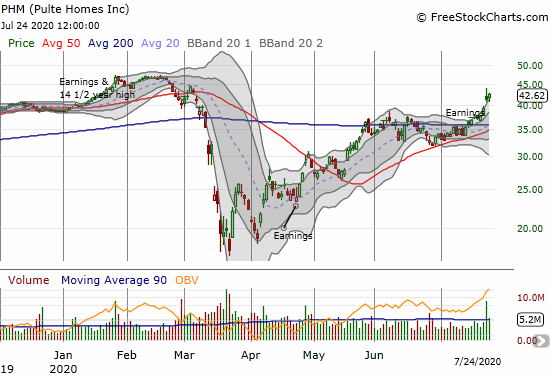
Pulte Homes (PHM) likely has more upside ahead. The stock faded post-earnings but still locked in a 4.7% gain after reporting earnings. Buyers returned the next day for a 3.2% gain and a new post-earnings high. PHM looks on target to retest the pre-pandemic highs set in February.
The collective action in the stocks of home builders has sent the iShares Dow Jones US Home Construction Index (ITB) right to its all-time high which was last set in February just ahead of the pandemic. The strong price action has forced me to reconsider the seasonal trading and investing strategy in home builders. While I have taken profits on all my shares of ITB, I am now selectively buying the stocks of home builders based on my understanding of their “post-pandemic” earnings reports. Overall, I am most wary about the sustainability of these strong results given the U.S. economy remains stuck in the throes of a recession.
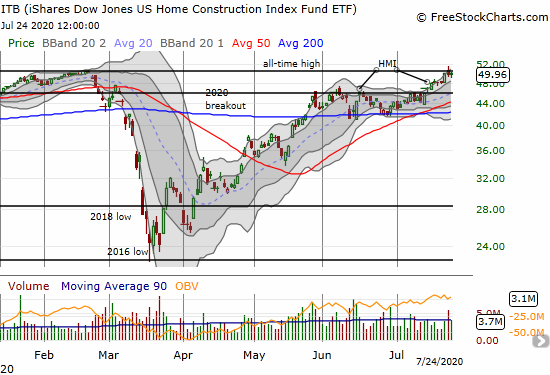
Source for charts: FreeStockCharts
Housing Data
New Residential Construction (Single-Family Housing Starts) – June, 2020
Housing starts continued a rebound although they are still lagging the rebound in builder sentiment which completed a full recovery from the March crash (see below). I still expect starts to come back more slowly given the economic uncertainty related to the coronavirus pandemic. Moreover, most builders paused land purchases and development during the pandemic; they will necessarily be slow to normalize activity.
June single-family home starts hit 831,000, which was 17.2% above May’s 709,000 starts (revised significantly upward from 675,000) and 3.9% below levels from June, 2019. The rate of year-over-year decline is rapidly improving from April’s 22% and May’s 18% declines.
Source: US. Bureau of the Census, Privately Owned Housing Starts: 1-Unit Structures [HOUST1F], first retrieved from FRED, Federal Reserve Bank of St. Louis, July 24, 2020.
Starts are notably a far cry from pre-pandemic levels. In parallel with strong demand, inventory imbalances and elevated prices may persist for months to come.
For May, the regional changes were decidedly down with the Northeast once again suffering the most. For June, the Northeast led all regions with the only positive year-over-year change. The Northeast, Midwest, South, and West each changed +53.2%, 0.0%, -7.9%, and -9.9% respectively.
Existing Home Sales – June, 2020
Home buyers and sellers are finally getting more comfortable with the marketplace for existing homes.
The divergence between declining sales and increasing prices for existing home sales grew for three straight months through May. For June, existing home sales finally increased month-over-month for the first time since the February, 2020 peak. The National Association of Realtors (NAR) celebrated a record performance born from months of pent-up demand: “The sales recovery is strong, as buyers were eager to purchase homes and properties that they had been eyeing during the shutdown…This revitalization looks to be sustainable for many months ahead as long as mortgage rates remain low and job gains continue.”
The seasonally adjusted annualized sales in June of 4.72M were up 20.7% month-over-month from the non-revised (second month in a row) 3.91M in existing sales for May. Year-over-year sales still dropped 11.3%. The NAR called May’s plunge in sales a trough; so far, so good.
Condos led the way downward during the pandemic by plunging to levels unseen since at least 1999 (available data). Condos look to lag on the way up. While condos jumped 29.4% from May to June, they dropped 22.8% year-over-year.

(As of the March, 2018 data, the NAR further reduced historical data to just 13 months. For historical data from 1999 to 2014, click here. For historical data from 2014 to 2018, click here) Source for chart: National Association of Realtors, Existing Home Sales© [EXHOSLUSM495S], retrieved from FRED, Federal Reserve Bank of St. Louis, July 24, 2020.

Inventory levels continued their year-over-year declines. Absolute inventory levels of 1.57M homes increased 1.3% from May (which was lower than the previous month’s 6.2% increase) but declined 18.2% from a year ago (compare to May’s 18.8%, April’s 19.7%, March’s 10.2%, February’s 9.8%, January’s 10.7% and December’s 8.5% year-over-year declines, unrevised). These double-digit year-over-year declines represent an interrupted Spring selling season where sellers feared exposure to coronavirus from buyers visiting their homes. “Unsold inventory sits at a 4.0-month supply at the current sales pace, down from both 4.8 months in May and from the 4.3-month figure recorded in June 2019.” The on-going year-over-year decline in inventory is now on a thirteen month streak. The limited inventory continues to help drive home prices ever higher.
The median price of an existing home hit $295,300, a year-over-year increase of 3.5% and the 100th straight month of a year-over-year gain. The median price jumped from May by 4.1%.
First-timer home buyers pushed up their share of sales in March to 34% and to 36% in April. For May, first-timers fell back to 34% and nudged back up to 35% in June. The NAR’s 2017 Profile of Home Buyers and Sellers reported an average of 34% for 2017, 33% for 2018, and 33% for 2019.
Investors stepped into the breach in May by increasing from April’s 10% share of sales to 14%. This share plunged down to 9% in June which seems to be a seasonal pattern: last June featured a 10% share. In the last Housing Market Review, I wondered aloud whether the bounce in investor share was related to the fortunes of investors in the stock market relative to the income first-timers typically rely upon to buy homes. These factors could not be at play for June.
The West led the regional month-over-month changes after two straight months of leading the regions downward on a year-over-year basis. The West soared 31.9% from May to June. This was enough to avoid being a leader to the downside once again on a year-over-year basis. In June, the regional year-over-year changes were: Northeast -27.9%, Midwest -13.4%, South -4.0%, West -13.6%.
From September through April, all regions experienced notable and robust price jumps. In May, the West finally broke that streak with a rare price pullback. The regions all lined up for solid gains in June. Here are the June regional year-over-year changes in median home prices: Northeast +3.6%, Midwest +3.2%, South +4.4%, West 5.4%. Overall, these are still exceptional price performances given the year-over-year decline in sales.
Single-family home sales increased 19.9% from May and decreased on a yearly basis by 9.9%. The median price of $298,600 was up 3.5% year-over-year and up significantly from May’s $287,799. Condo sales changed even more than single-family homes: +29.4% from May and down 22.8% year-over-year. The relative retreat from living in multi-family dwellings in dense urban cores continues to unfold.
California Existing Home Sales – June, 2020
In May, California suffered an historic drop in sales of existing single-family homes. The 238,740 annualized homes sold was the lowest since at least March, 2008. June delivered a rebound for the record books as sales increased 42.4% for the largest month-over-month gain since the California Association of Realtors (C.A.R.) started collecting records almost 40 years ago. A shift in mix toward more expensive homes also sent the median price soaring at a record monthly pace of 6.5%. This shift in mix contradicts the push of home builders in the state toward more affordable offerings.
On a year-over-year basis, the median price increased 2.5% despite a 12.8% plunge in sales. The rush to buy homes sent inventory spiraling downward as active listings were hard to come by. Active listings declined a whopping 43% year-over-year. Inventory fell from May’s 4.3 months of supply to just 2.7 months in June. San Francisco was the only county in the Bay Area to experience an increase in active listings.
The counter-trend shift in price mix could be a temporary function of the initial rebound where Californians with jobs and resources are acting a little faster to buy a home: “Homes priced below $500,000, which made up 48 percent of total sales in the California market in May 2020, only comprised 44 percent of all sales in June 2020. Sales of million-dollar properties, on the other hand, increased in market share to 18.1 percent in the most recent month compared with 15.6 percent in May 2020.” C.A.R. does not consistently report on this price mix, so it may not be possible to monitor the implications.
With coronavirus cases surging in California, C.A.R. rightfully noted caution with this rebound: “While the momentum is expected to be sustained as we kick off the third quarter, the resurgence in coronavirus cases remains a concern and may hinder the market recovery in the second half of the year.” However, if the results of home builders translate to the existing home market, home buyers may act with even more urgency.
New Residential Sales (Single-Family) – June, 2020
Of all the startling housing data, new home sales really took me aback. Even two months ago I would not have projected a new 13-year high in sales. The 776,000 in annualized sales nudged over the 774,000 in new home sales in January, 2020. This rebound further emphasizes a strong preference in the market for new over existing homes.
June’s new home sales leapt 13.8% from May’s upwardly revised 682,000 and increased 6.9% year-over-year. New single-family home sales look ready to resume the prior uptrend.
Source: US. Bureau of the Census, New One Family Houses Sold: United States [HSN1F], first retrieved from FRED, Federal Reserve Bank of St. Louis, July 26, 2020.
Since hitting a peak in November and December, 2017, the median price of a new single-family home trended slightly downward largely from a ramp in entry-level and lower-priced new homes. April’s $307,100 (re-revised upward) was close to the lows seen over the last two years. May’s $310,200 (revised downward) was not much better. June’s median price surged 6.1% to $329,200, a near return to the pre-pandemic median of $331,800 in February. Home builders have talked a lot about driving sales at more affordable price points but the shift from May to June was mostly about homes at higher price points. Homes priced from $150,000 to $199,999 plunged in share from 11% to 6% while all homes priced $400,000 and above increased in share. The “sweet spot” of $200,000 to $299,999 increased in share from 33% to 35% while the $300,000 to $399,999 range covering the median actually fell from 27% to 26%.
The monthly inventory of new homes increased from 5.0 to 6.4 months of sales in March. May’s strong demand pushed inventory back to 5.6 months of sales. June’s inventory was just 4.7 months of sales.
Unlike May, sales gains did not occur across all regions, a very surprising development. The Northeast led by far again with the South coming in as a major laggard. June year-over-year sales in the Northeast surged 111.5%, the Midwest jumped 33.3%, the South ended three straight months of gains with a 1.8% drop, and the West eked out a 4.1% gain after surging 31.0% in May.
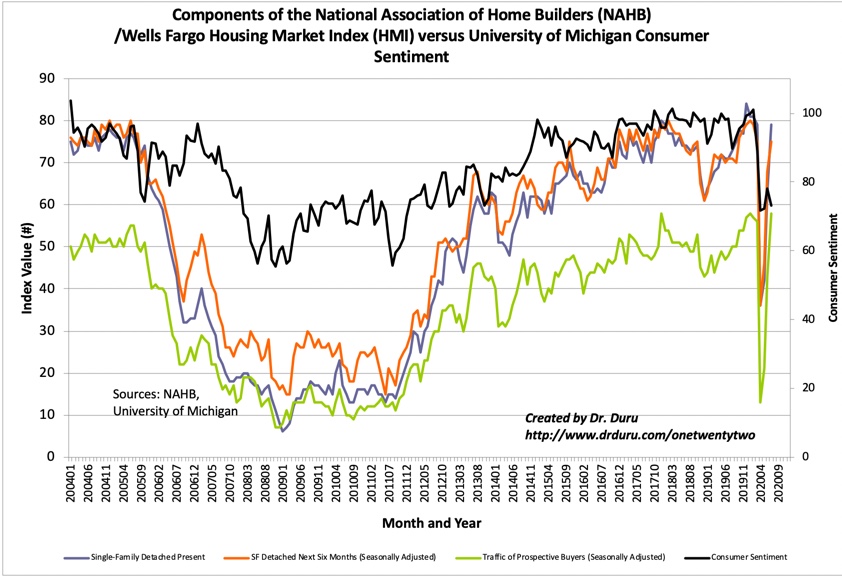
Home Builder Confidence: The Housing Market Index – July, 2020
The National Association of Home Builders (NAHB) reported an impressive 14-point rebound in the NAHB/Wells Fargo Housing Market Index (HMI). The HMI returned to its level in March, 2020 which reflected mostly pre-pandemic readings. Most importantly, the component measuring the traffic of prospective buyers closed July two points above its March reading which and matched the all-time high from January, 2020. In other words, not only are builders increasingly optimistic, but also they are just about as optimistic about the future as they can be.
Source: NAHB
This streaking optimism sharply contrasts with the setback in consumer sentiment in July. The HMI and consumer sentiment are often well-correlated, however a two-speed housing market in a two-speed economy can support divergent sentiment readings: the economically distressed express their worries and the economically well-off continue to buy homes. The divergence between home buyers and the rest of the economy will likely become a more and more salient theme in coming months unless the economy manages to drag once again on the housing market.
The NAHB expressed concerns about costs while at the same time applauding the strong demand characteristics of the market:
“Lumber prices are at a two-year high and builders are reporting rising costs for other building materials while lot and skilled labor availability issues persist. Nonetheless, the important story of the changing geography of housing demand is benefiting new construction. New home demand is improving in lower density markets, including small metro areas, rural markets and large metro exurbs, as people seek out larger homes and anticipate more flexibility for telework in the years ahead. Flight to the suburbs is real.”
For the second month in a row, all regions rebounded. The Northeast was a surprising leader. At 70, the Northeast’s HMI is at a 15-year high. The Midwest nudged one point above its highs for 2020. The West beat its March, 2020 HMI by one point while the South’s HMI remains three points behind the March level.
Home closing thoughts
Pending Home Sales
On May 28th, the NAR reported pending home sales that greatly disappointed the stock market even though the NAR expected “April’s pending home sales to be the lowest point for the year, and the month of May to, therefore, be the lowest point for closed sales.” The NAR nailed the projection (which speaks volumes about the inefficiencies of the stock market). Now, pending sales suggest a peak in sales is finally happening with delayed seasonal effects. Financial markets may initially misinterpret the coming slowing in sales as indicative of a worsening market.
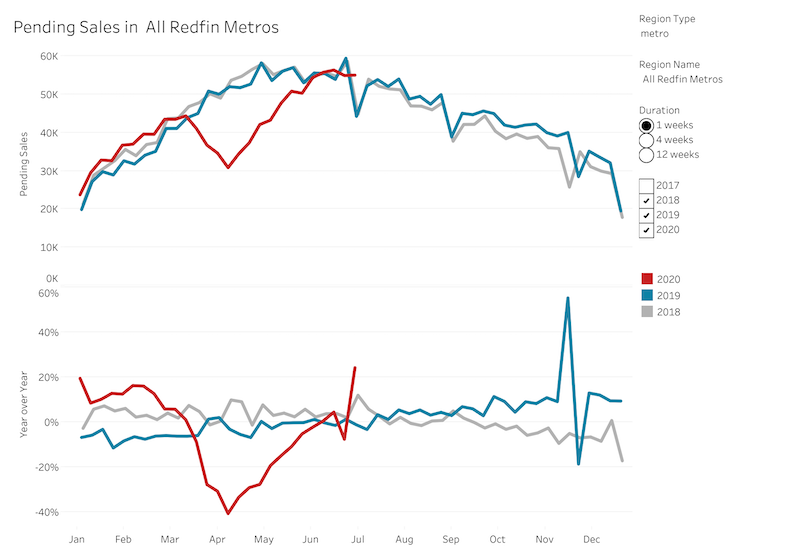
Source: Redfin
Two Speed Market for Shelter
While the market for new and existing home sales is soaring, many more Americans are worrying whether they will be able to pay the rent. These households will NOT be moving on to home ownership. The wrangling in Congress about another round of financial support for Americans suffering the fallout from the pandemic will help determine the growth of the gulf between the housing haves and have-nots. In June, 20% of renters failed to pay the full amount of their rent according to Marketplace.
Be careful out there!
Full disclosure: long KBH call options, long TPH