
Stock Market Statistics
AT40 = 56.1% of stocks are trading above their respective 40-day moving averages (DMAs)
AT200 = 32.5% of stocks are trading above their respective 200DMAs
VIX = 25.7
Short-term Trading Call: neutral
Stock Market Commentary
Last week started with a growl and ended quietly. The stock market quickly transitioned from confirming a bearish divergence to snapping back into business as usual and now the market features several key bullish setups and breakouts. The setups in particular create a dividing line between the official end of an earlier bearish divergence and a sudden resumption of bearish trading.
AT40 (T2108), the percentage of stocks trading above their respective 40-day moving averages (DMAs), closed at 56.1% and looks ready to resume a march toward the overbought threshold of 70%. AT200 (T2107), the percentage of stocks trading above their respective 200DMAs, crawled higher to 32.5% and is back to supporting the 200DMA breakout trades.
The coming week is full of earnings news that will likely throw the market for several loops. I will be most interested in trading post-earnings price action.
The Stock Market Indices
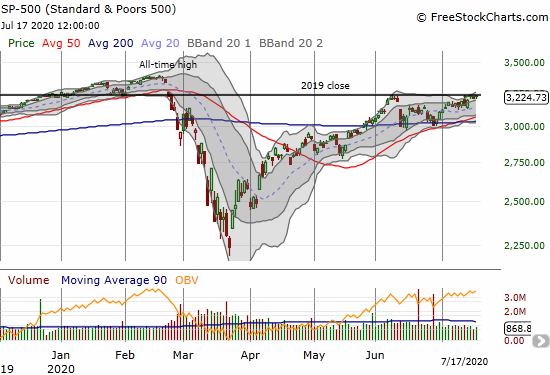
The S&P 500 (SPY) inched ever closer to a breakout above the June 8th high which also marks a false breakout above the 2019 close. A confirmed breakout will be a buying signal (confirmed in this case means a close above resistance followed by a higher close).
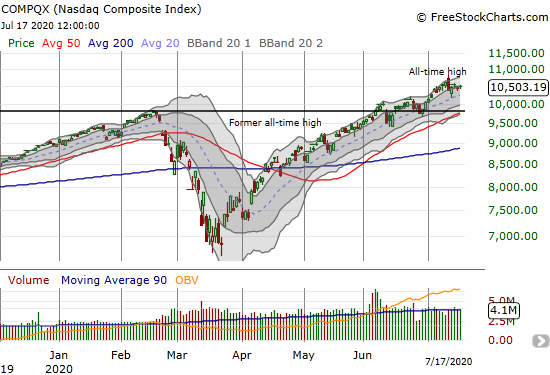
The NASDAQ (COMPQX) is suddenly in “prove it” mode as it tries to recover from last week’s fade from all-time highs. After bouncing perfectly off 20DMA support, the tech-laden index quieted right down to a slow churn.
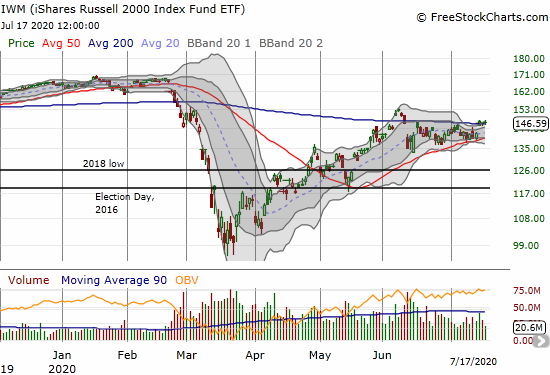
The iShares Russell 2000 Index Fund (IWM) is back on my radar for a buy as the index of small cap stocks crept over its 200DMA resistance. Somehow, IWM managed a breakout and two additional closes above 200DMA resistance without confirming the breakout. I am a buyer on the confirmation even ahead of a breakout above the June high. A healthier IWM will be a strong signal for the economic recovery as smaller businesses have suffered mightily during the pandemic.
Volatility
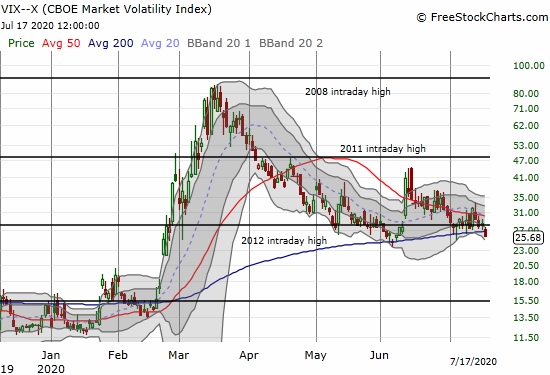
The volatility index (VIX) wilted further. The VIX’s steady weakness is growing into a more and more bullish sign for the market. Still, I added to my position in UVXY as a hedge. If the June lows give way with AT40 in overbought territory, I will brace for an extended overbought rally. Note that the VIX is technically still “elevated” at levels above 20.
The Short-Term Trading Call
The short-term trading call stays neutral. The signals are favoring the bulls and the buyers with many enticing bullish setups (some discussed below). Still, I remain unwilling to get off the fence. As stated above, there are now several key signals to watch for clues on next moves. Moreover, the market is still in two-speed mode and the bearish parts of the market can still drag the trading action down at any time.
Stock Chart Reviews: A Video Summary
Stock Chart Reviews – Below the 50DMA
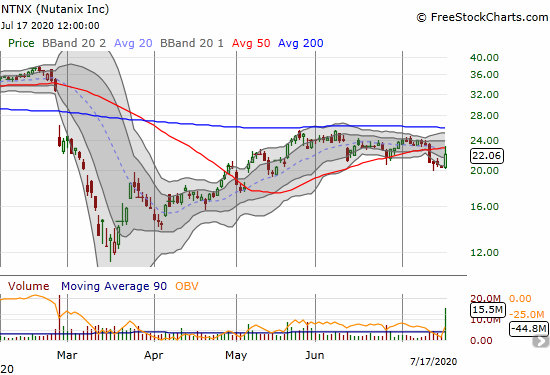
Nutanix (NTNX)
Traders got reignited over Nutanix (NTNX) thanks to take over speculation. They were not quite excited enough to end the 50DMA breakdown. I explore the setup in detail in “Nutanix: A Stock and Company Ready for a Takeover.”
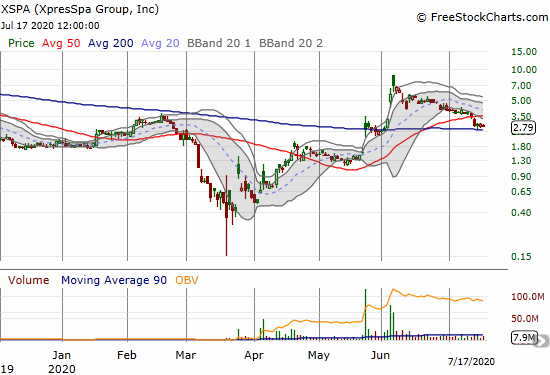
XpresSpa Group (XSPA)
Single-digit stocks with severely compromised business models (or no viable business model at all) have periodically excited speculators in this market awash with Fed-sponsored liquidity. XpresSpa helps people relax ahead of their flights. The company recently entered the business of COVID-19 screening at airports. XpresSpa got a new CEO in February as part of a turn-around plan…and that organizational change was before the pandemic snatched the rug from under the company’s feet.
Airports have a lot fewer customers so the crash to in March to $0.15/share made sense, even if a bit extreme. At its all-time closing low, XSPA closed at $0.37 and rallied to as high as $8.82 on June 5th. The stock has faded steadily since then and is now trying to hold onto 200DMA support.
The stock traded as high as $3200 (those zeroes are NOT typos!) in June, 2012 so this is a company that has liberally used reverse stock splits to stay listed. XSPA last reverse split on June 10th. Buyer beware.
Stock Chart Reviews – Above the 50DMA
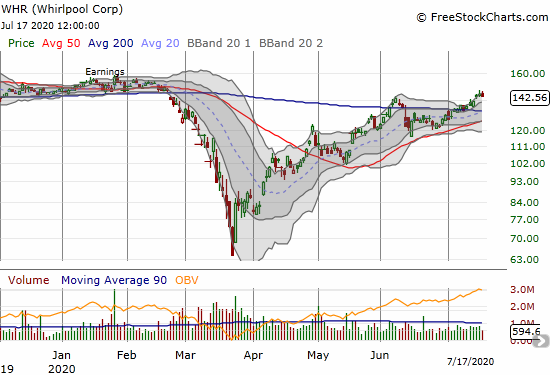
Whirlpool (WHR)
Whirlpool (WHR) is climbing slowly and steadily higher as part of a 200DMA breakout. The stock has (incredibly) almost completed a full COVID-19 recovery.
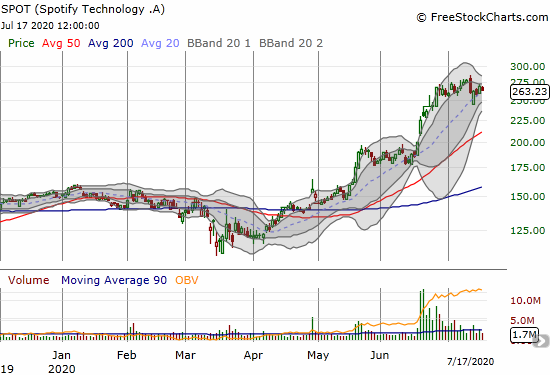
Spotify Technology (SPOT)
My calendar call spread play on Spotify Technology (SPOT) looked set for success at the start of last week. SPOT even gapped up a bit on Monday. I blinked and the remaining long side of my call plunged into the abyss. All I could do was sit on the position and see whether SPOT could pull off yet another press release to goose the stock higher. News came about a podcast with Michelle Obama earned the stock a 3.9% gain that maintained 20DMA support on Thursday. The news was too little too late.
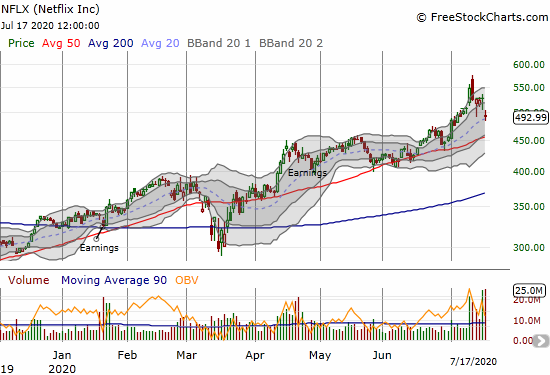
Netflix (NFLX)
While it makes sense to me that Netflix (NFLX) stumbled post-earnings on Friday, the 6.5% loss is a mere dent compared to the run-up into earnings. NFLX even held onto 20DMA support. Moreover, the stock was down 10% or more in after hours trading on Thursday. Something tells me the buyers are already in the process of scooping up this “discount.”
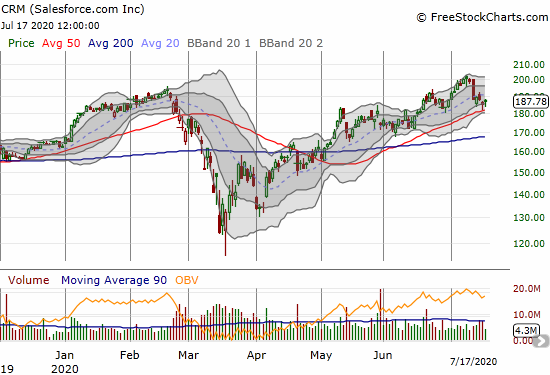
Salesforce.com (CRM)
Salesforce.com (CRM) lost 5.3% the day tech fell. Like many important big cap tech stocks, CRM tumbled off an all-time high. On Thursday, CRM bounced in picture perfect form off 50DMA support. The stock also gained 1.2% on Friday as minor follow-through. With earnings still a month away, I like buying the stock and even call options here with a stop below 50DMA support.
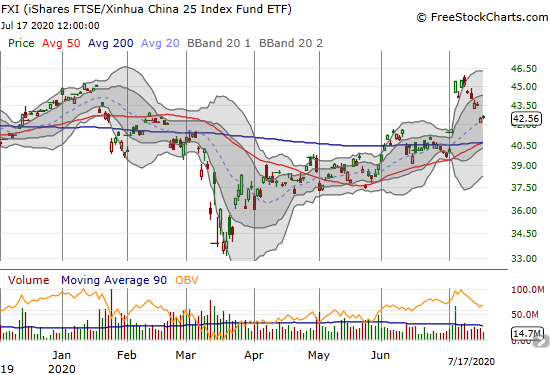
The iShares FTSE Xinhua China (FXI)
Fortunately, I resisted the temptation to chase the iShares FTSE Xinhua China (FXI) higher when it suddenly surged on July 6th. FXI has traded mostly lower since then. It now faces a key test against 20DMA support. I am a buyer on a rebound or a test of converged 50 and 200DMA support.
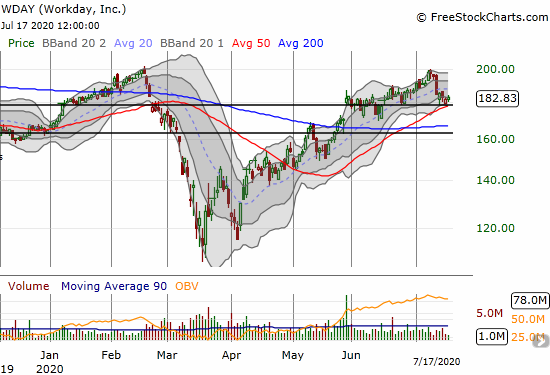
Workday (WDAY)
Workday (WDAY) was taken down 5.7% at the beginning of last week when tech tumbled. WDAY is now holding onto support from the converged top of a former trading range and an uptrending 50DMA. Earnings do not happen until August 27th so this is an “easy” buy with a stop below support.
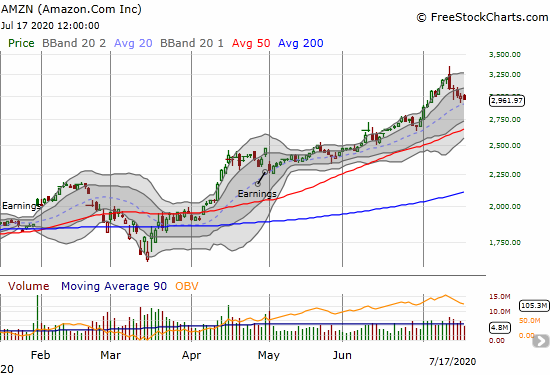
Amazon.com (AMZN)
Amazon.com (AMZN) printed a bearish engulfing pattern after setting its last all-time high. That gap up and fade to a 3.0% loss on the day helped convinced me at the time that a lasting confirmation of the bearish divergence was underway. While sellers maintained the pressure on AMZN, so many other parts of the stock market recovered quickly. AMZN bounced off 20DMA support on Thursday but lost 1.3% on Friday. A fresh close above $3000 is a buy signal. A break through the 20DMA puts 50DMA support in play.
Stock Chart Spotlight – Bullish Breakout
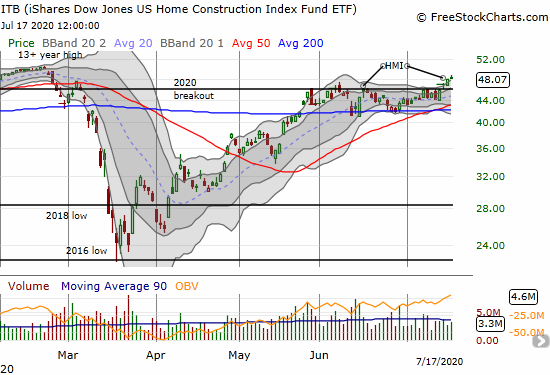
iShares U.S. Home Construction ETF (ITB)
The iShares U.S. Home Construction ETF (ITB) achieved an important breakout on the heels of another strong report on builder sentiment and a decent report on housing starts. I covered the details in “Housing Sentiment Completes V-Shaped Recovery, Stocks Following.”
— – —
FOLLOW Dr. Duru’s commentary on financial markets via email, StockTwits, Twitter, and even Instagram!
“Above the 40” uses the percentage of stocks trading above their respective 40-day moving averages (DMAs) to assess the technical health of the stock market and to identify extremes in market sentiment that are likely to reverse. Abbreviated as AT40, Above the 40 is an alternative label for “T2108” which was created by Worden. Learn more about T2108 on my T2108 Resource Page. AT200, or T2107, measures the percentage of stocks trading above their respective 200DMAs.
Active AT40 (T2108) periods: Day #67 over 20%, Day #61 over 30%, Day #6 over 40%, Day #2 over 50% (overperiod), Day #17 under 60% (underperiod), Day #20 under 70%
Daily AT40 (T2108)
")
Black line: AT40 (T2108) (% measured on the right)
Red line: Overbought threshold (70%); Blue line: Oversold threshold (20%)
Weekly AT40 (T2108)

*All charts created using FreeStockCharts unless otherwise stated
The T2108 charts above are my LATEST updates independent of the date of this given AT40 post. For my latest AT40 post click here.
Be careful out there!
Full disclosure: long ITB shares and short calls, short CWH puts, long PLCE call
*Charting notes: FreeStockCharts stock prices are not adjusted for dividends. TradingView.com charts for currencies use Tokyo time as the start of the forex trading day. FreeStockCharts currency charts are based on Eastern U.S. time to define the trading day.