
AT40 = 71.2% of stocks are trading above their respective 40-day moving averages (DMAs) (overbought day #1)
AT200 = 63.8% of stocks are trading above their respective 200DMAs (11-month high)
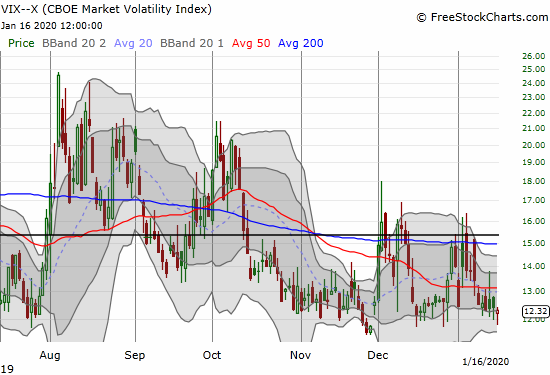
VIX = 12.3
Short-term Trading Call: neutral
Stock Market Commentary
Whispers of bearish divergences are finally over.
I did not think overbought conditions would happen anytime soon, especially after China and the U.S. signed a trade deal I figured the market already priced in. After 75 days trading under the 70% threshold that represents overbought, AT40 (T2108), the percentage of stocks trading above their respective 40-day moving averages (DMAs), finally got the job done.
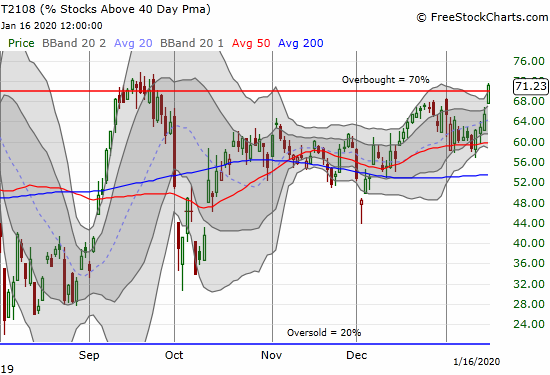
The turn-around was swift, meaning that buyers rushed to find “bargains” among stocks that were lagging behind the few concentrated stocks getting most of the attention in this latest rally.
AT200 (T2107), the percentage of stocks trading above their respective 200DMAs, was even more impressive and more bullish. AT200 continued a breakout from Wednesday to close at a near 2-year high. This achievement means this longer-term index is finally completing a reversal of its losses from the climactic peak that ended a strong year-beginning rally in 2018.
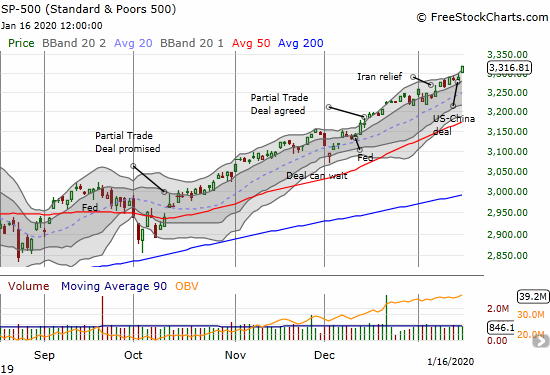
The S&P 500 (SPY) is now in sync with the breadth indicators, but is also very stretched. The index gained 0.8% for a fresh all-time high. The S&P 500 closed above its upper Bollinger Band (BB) for the first time in a month. The move was like a delayed reaction to the official signing of a trade deal between the U.S. and China. I thought the deal would fall apart ahead of the signing, but clearly both sides were determined to get something done…despite most tariffs remaining in place against China through at least November, 2020.
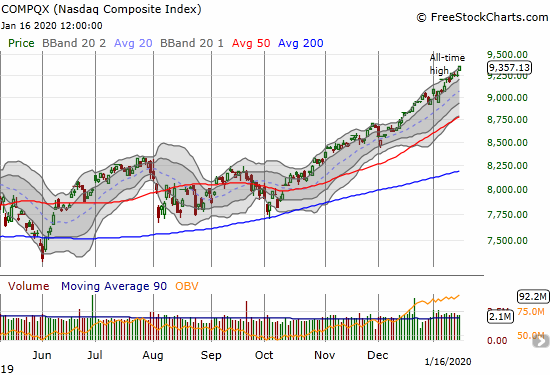
The NASDAQ (COMPQX) is as impressive as ever.
Volatility
The volatility index (VIX) remains stubborn. The VIX is still holding 12 as support. This resilience is one lingering knock on the rally, but it is not sufficiently contrary to get me bearish on the stock market. However, the firming support is a reason to keep trying long volatility plays. As a reminder, extra low volatility (ELV), a VIX under 11, can be very bullish for the S&P 500. Such a descent could become the final ingredient for an extended overbought rally.
The Short-Term Trading Call
With a gap up and into overbought trading conditions, I am lifting my bear/bull line in the sand from $320 to $326.50 for SPY. Per the AT40 Trading rules, I will not get bearish on the market while my favorite index is in overbought territory. AT40 must confirm a drop from overbought territory before I even consider downgrading from my very cautious short-term neutral stance.
Stock Chart Reviews – Below the 50DMA
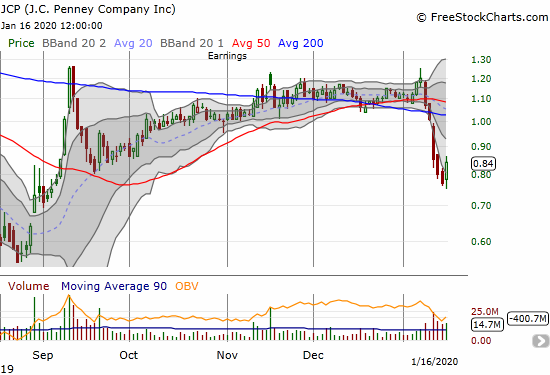
J.C. Penney Company (JCP)
I waited patiently since mid-November for a confirmed 200DMA breakout on J.C. Penney Company to transform into a sustained rally. My JCP trading call looked like a winner when the stock burst out the gate for 2020. However, in the blink of an eye and with no driving news that I could find, this extremely speculative trade went underwater with a 50 and then a 200DMA breakdown. I was slow to react and close down my position. Now I am waiting to see whether the recent low holds.
Stock Chart Reviews – Above the 50DMA
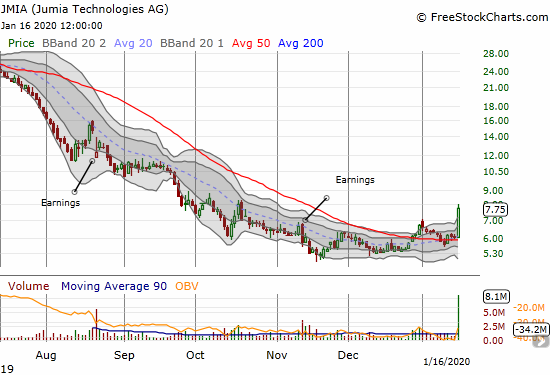
Jumia Technologies (JMIA)
Staying on the speculative side of things, it looks like my decision to double down on Jumia Technologies (JMIA) came just in time. Like JCP, I could not find specific news to explain the sudden change of heart by the market. Regardless, JMIA confirmed its 50DMA as support and finally looks ready to rally from a consolidation bottom.
— – —
FOLLOW Dr. Duru’s commentary on financial markets via email, StockTwits, Twitter, and even Instagram!
“Above the 40” uses the percentage of stocks trading above their respective 40-day moving averages (DMAs) to assess the technical health of the stock market and to identify extremes in market sentiment that are likely to reverse. Abbreviated as AT40, Above the 40 is an alternative label for “T2108” which was created by Worden. Learn more about T2108 on my T2108 Resource Page. AT200, or T2107, measures the percentage of stocks trading above their respective 200DMAs.
Active AT40 (T2108) periods: Day #249 over 20%, Day #88 over 30%, Day #63 over 40%, Day #30 over 50%, Day #5 under 60%, Day #1 over 70% (overbought ending 75 days under 70%)
Daily AT40 (T2108)
")
Black line: AT40 (T2108) (% measured on the right)
Red line: Overbought threshold (70%); Blue line: Oversold threshold (20%)
Weekly AT40 (T2108)

*All charts created using FreeStockCharts unless otherwise stated
The T2108 charts above are my LATEST updates independent of the date of this given AT40 post. For my latest AT40 post click here.
Be careful out there!
Full disclosure: long VIXY calls, long JMIA, long JCP
*Charting notes: FreeStockCharts stock prices are not adjusted for dividends. TradingView.com charts for currencies use Tokyo time as the start of the forex trading day. FreeStockCharts currency charts are based on Eastern U.S. time to define the trading day.