
Housing Market Intro/Summary
In the last Housing Market Review, I pointed out how the stocks of home builders were still making a surprising push against the expected seasonal top in their shares. Yet, I still expected iShares US Home Construction ETF (ITB) to remain constrained to a pivot around its 50-day moving average (DMA). Soon after that post, M.D.C. Holdings (MDC) surprised the market with exceptionally bullish pre-earnings guidance. I found reason to think the market over-reacted but decided to respect the market action with an early trade on ITB. I tentatively bought an ITB calendar call spread (Aug/Oct $39) as a way to sell into the seasonal top while preparing to buy into seasonal strength. The position is currently profitable, but the seasonal top looks more tenuous than ever with more and more home builders breaking out.
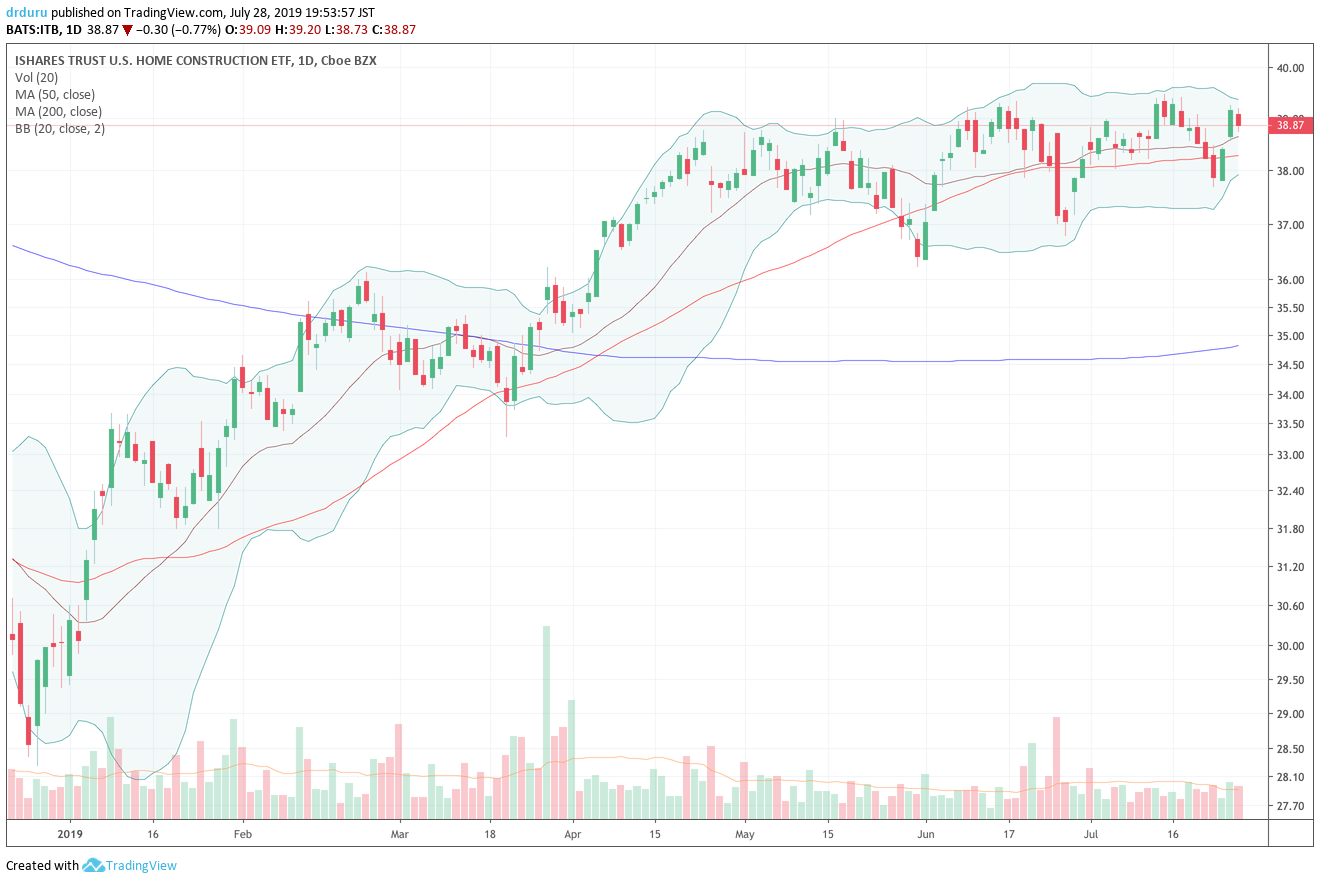
Source: TradingView.com
The lethargic movement in ITB belies some outstanding breakouts among individual home builders. A clear dichotomy has emerged between the builders tapping into the strength in lower-priced homes and strong individual markets, and the largest builders whose broad portfolios have apparently (and ironically) weighed them down.
Pulte Group (PHM) had a tough week – a week that underlined the slowing momentum for the biggest home builders. PHM broke out ahead of earnings and stalled for the next 6 trading days until the earnings report. The company disappointed and shares gapped down below 50-day moving average (DMA) support. PHM ended the day with a whopping 8.3% loss and a 3-month low. The stock has since recovered a bit thanks in part to good news from M/I Homes (MHO) and Meritage Homes (MTH).
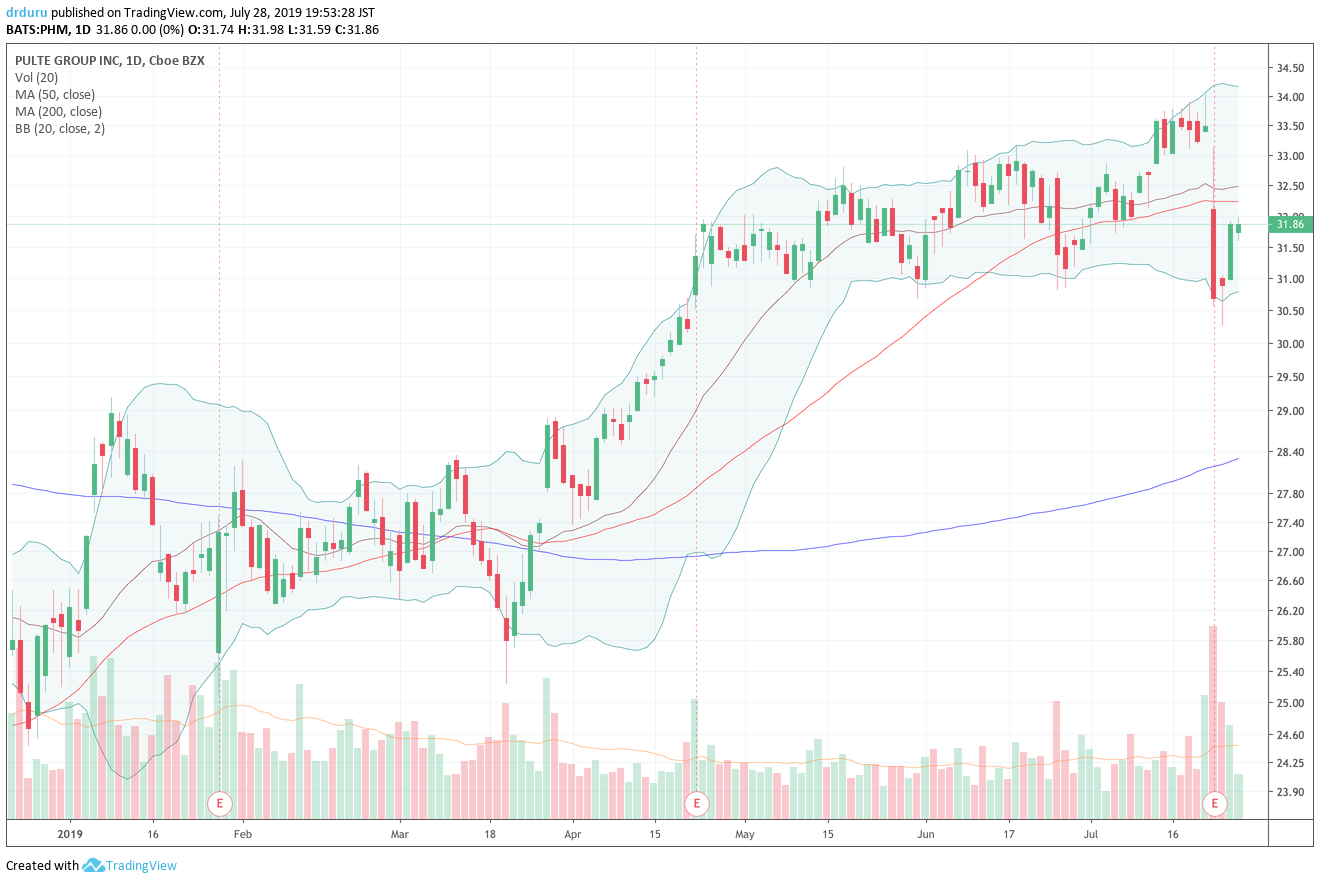
Source: TradingView.com
My award for surprise of the month goes to M/I Homes (MHO). M/I Homes is a builder I do not actively follow. Its earnings produced a one-day breakout for a 10.1% gain. Buyers have not stopped since. MHO closed the week at a 15-month high. One of my accumulating to-dos in trying to keep up with the market’s renewed excitement with home builders is to learn more about MHO. I plan to post about its earnings report in coming days.
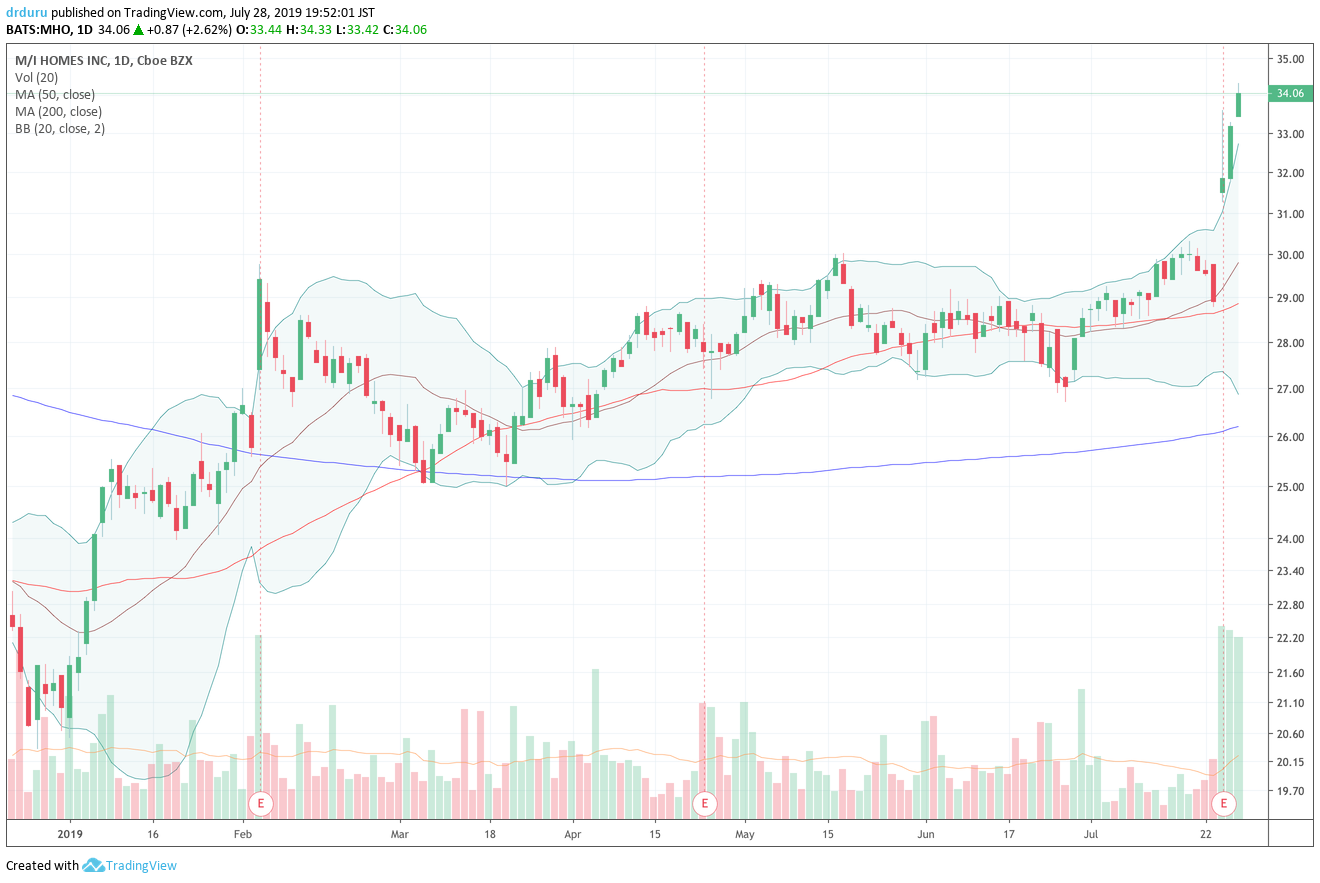
Source: TradingView.com
Meritage Homes (MTH) helped further boost the market’s mood with its own earnings delight. In direct response to earnings, the stock soared a startling 18.2%; I cannot even remember a time I saw such a one-day post-earnings pop. MTH closed the week at a 13-month high. MTH frustrates me the most as it is one of my favorite home builders but I have missed opportunities from trying to wait for the right time and/or entry point. I even identified the out-performance and renewed strength in MTH when I reviewed the news from M.D.C. Holdings.
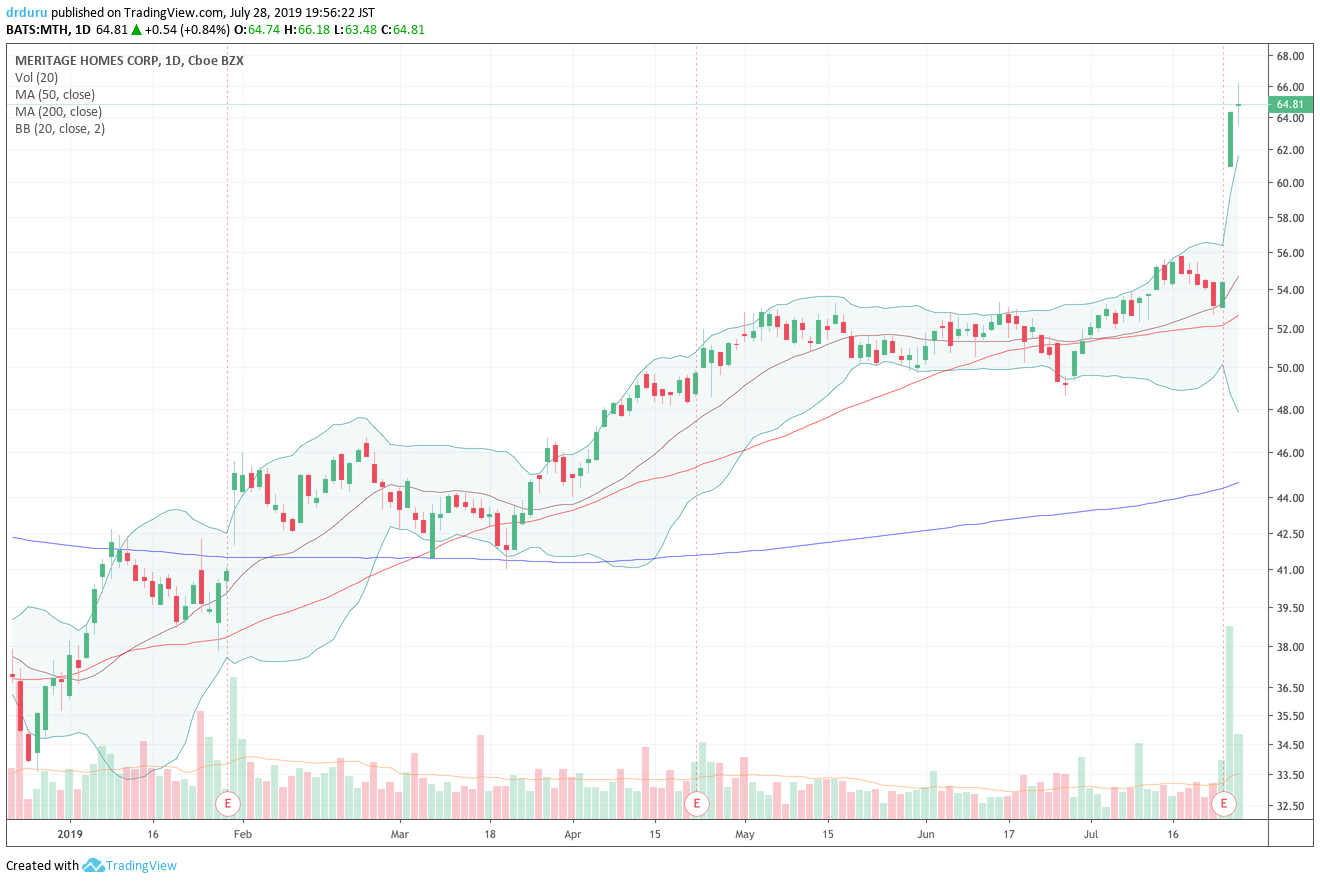
Source: TradingView.com
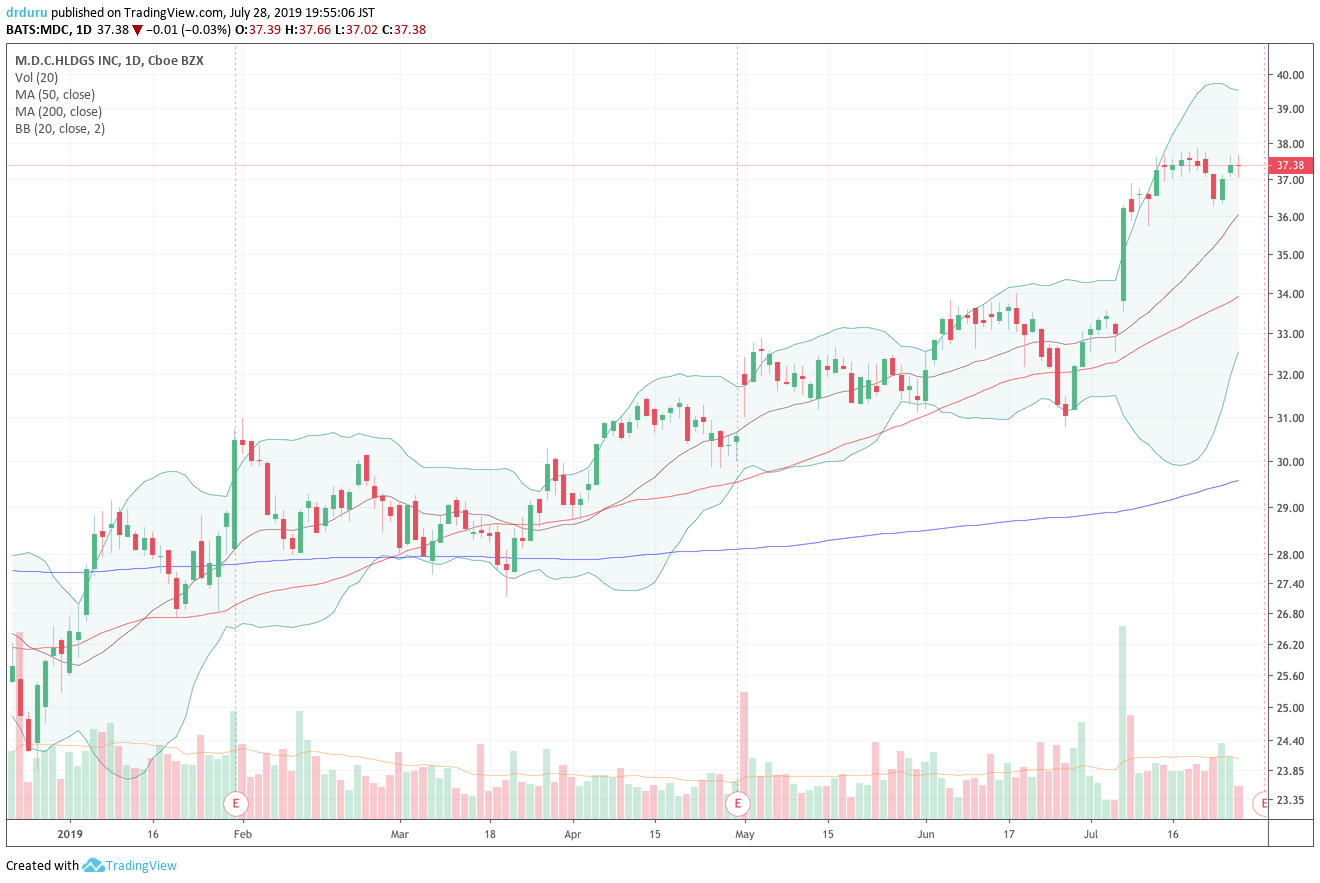
MDC is holding onto its gains from the pre-earnings surprise. I assume the subsequent drift in price represents investors quickly returning to a wait-and-see mode. MDC reports earnings on July 31 before the market opens.
Source: TradingView.com
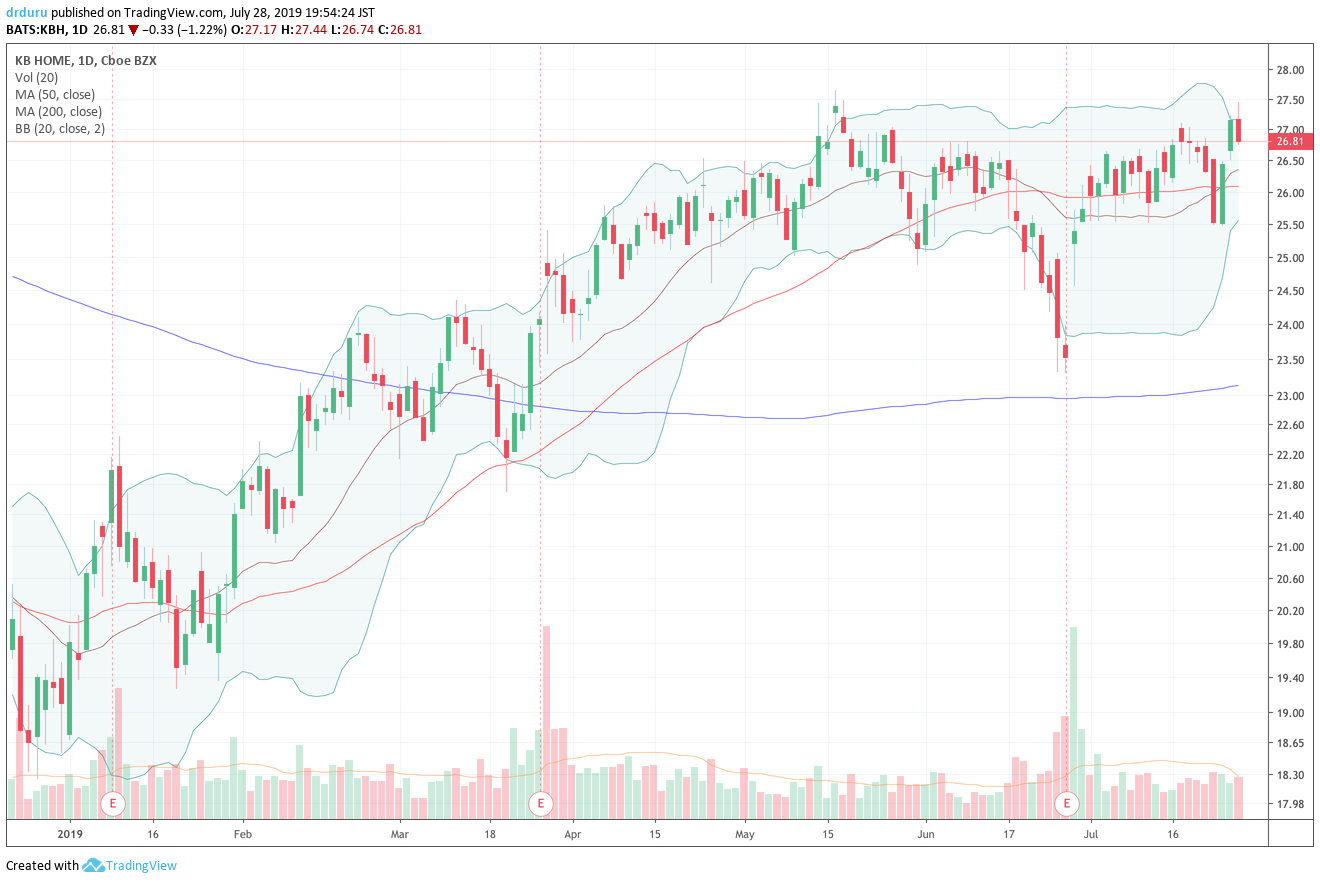
KB Home (KBH) experienced one of the worst drops among home builders after Pulte Group disappointed the market. KBH rebounded quickly after MHO turned sentiment right around. My early trade in KBH was a wash as the loss from my hedge in put options neatly offset the gains in my calendar call spread; that spread hit its early profit target ahead of the expiration of the short side of the position. I reviewed KBH’s earnings for a second time and will post on it soon. Again, I was highly surprised by management’s outright bullishness while the results and guidance did not seem to quite match the tone. Note below the hesitancy in the shares to breakout to a new 2019 high.
Source: TradingView.com
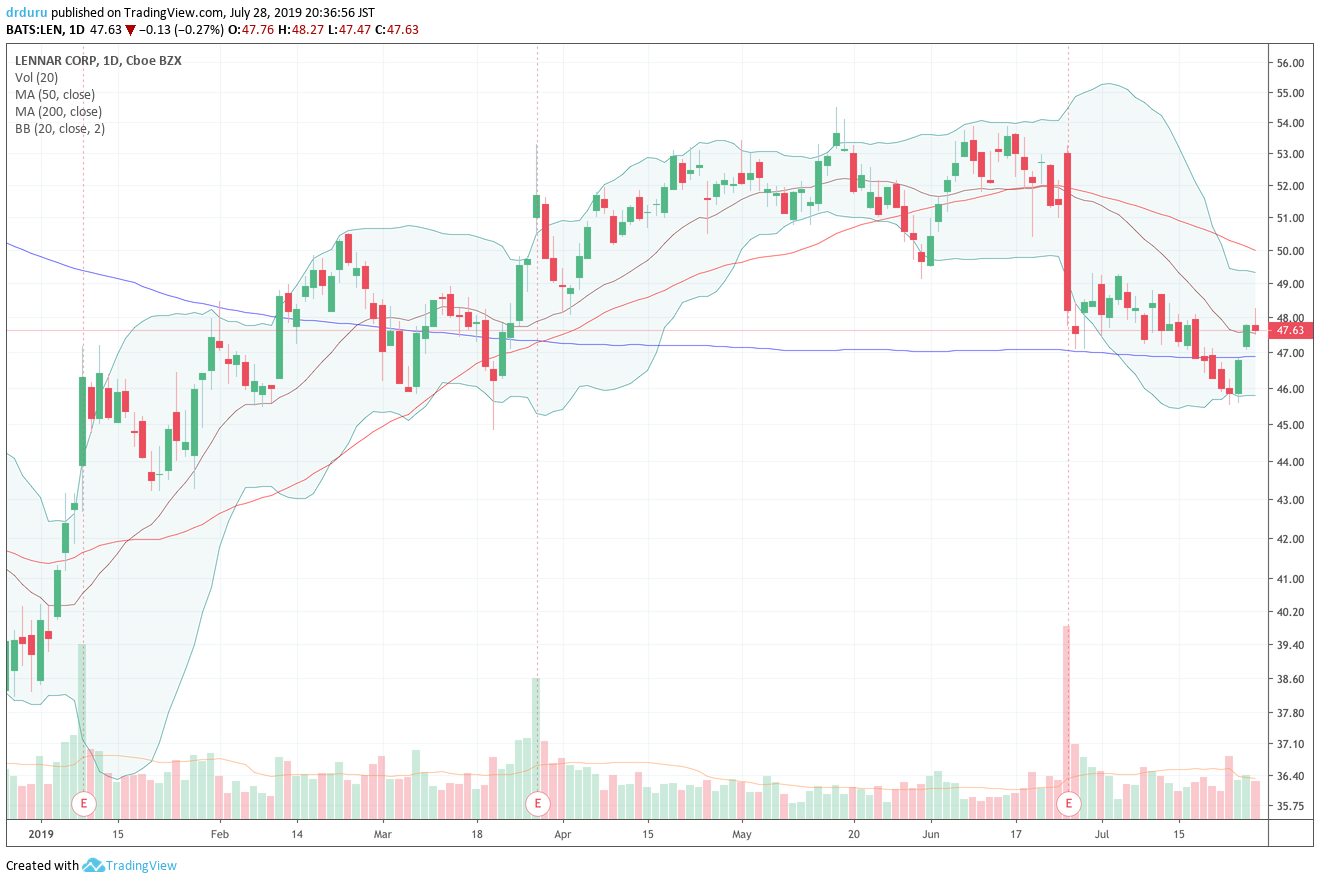
Lennar (LEN) was the stock that took ITB down ahead of the last Housing Market Review. After reviewing earnings, I identified LEN as a buying opportunity. However, after observing the disappointment in PHM, I am no longer so sure about that opportunity. I need to review PHM earnings to get a better assessment. For now, the technicals suggest LEN is a speculative buy based on its quick recovery from a 200DMA breakdown.
Source: TradingView.com
With the Federal Reserve on the cusp of reducing interest rates, home builders sit at an important economic juncture. The bond market has forced the Fed to lower rates by dropping long-term yields into an inverted yield curve. Mortgage rates have dropped in kind. At this point, I highly doubt long-term yields, and by extension mortgage rates, will drop much lower than current levels. In fact, if the market regains its confidence in future growth prospects, long-term yields could increase and drive mortgage rates up. In other words, there is significant risk to the narrative of lower rates driving up housing demand. I still contend that a lot of the current demand is pull-forward by buyers eager to make purchases before rates go up again.
So overall my expectations for the second half of the year remain low. The housing data has done nothing to dissuade me. My interest in the stocks of home builders at this juncture is mainly seasonal and represents deference to the message of the markets.
New Residential Construction (Single-Family Housing Starts) – June, 2019
After a sudden burst of activity to start the year, housing starts have remained cool.
Single-family housing starts for May were revised downward from 820,000 to 818,000. June starts increased month-over-month by 3.5% to 847,000. However, on an annual basis, single-family housing starts decreased by 0.8%. This level of activity is a far cry from what I would expect given the recently expressed optimism of home builders. Still, 800,000 starts remains the approximate line of support for 2019.
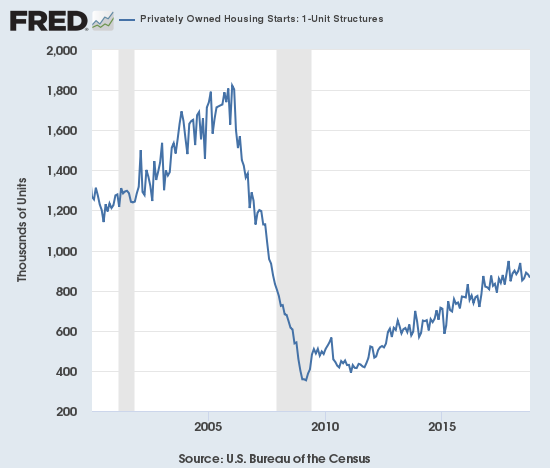
Source: US. Bureau of the Census, Privately Owned Housing Starts: 1-Unit Structures [HOUST1F], retrieved from FRED, Federal Reserve Bank of St. Louis, July 17, 2019.
The West’s on-going declines in starts took a brief break in April and resumed in May along with all other regions. For June, the regions were split with the Northeast as a big loser for the second month in a row. The Northeast, Midwest, South, and West each changed -34.3%, 8.0%, 6.5%, and -9.5% respectively. With declines continuing through the the Spring selling season, I continue to expect fresh weakness in new home sales later in the year.
Existing Home Sales – June, 2019
{Update September 2, 2019: The NAR may have changed its URL structure and/or the availability of past news released. The June report is current summarized here}. The year-over-year declines for existing home sales continued in June for the 16th straight month. March and April sales data cast doubt on the case the National Association for Realtors (NAR) made for a bottoming in sales. While that bottom is holding up, the larger looming downtrend is still the more salient feature of the market.
The seasonally adjusted annualized sales in June of 5.27M were down 1.7% month-over-month from the marginally upwardly revised 5.36M in sales for May. Year-over-year sales decreased 2.2%. Recall that January’s 4.93M in sales were the lowest since November, 2015.

(As of the March, 2018 data, the NAR further reduced historical data to just 13 months. For historical data from 1999 to 2014, click here. For historical data from 2014 to 2018, click here) Source for chart: National Association of Realtors, Existing Home Sales© [EXHOSLUSM495S], retrieved from FRED, Federal Reserve Bank of St. Louis, July 26, 2019.
The National Association of Realtors (NAR) celebrated May sales as delivering the numbers it “expected.” For June, the NAR admitted to a bit of astonishment (or bewilderment?) at the current market dynamics:
“Home sales are running at a pace similar to 2015 levels – even with exceptionally low mortgage rates, a record number of jobs and a record high net worth in the country…
Either a strong pent-up demand will show in the upcoming months, or there is a lack of confidence that is keeping buyers from this major expenditure. It’s too soon to know how much of a pullback is related to the reduction in the homeowner tax incentive.”
I have been arguing that the demand for existing homes is not as strong as the NAR has claimed for so long. The above admission finally opens the possibility for low demand being part of the market mix per the reference to a “lack of confidence.” This possibility is especially important in light of the on-going sequential increase in inventory which is loosening the NAR’s claim that the market needs more inventory to enable more transactions. Home builders are failing to respond to this call and instead seem to be pivoting to address affordability issues with smaller floorplans and lower-tier homes.
Absolute inventory levels of 1.93M homes stayed flat from a year ago but increased from the 1.91M homes for sale in May. Based on months of supply, inventory changes pointed ever so slightly higher again: “Unsold inventory is at a 4.4-month supply at the current sales pace, up from the 4.3 month supply recorded in both May and in June 2018.” Recall from the March Housing Market Review that the inventory situation widely varied based on price ranges. In March, the most expensive homes, $1M and up, had 10 months of supply while homes in the two lowest tiers only had 3 to 4 months of supply. The NAR has yet to release an update on those data. The (relative) scramble for lower-priced homes is a negative sign for the market for existing homes as it confirms the well-known affordability issues in the market. A downshift in price tiers is one of the last options available to households who are trying hard to become home owners.
The median price of an existing home just keeps creeping higher even as the median price of a new home declines. In March, price growth increased to a year-over-year gain of 3.8%, which included the largest nominal increase for a March in history. May delivered the 87th straight annual increase and June the 88th: 4.3% to an all-time high of $285,700. At this point, the evidence clearly does not support the NAR’s claims that rising inventories help affordability. Indeed, the NAR failed to repeat this claim in the June report.
March’s 33% share of first-time buyers was a notable jump over the 30% the year prior. June’s 35% share of first-timers was another impressive gain moving up from the 32% in May and the 31% a year ago. The average share for first-time homebuyers for 2016 was 35%. The NAR’s 2017 Profile of Home Buyers and Sellers reported an average of 34% for 2017 and 33% for 2018.
Investors purchased 10% of homes in June, down notably from May’s 13% and April’s 16%. Investors purchased 13% of homes a year ago. I am again surprised by these declines given lower interest rates facilitate more speculation and investment activity. Investor sales averaged a share of 15% in 2017 and 14% in 2016. The NAR has yet to release the average for 2018.
February just barely ended a 4-month streak of annual sales declines across all four regions. The broad-based declines resumed in March and continued in April. In May, only the South managed a year-over-year increase. In June, all regions declined again. The West suffered its twelfth consecutive month with a year-over-year decline. Here are the regional changes: Northeast -4.2%, Midwest -1.6%, South -0.4%, West -5.2%.
As usual, regional sale fluctuations had little to no relationship to the on-going year-over-year price run-ups: Northeast 4.8%, Midwest 6.7%, South 4.9%, West 2.3%.
Single-family sales decreased 1.5% from May and decreased on a yearly basis by 1.7%. The median price of $288,900 was up a healthy 4.5% year-over-year (May featured a 4.6% annual increase).
California Existing Home Sales – June, 2019
The California Association of Realtors (CAR) reported sales of existing Californian homes at a 10-year low in January. February’s month-over-month surge of 11.8% was enough for a 6-month high; the gain was also the largest monthly gain since January, 2011. June sales reflected the poor results from the national numbers: a 4.2% drop from May and a 5.1% year-over-year decline to 389,690.
The sales declines were stark all over the state. CAR reported a (non-seasonally adjusted) decline across all regions. The worst was surprisingly the Central Valley at 9.4%. The Central Valley is the source of cheaper homes for those escaping the expensive San Francisco Bay Area. The SF Bay Area was not far behind in second place with an 8.8% decline.
February’s median price was the lowest in 12 months. Poor sales numbers did not prevent June’s median price from hitting a new record. At $611,420, the median price of an existing Californian home increased 1.4% year-over-year although just a few hundred dollars over May’s median of $611,190. CAR welcomed price softness in March, lamented the high prices in April, and kept up assurances in the face of May’s new record high median price. For June, CAR took comfort in the drop in mortgage rates which have managed to make Californian homes a little more affordable: “With softer price growth and interest rates at the lowest levels in nearly three years, monthly mortgage payments on a median-priced home have fallen for four straight months.”
This 4-month decline in monthly mortgage payments motivated CAR to boost its sales AND price forecast for 2019: “With low rates supporting sales and elevating home prices in the last few months, the market outlook has shown some improvement since the first quarter…As such, we have revised our 2019 forecast upward for home sales to reach 385,460 and for the median price to hit $593,000, from the previous forecast of 375,100 and $568,800, respectively.” Of course, this forecast represents slight sales and price declines from the current pace, so the CAR is actually just being a little less tentative.
New Residential Sales (Single-Family) – June 2019
The stark contrast between existing home sales and new home sales cropped up again. This time, month-over-month and year-over-year new home sales increased while existing home sales went the other way. The frequent inverse movement still seems like symptoms of a market moving in fits and starts with little to no upward momentum.
The Census Bureau revised May sales of new single-family homes significantly downward from 626,000 to 604,000. This revision is important because it means May’s decline was even worse than reported while it also exaggerates the monthly gain for June. New home sales for June increased 7.0% month-over-month and increased 4.5% year-over-year to 646,000.
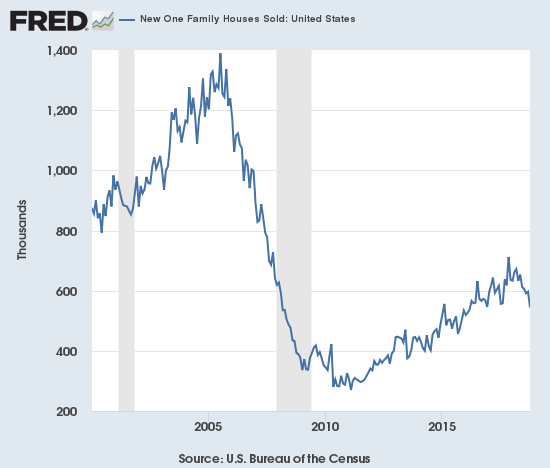
Source: US. Bureau of the Census, New One Family Houses Sold: United States [HSN1F], retrieved from FRED, Federal Reserve Bank of St. Louis, July 25, 2019.
The story from the median sales price is volatile; I strongly expect regional and economic shifts are at work. Last November, the median sales price hit a near 2-year low. By April of this year, the median price stopped just short of the last peak in March, 2018. With the Spring selling season coming to a close, the median sales price dropped close to last November’s level: $310,400 vs $308,500. Note that the revision for May to $303,500 stopped just short of the February, 2017 low of $298,000. The home builders consistently report that lower-priced homes are the ones selling well, so this recent decline in the macro data matches the earnings reports. Given lower prices are meeting higher demand, this declining price trend so far is not an alarm. Moving from March to June, a shift in share of sales to homes between $150,000 and $299,999 has definitely happened.
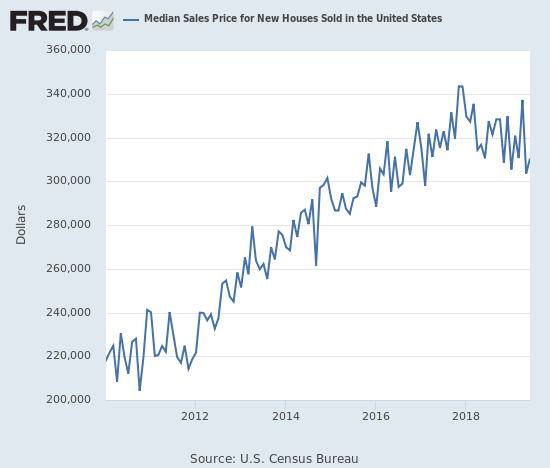
Source: U.S. Census Bureau and U.S. Department of Housing and Urban Development, Median Sales Price for New Houses Sold in the United States [MSPNHSUS], retrieved from FRED, Federal Reserve Bank of St. Louis; June 30, 2019
Ever since the inventory of new homes for sale jumped to 6.0 months of sales in June, 2018, inventory has pivoted around the 6.0 level. June’s inventory sat at 6.3 days of sales.
The Northeast suffered yet another double-digit decline in new home sales – this time a whopping 50.0% drop! The persistent declines in the Northeast are concerning although hopefully this latest drop marks some kind of bottom in the rate of decline. The Midwest fell 17.6%. The South gained 9.5%. The West jumped 19.4% and reversed May’s 17.2% drop. The big gains in the South and the West helped drive the upside surprise in results from select home builders.
Home Builder Confidence: The Housing Market Index – July, 2019
The Housing Market Index (HMI) has drifted along for most of the year. The high of this year was set in May at 66, 2 points within the October 2018 high of 68. The HMI gained 1 point to hit 66 in June. In the May Housing Market Review, I concluded that given HMI stalled at 68 after the 2018 Spring selling season, I did not expect any further gains for 2019. The current drift seems to validate that HMI has peaked for the year. Moreover, the housing data still do not offer reason to believe confidence will gain fresh upward momentum. The National Association of Home Builders (NAHB) presented a mix of bad and good news. The NAHB expressed more concerns about affordability (with echoes of the NAR) but offered “large metro suburban” areas as a location of potential strength…
“Even as builders try to rein in costs, home prices continue to outpace incomes. The current low mortgage interest rate environment should be getting more buyers off the sidelines, but they remain hesitant due to affordability concerns. Still, attractive rates should help spur new home purchases in large metro suburban markets, where approximately one-third of new construction takes place…”
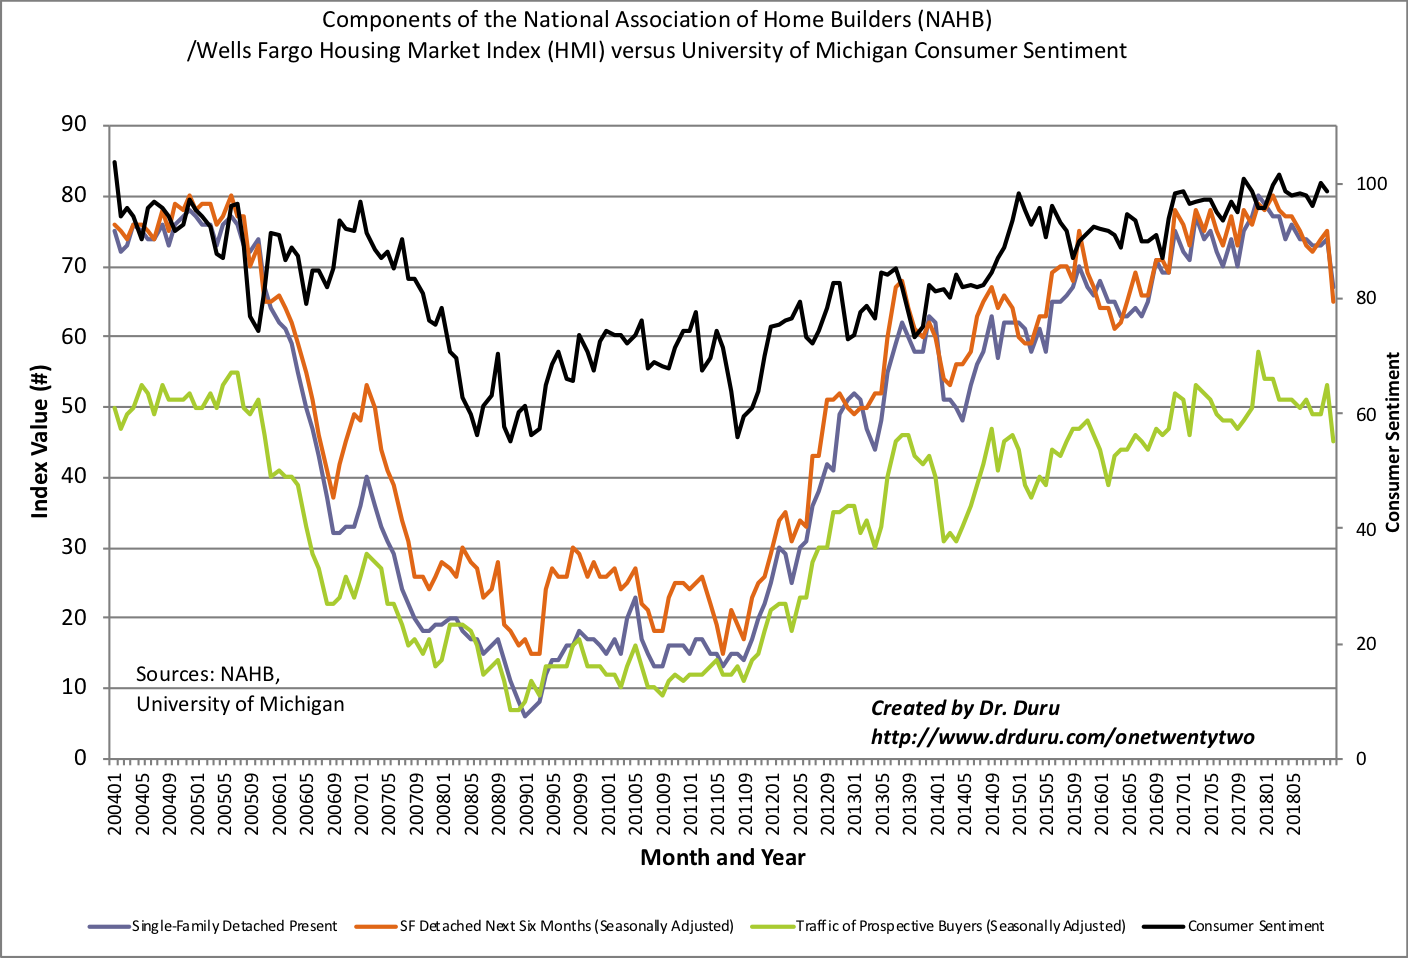
Source: NAHB
The mix of regional results matched the regional changes in new home sales with the West doing all the heavy lifting. The Midwest and the Northwest declined for the second month in a row. The South gained one point to a new 10-month high. The West surged 6 points to 75, a 13-month high. So the large boost in confidence in the West essentially drove the aggregate HMI upward for June. The large boost in confidence in the West is consistent with new home sales in the region but stands in stark contrast to the declines in existing home sales there..
Parting thoughts
The housing news that caught my eye this month had to do with changes in residential zoning laws across American cities. In many cities, 70% to 85% of land is dedicated to zoning for single-family homes. Minneapolis recently eliminated all single-family residential zoning and caught the interest of many cities. The entire state of Oregon proceeded to ban single-family residential zoning. The supply of affordable homes may open up with more sweeping changes to zoning laws. Home builders become a lot more attractive if this kind of deregulation gains in popularity.
Be careful out there!
Full disclosure: long ITB calendar call spread
The disparity in success between the two market strategies (high-end vs. low-end) seems to cry out for a pairs trade…
A pairs trade makes a lot of sense right now. Especially in doing the long side after a dip or in one of the few smaller builders left that haven’t popped. I forgot to mention that I bought a PHM calendar put as a hedge for the ITB calendar call. So I actually do have the makings of a pairs trade already although I thought of it as a small hedge.