
The threat of Chinese resistance to sky high iron prices was just enough to put a halt to a parabolic run-up in prices. After a sharp drop, iron ore prices quickly rebounded and have remained relatively flat for about two weeks. The stocks of related iron-ore companies turned around after an initial sharp sell-off. Last week, the sector received a 1-2 punch that has yet to impact significantly the price of iron ore (the benchmark spot 62% iron ore for delivery to China) but was strong enough to take iron ore stocks back down. As a result, iron ore related plays, including the Australian dollar, look like they have topped out for some time to come.
The Impact of Increased Iron Ore Production
On July 24th, Vale (VALE) received approval to restart some processing at its Vargem Grande complex. Brazilian regulators ordered the complex shut down in February to facilitate safety work at its dams. The promise of more supply managed to take down prices that day by just a fraction of a percent (the most actively traded iron ore contract on the Dalian exchange experienced a bigger loss but bounced back from its intraday low).
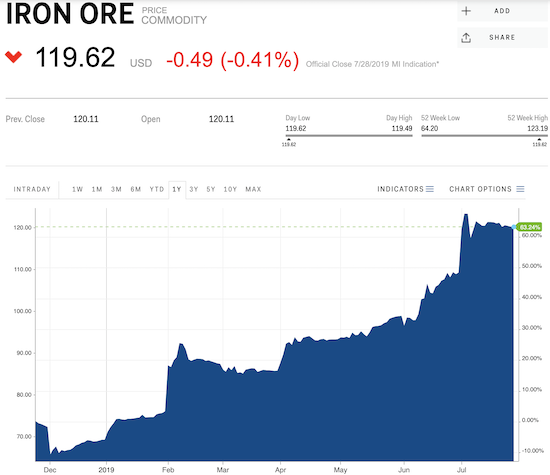
Source: Business Insider
The Analyst Downgrades
Later that same day, Liberum, an investment banking firm headquartered in Lodon, issued a major downgrade for the iron ore sector. According to Marketwatch, Liberum downgraded Rio Tinto (RIO), BHP Biliton (BHP), and Anglo American “…from buy to hold, citing rising inventories of steel, stalled iron ore port deliveries, declining Chinese steel mill profits and accelerated scrap steel supply.” Credit Suisse applied additional pressure to RIO by downgrading the shares from neutral to underperform: “We now focus on our expectation that iron ore pricing is approaching a turning point with momentum in China port inventory drawdowns slowing and supply continuing to recover.”
Accordingly, RIO took the biggest hit. The stock fell 4.1% and closed at the bottom of its trading range. The stock dropped a little further the next day.
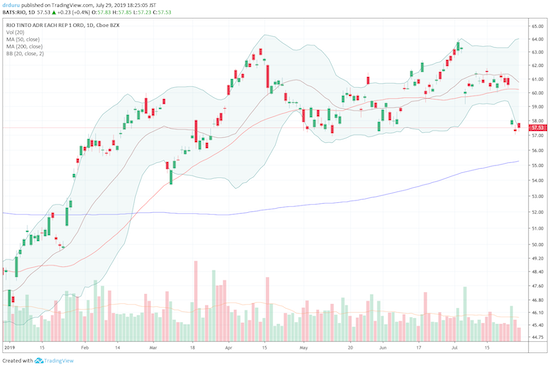
Source: TradingView.com
BHP Group (BHP) fell 3.5% and closed around the same price it hit when Chinese steel mills threatened to get the government to take action against iron ore prices. The stock subsequently drifted a little lower.
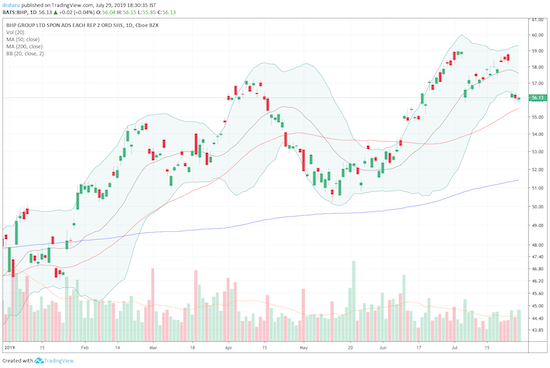
Source: TradingView.com
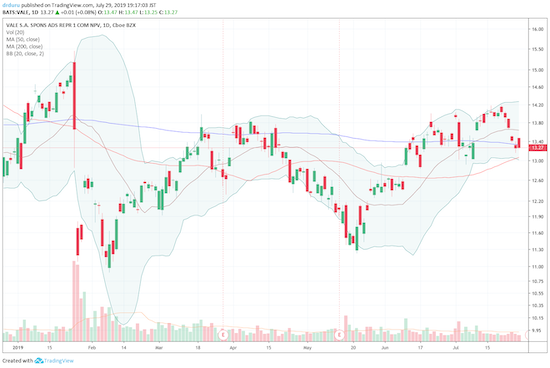
Vale (VALE) is in a corner on its own given the on-going recovery from its mine disasters. VALE dropped 2.0% on July 24th even though the additional production should help its financials.
The Pairs Trade
After the Chinese-related sell-off, I decided to hold onto my RIO puts in anticipation of some follow-through selling. I held August expiration, so I had time to be a little patient. Once RIO immediately began drifting higher, I watched the profits on the puts nearly evaporate. I was absolutely stunned to see BHP completely close its gap and started to wonder whether the positive side of my pairs trade, the BHP call options, could deliver enough to at least bring the entire position to flat. When RIO dropped to the near 2-month low, I quickly took profits on the puts and locked in profits for the entire pairs trade. I am still holding the BHP call options. I will wait to re-establish a pairs trade until either RIO rallies again or it suffers a 200DMA breakdown.
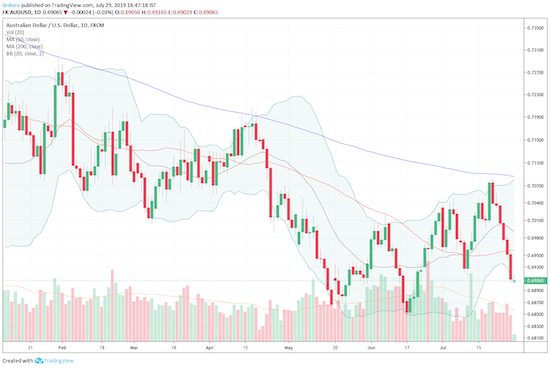
The Australian Dollar
The Australian dollar (FXA) suffered extra weakness after the July 24th takedown. A sell-off in AUD/USD was already underway while AUD/JPY began a fresh pullback on July 24th. With iron ore prices potentially softening over an extended time period, using the Australian dollar as a bet against anticipated weakness in the U.S. dollar suddenly looks sub-optimal. In particular, AUD/USD looks like it has topped out again at declining 200DMA resistance. I am waiting until after the Federal Reserve’s decision on monetary policy on July 31st to make a decision on my next move.
Be careful out there!
Full disclosure: long AUD/JPY, long AUD/USD, long BHP calls