
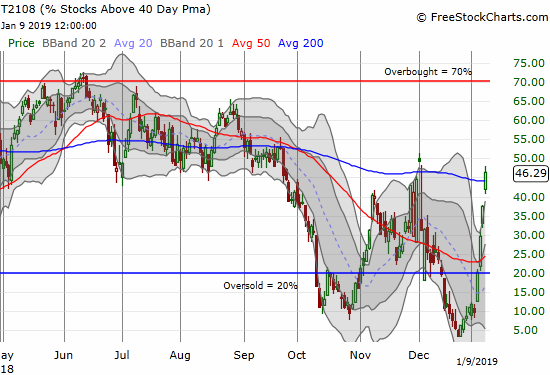
AT40 = 46.3% of stocks are trading above their respective 40-day moving averages (DMAs) (1-month high)
AT200 = 20.7% of stocks are trading above their respective 200DMAs (3-week high)
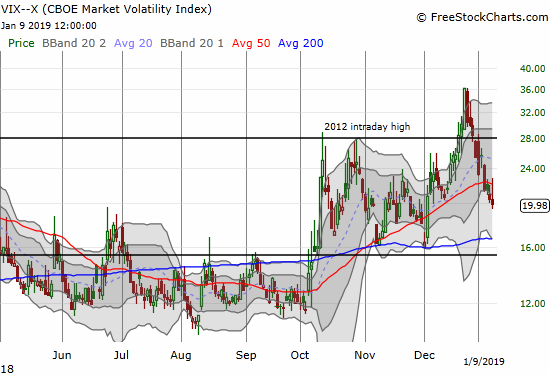
VIX = 20.0
Short-term Trading Call: cautiously bullish
Commentary
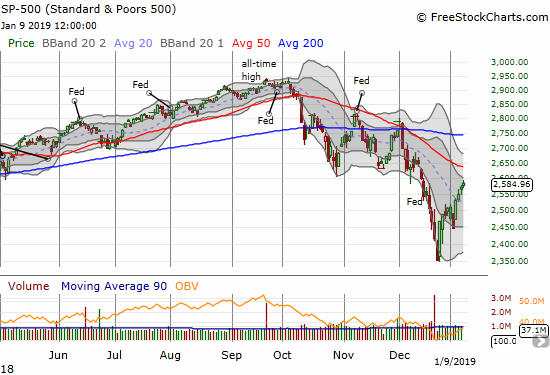
Just as the last oversold period exceeded expectations to an extreme downside, the rebound out of the oversold period is exceeding my expectations. AT40 (T2108), the percentage of stocks trading above their respective 40-day moving averages (DMAs), is suddenly right back where it was a month ago just as the S&P 500 (SPY) peaked before its historic December sell-off. With the index up 9.9% off its Christmas Eve low, just over two weeks ago, buyers face a major test of the current upward momentum.
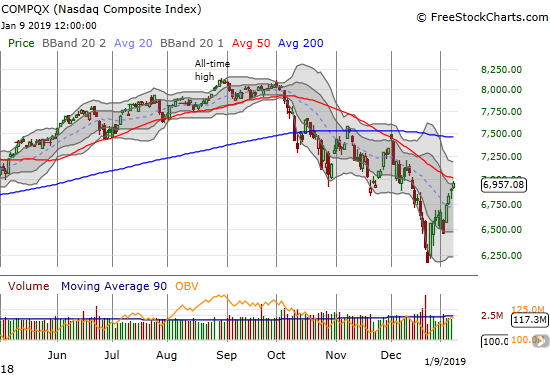
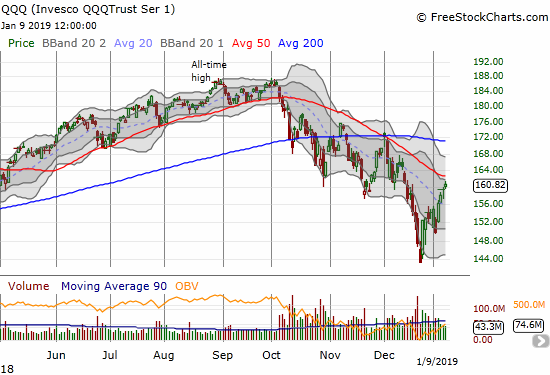
The test is even more urgent for the tech-laden indices. The NASDAQ and the Invesco QQQ Trust (QQQ) are both within sight of critical downtrending 50DMA resistance…resistance that has held firm since the NASDAQ led the major indices with a 50DMA breakdown.
The buying has been strong enough to rocket AT40 (T2108) out of the last oversold period with barely a rest. This kind of relentless rise is extreme, and I expect this momentum to end soon if not outright reverse into some kind of pullback.
Ever the since the volatility index closed below the 2012 intraday high, I argued that the latest period of elevated volatility would soon come to an end. The VIX closed right at the 20 threshold that marks “elevated” levels. I am now considering when to go long volatility as a hedge against a reversal of the oversold bounce. If the VIX drops to or toward the 15.35 pivot, I will definitely go long volatility.
I have taken profits on almost all my positions that I opened during the oversold period. Most of my current short-term longs and quicktrip trades (like AAPL calls) are the result of pouncing on intraday dips in this post oversold period. I am also even more focused on going long with calendar call options to provide longer runway I think I need with the run-up so stretched and to reduce the cost of taking positions. Accordingly, I downshifted my short-term trading call from bullish to cautiously bullish.
Almost none of my remaining hedges are likely to provide residual value, but I have continued to add to my Caterpillar (CAT) put options. With the indices looking so stretched, especially the tech-laden ones, I am on selling alert. In particular, there were a group of stocks I fortuitously bought coming off the Christmas Eve bottom. Most of them have gains equal to what I was expecting to make for the entire year. I expected a long slog that might even include the opportunity to double down on some of the positions. So now instead of thinking I would cling to the stocks for a year, I am now planning to take profits across the board. This week is a good week to act as the rapid rise in stocks just ahead of earnings represents a LOT of renewed optimism.
CHART REVIEWS
While the indices look stretched and are threatening key resistance levels, plenty of individual stocks have already broken out above critical resistance and even confirmed the breakouts. I list a few of them here. In the case of a fresh market pullback, stocks that managed breakouts are top candidates for buys on dips, earnings news notwithstanding.
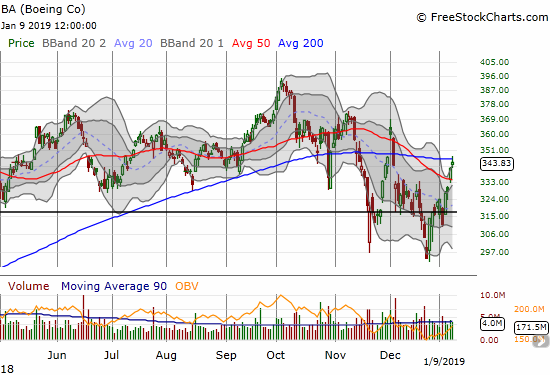
Boeing (BA)
BA broke out above its 50DMA yesterday, but the stock faces a tough test at 200DMA resistance. The company recently provided an update on fourth quarter deliveries that was generally reassuring. I am peeling back my skepticism on the stock.
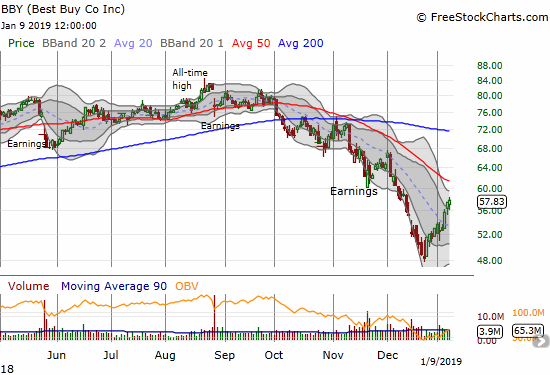
Best Buy (BBY)
BBY was my last hedged position, and the stock quickly removed itself from the list of good hedges. The stock looks ready to challenge overhead resistance from its steeply declining 50DMA.
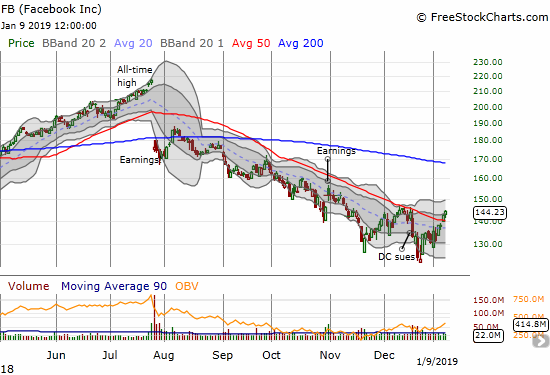
Facebook (FB)
FB is fighting through intensely negative sentiment. I did not think it could break out above its 50DMA, but here it is…
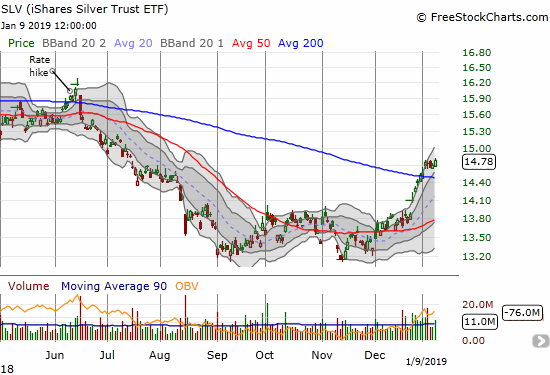
The iShares Silver Trust ETF (SLV)
I was so focused on trading gold that I completely neglected SLV. SLV has steadily rallied with the stock market and broke out above its 200DMA last week. Given the current positive correlation with the stock market, I am not considering a short-term SLV trade here.
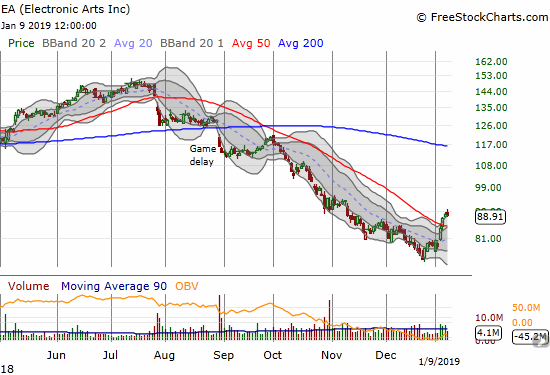
Electronic Arts (EA)
My saga in EA continues. I decided to get stock put to me upon the expiration of my short put. I sold a call short against the position last Friday. EA now looks like a good play off the bottom after breaking out above its 50DMA and trading through its upper Bollinger Band (BB) channel for the first time in three months.
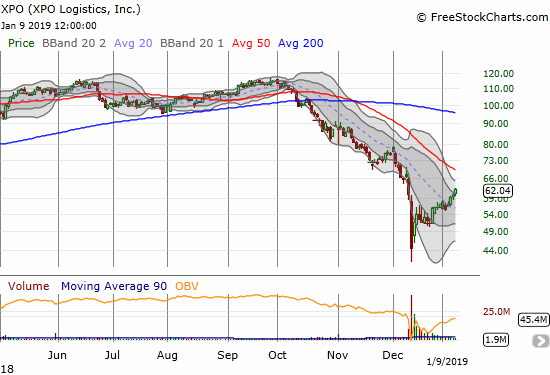
XPO Logistics (XPO)
I was crystal clear on the buying opportunity in XPO after it plunged well below its lower-BB in mid-December. My call options finally sold today. I am still holding shares on their second round of calls sold short against them.
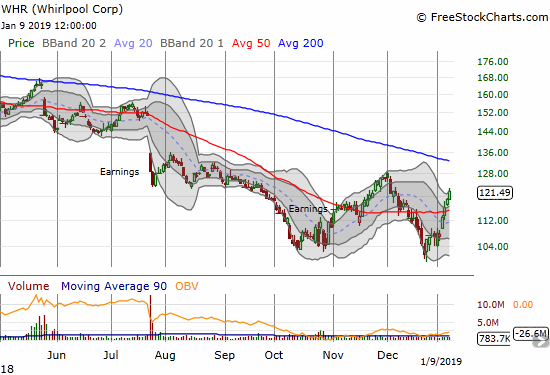
Whirlpool (WHR)
I am surprised WHR broke out above its 50DMA so soon off its recent lows. The stock may even be creating a double-bottom.
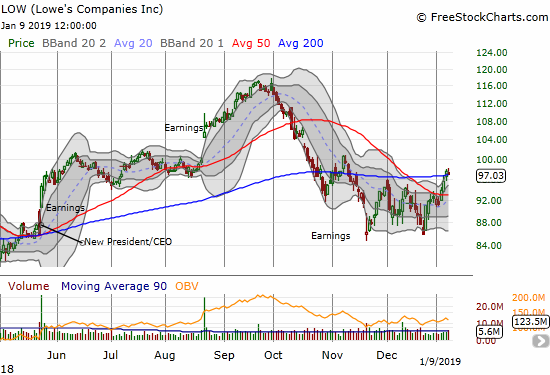
Lowe’s (LOW)
LOW confirmed its 50DMA breakout with a 200DMA breakout. The stock also broke out above its recent consolidation range. LOW is a buy here with an aggressive stop below the 50DMA and a definite stop below the double bottom.
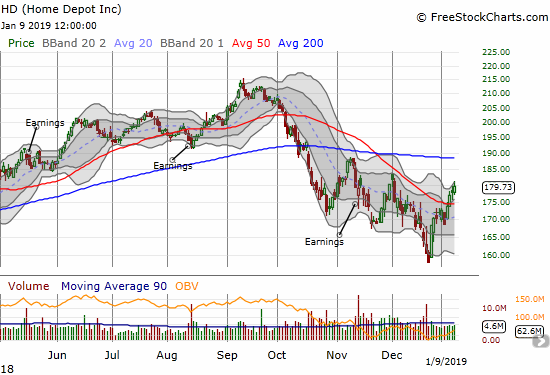
Home Depot (HD)
HD suddenly does not look as healthy as LOW. Yet, it too confirmed a 50DMA breakout.
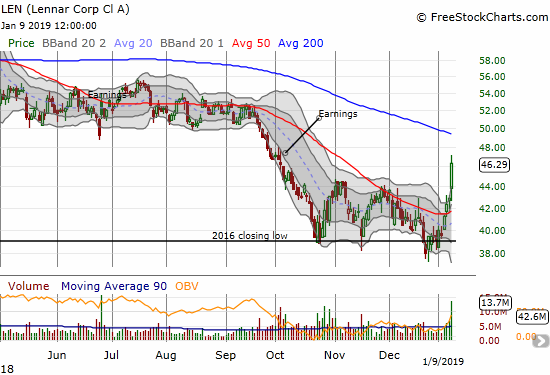
Lennar (LEN)
LEN delivered important post-earnings follow-through. The stock gained 7.9% and closed well above its upper-BB. It was a tricky day for the home builder earnings trade I discussed the previous day. It turned out that I could have simply purchased LEN as it originally pulled back from the open, but I was focused on an entry for KB Home (KBH). One minute I thought the opportunity was closed when KBH went negative on the day, and it seemed the next minute the stock was up 3%+. I decided to push ahead with buying speculative call options and bought two tranches as the stock retreated a bit from my first purchase point.
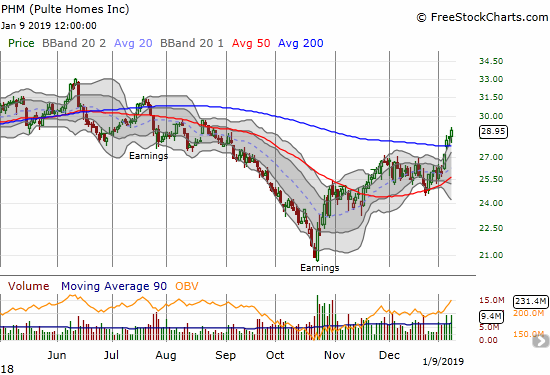
Pulte Homes (PHM)
PHM confirmed its 200DMA breakout the previous trading day. This breakout faces weak overhead resistance and makes PHM one of the strongest home builder stocks in the market. Even its 50DMA is now turning upward for the first time since last summer.
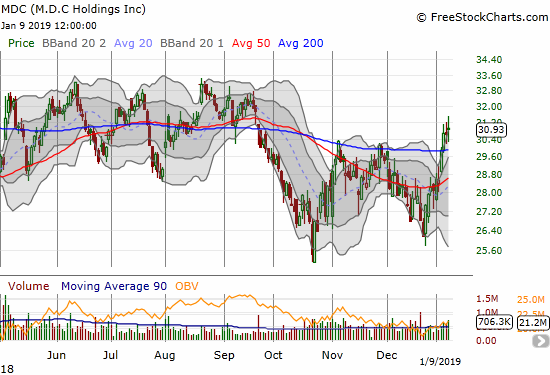
M.D.C. Holdings (MDC)
Home builder MDC confirmed its own 200DMA breakout but faces major overhead resistance directly overhead. Its 50DMA is turning upward and raises the prospects for a sustained bottom.
— – —
FOLLOW Dr. Duru’s commentary on financial markets via email, StockTwits, Twitter, and even Instagram!
“Above the 40” uses the percentage of stocks trading above their respective 40-day moving averages (DMAs) to assess the technical health of the stock market and to identify extremes in market sentiment that are likely to reverse. Abbreviated as AT40, Above the 40 is an alternative label for “T2108” which was created by Worden. Learn more about T2108 on my T2108 Resource Page. AT200, or T2107, measures the percentage of stocks trading above their respective 200DMAs.
Active AT40 (T2108) periods: Day #4 over 20%, Day #2 over 30%, Day #1 over 40% (overperiod ending 23 days under 40%), Day #74 under 50% (underperiod), Day #90 under 60%, Day #145 under 70%
Daily AT40 (T2108)
")
Black line: AT40 (T2108) (% measured on the right)
Red line: Overbought threshold (70%); Blue line: Oversold threshold (20%)
Weekly AT40 (T2108)

*All charts created using freestockcharts.com unless otherwise stated
The T2108 charts above are my LATEST updates independent of the date of this given AT40 post. For my latest AT40 post click here.
Related links:
The AT40 (T2108) Resource Page
You can follow real-time T2108 commentary on twitter using the #T2108 or #AT40 hashtags. T2108-related trades and other trades are occasionally posted on twitter using the #120trade hashtag.
Be careful out there!
Full disclosure: long SSO, long XPO shares and short call, long EA shares and short call, long KBH calls, long SLV, long FB calls, long CAT puts, net long AAPL, long PHM
*Charting notes: FreeStockCharts.com stock prices are not adjusted for dividends. TradingView.com charts for currencies use Tokyo time as the start of the forex trading day. FreeStockCharts.com currency charts are based on Eastern U.S. time to define the trading day.