
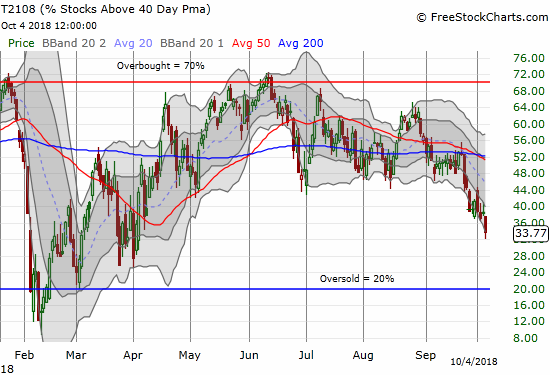
AT40 = 33.8% of stocks are trading above their respective 40-day moving averages (DMAs) (was as low 31.9%)
AT200 = 47.8% of stocks are trading above their respective 200DMAs
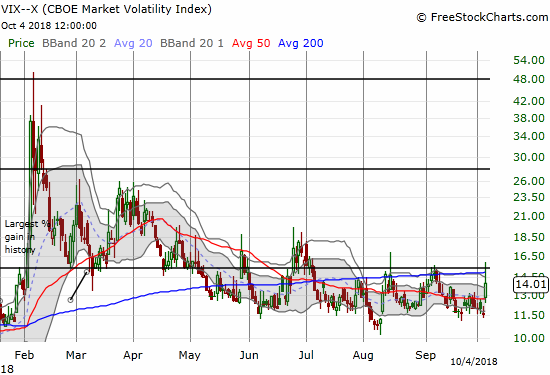
VIX = 14.0 (was as high as 15.8)
Short-term Trading Call: neutral
Commentary
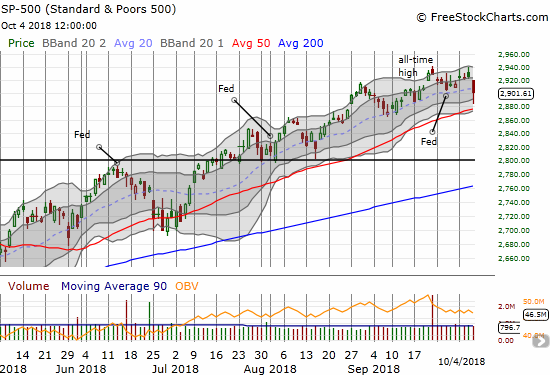
The S&P 500 is only 1.0% off its all-time high, yet extremes and critical tests of support abound.
AT40 (T2108), the percentage of stocks trading above their respective 40-day moving averages (DMAs), dropped to a fresh 6-month low and closed at 33.8%. AT40 has warned of underlying weakness in the stock market since it sliced through 40% and broke the lower bound of a multi-month range. At the time, I was more focused on the potential bullish implications of the S&P 500’s ability to hold 20DMA support at the same time AT40 slipped…
“So on a relative basis, the S&P 500 (SPY) is not likely to go much lower from here without a specific and very bearish catalyst. The S&P 500’s ability to levitate above its uptrending 20DMA adds to the impression that support will hold.”
The S&P 500 is only a mere 0.4% lower from that point BUT 20DMA support gave way. It was a rare down day on which the S&P 500 lost more than 1% at one point. Buyers stepped in at the lows and closed the index with a 0.8% loss. The S&P 500 even came close to recovering its 20DMA support.
The Invesco QQQ Trust (QQQ) DID break through 50DMA support but buyers managed to close the index right on top of it.
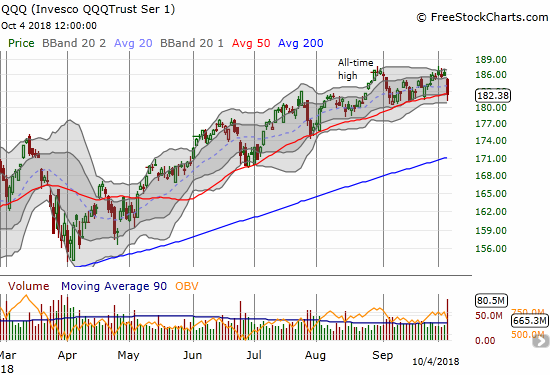
The S&P 500 managed to bounce away from 50DMA support, and the Invesco QQQ Trust (QQQ) held 50DMA support, yet the NASDAQ was not so fortunate.
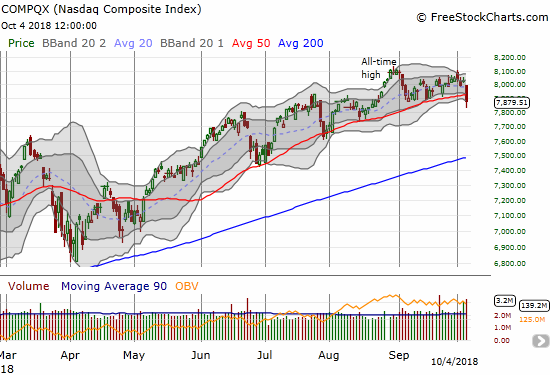
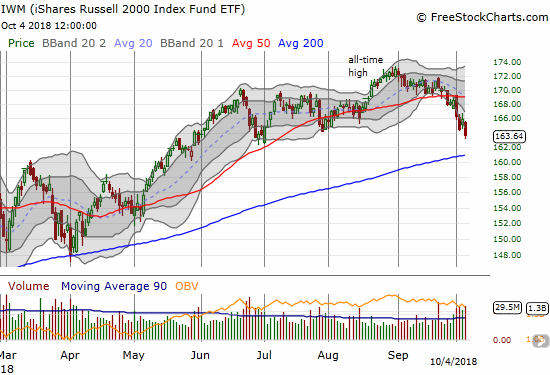
These major indices effectively created a cascade toward critical 50DMA support. Along the way, small caps continue to roll over with 50DMA resistance fading away in the rear view mirror. The iShares Russell 2000 ETF (IWM) lost another 1.4% and closed at a 3+ month low. A test of 200DMA support seems imminent.
Together, this selling looks like a recipe for a larger sell-off with small caps and now the NASDAQ leading the way lower. However, AT40 closed at 33.8% and was as low as 31.8%. For the last two years in particular, these levels have represented “close enough” to oversold with two important exceptions from the February swoon and the election related sell-off in 2016 (see longer-term chart at the bottom of this post).
The volatility index, the VIX, added to the case for an imminent bounce. The VIX soared as much as an extreme 36.4% before volatility faders stepped in to push the fear gauge to a 20.7% close underneath the 15.35 pivot. If recent patterns hold, this move suggests the latest surge in fear has already exhausted itself. In deference to the volatility faders, I quickly took profits on my latest tranche of call options on ProShares Ultra VIX Short-Term Futures (UVXY). I also did not want to make a bet on the jobs report delivering news strong enough to sustain higher volatility.
Noted VIX expert Bill Luby also thought the market hit extremes and called for a bottom. I agree with Luby that a bottom here is very likely, but I do not think it will be a sustainable bottom.
My volatility+volume indicator suggests that stocks just bottomed $SPX $VIX
— Bill Luby (@VIXandMore) October 4, 2018
$VIX call volume highest since June, with 2 1/2 hours of trading to go
— Bill Luby (@VIXandMore) October 4, 2018
Soaring interest rates have made me more circumspect. I think financial markets need to adjust to an environment where the 10-year U.S. Treasury stays above 3% and continues higher. That is, more fear needs to appear. As long as the market leaders are able to keep the S&P 500 levitating above 50DMA support, I am doubtful such fear can get exorcised.
Thursday’s spike in rates cut iShares 20+ Year Treasury Bond ETF (TLT) by 0.7% and sent it to a 4-year low. The weekly chart below shows the speed of recent losses.
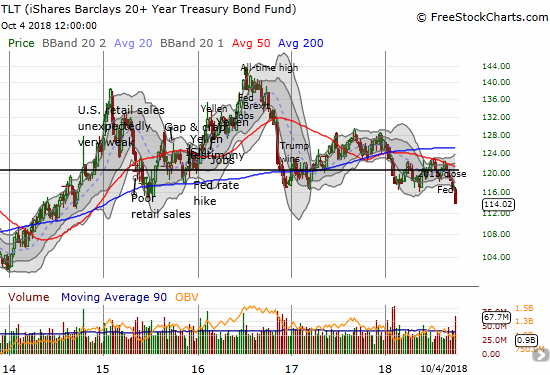
This move seemed quite extreme, so I decided to triple down on my TLT call options in anticipation of a potential snap back bounce. Friday’s jobs report should play an important role in determining whether rate fears take a break or not. Any strength pointing toward higher inflation will grease more skids across the market.
If the jobs report stays out of the way, then the technicals have the market set up for a bounce. The market just needs an excuse. Beaten down stocks are likely to benefit greatly from a bounce whereas the S&P 500 could be tightly capped by its recent all-time high. In other words, I suspect that a rally from here will be short-lived and the ultimate destination for the market is a true oversold reading (AT40 below 20%). I left the short-term trading call at neutral to reflect my expectation for a small bounce. Assuming AT40 rebounds sharply enough to at least 50%, I will likely look for fades at or near the S&P 500’s all-time high and downgrade the short-term trading call accordingly.
CHART REVIEWS
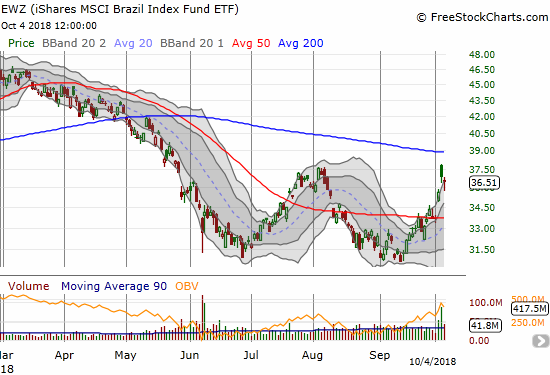
iShares MSCI Brazil Capped ETF (EWZ)
EWZ ripped higher off its test of the June and 2018 low. This move provided major relief after I thought I missed out on the opportunity to take profits on my latest EWZ trade. EWZ retested the last highs on Tuesday, but I held. I held again today and see promise in the index’s ability to rally off its intraday low. Unless today’s low breaks, I am targeting the declining 200DMA as my price target for taking profits.
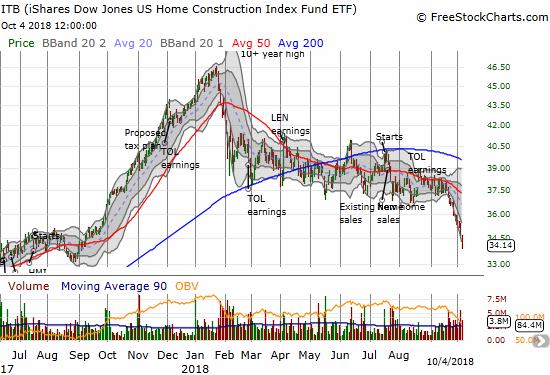
iShares US Home Construction ETF (ITB)
Home builders suffered mightily again thanks to rising rates and rising rate fears. ITB lost another 1.7% and closed at a 13-month low. The massive late 2017 breakout is now completely gone. The downward momentum in home builders suggests that 2017’s impressive gain will continue to melt away for a while to come. The stubborn bear market in home builders keeps reminding me of some of the dangers the market still loves to ignore.
— – —
FOLLOW Dr. Duru’s commentary on financial markets via email, StockTwits, Twitter, and even Instagram!
“Above the 40” uses the percentage of stocks trading above their respective 40-day moving averages (DMAs) to assess the technical health of the stock market and to identify extremes in market sentiment that are likely to reverse. Abbreviated as AT40, Above the 40 is an alternative label for “T2108” which was created by Worden. Learn more about T2108 on my T2108 Resource Page. AT200, or T2107, measures the percentage of stocks trading above their respective 200DMAs.
Active AT40 (T2108) periods: Day #158 over 20%, Day #127 over 30% (overperiod), Day #4 under 40% (underperiod), Day #9 under 50%, Day #25 under 60%, Day #78 under 70%
Daily AT40 (T2108)
")
Black line: AT40 (T2108) (% measured on the right)
Red line: Overbought threshold (70%); Blue line: Oversold threshold (20%)
Weekly AT40 (T2108)

*All charts created using freestockcharts.com unless otherwise stated
The charts above are my LATEST updates independent of the date of this given AT40 post. For my latest AT40 post click here.
Related links:
The AT40 (T2108) Resource Page
You can follow real-time T2108 commentary on twitter using the #T2108 or #AT40 hashtags. T2108-related trades and other trades are occasionally posted on twitter using the #120trade hashtag.
Be careful out there!
Full disclosure: long TLT calls, long EWZ shares, long SPY calls, long ITB calls
*Charting notes: FreeStockCharts.com stock prices are not adjusted for dividends. TradingView.com charts for currencies use Tokyo time as the start of the forex trading day. FreeStockCharts.com currency charts are based on Eastern U.S. time to define the trading day.