
AT40 = 41.2% of stocks are trading above their respective 40-day moving averages (DMAs)
AT200 = 51.6% of stocks are trading above their respective 200DMAs
VIX = 12.1
Short-term Trading Call: neutral
Commentary
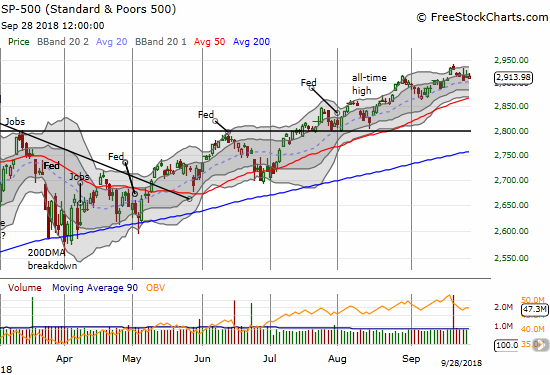
The stock market is stretched yet again based on AT40 (T2108), the percentage of stocks trading above their respective 40-day moving averages (DMAs). AT40 closed the week at 41.2% after opening at 37% on Friday and closing at 38.7% on Wednesday. AT40 was last below 40% in late March and early April when the S&P 500 was in the process of forming a double bottom from the February swoon. AT200 (T2107), the percentage of stocks trading above their respective 200DMAs, also broke down to a 3-month low. So on a relative basis, the S&P 500 (SPY) is not likely to go much lower from here without a specific and very bearish catalyst. The S&P 500’s ability to levitate above its uptrending 20DMA adds to the impression that support will hold.
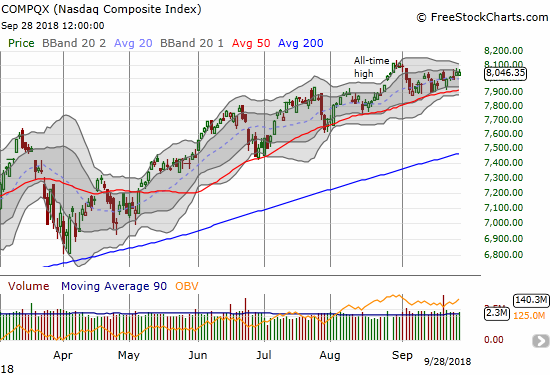
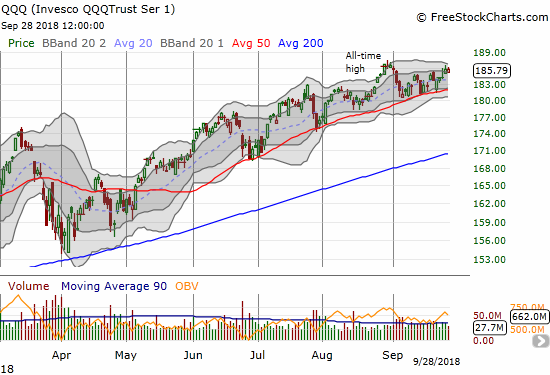
The NASDAQ and the Invesco QQQ Trust (QQQ) were last at all-time highs at the end of August. Both indices spent most of September pivoting around their uptrending 20DMAs. While the NASDAQ still looks locked into the pivoting, QQQ looks like it is breaking away.
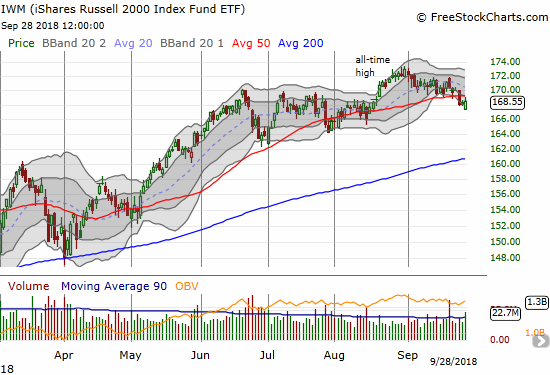
While these indices are holding up well, other major indices have created anchors weighing on AT40.
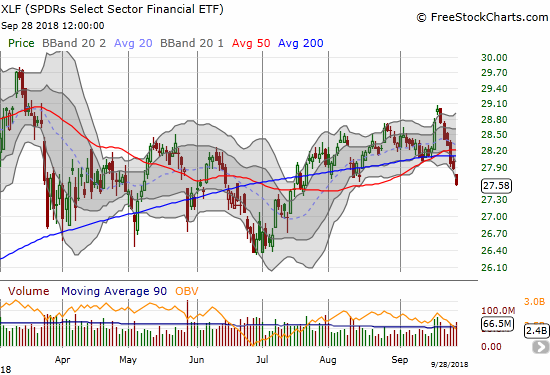
The iShares Russell 2000 ETF (IWM) sold off enough in September to break down below 50DMA support. The Financial Select Sector SPDR ETF (XLF) broke out for a brief moment in mid-September only to reverse sharply. XLF ended September at a 5-week low and 50/200DMA breakdown.
The home builders represent another sector weighing on the market. On a percentage basis they are small, but the fresh technical breakdown last week spoke volumes.
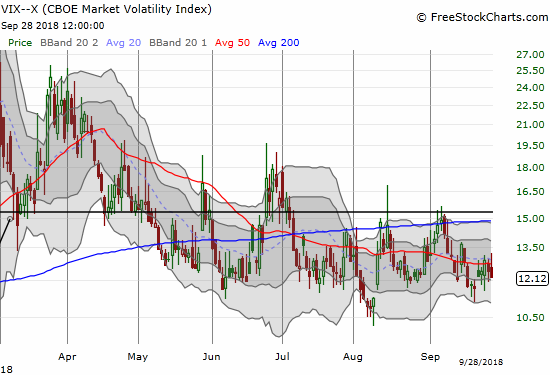
The volatility index, the VIX, muddles the technical picture. It dropped on Friday to 12.1. I typically would look for a rebound in the VIX from these levels; it is hard for me to expect a fresh rally in the stock market from here. Of course, a rally is still possible and would likely push the VIX to or into extremely low territory below 11. From there, the historical record shows the market can continue a bull run for quite some time. August’s very brief stay below 11 was a notable exception.
Earnings season is coming up as the next major catalyst for the stock market. Until then, I cannot get too excited about the market’s upside prospects, but I also cannot get bearish with AT40 as low as it is.
CHART REVIEWS
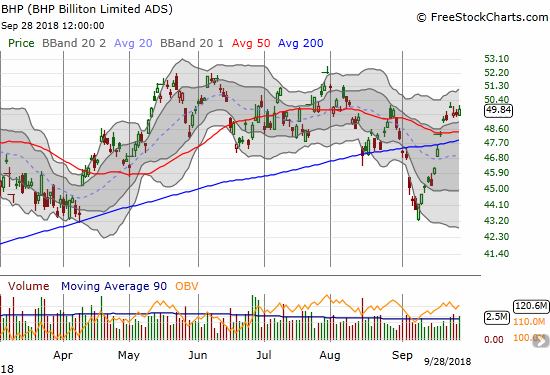
BHP Billiton (BHP)
BHP made an impressive sprint off the lows in September as part of a general rebound in commodity-related stocks and emerging markets. The move looks stalled for now. As a part of the BHP vs Rio Tinto (RIO) pairs trade, I used the rebound to buy a fresh round of RIO puts.
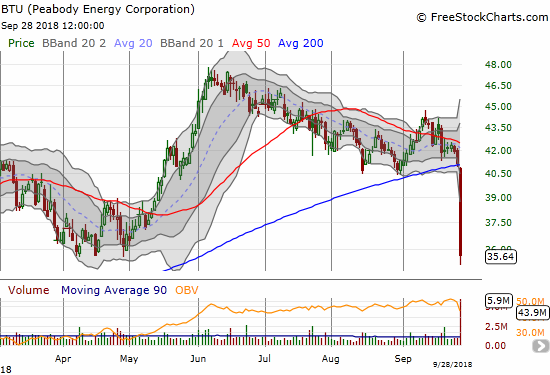
Peabody Energy Corporation (BTU)
BTU caught my attention last week by plunging after analyst downgrades. I did not even realize BTU had come back from the dead yet again! Hope certainly springs eternal in the coal sector.
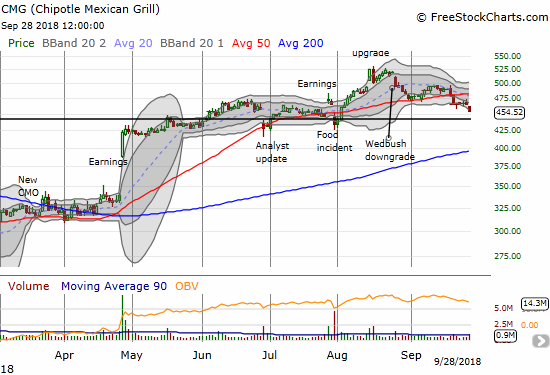
Chipotle Mexican Grill (CMG)
The upward momentum looks done for CMG. The stock confirmed a 50DMA breakdown with a near 2-month low.
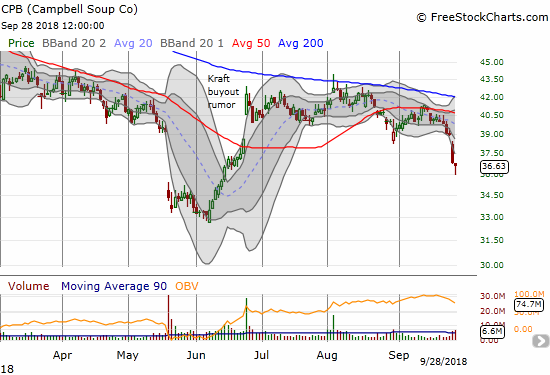
Campbell Soup Company (CPB)
Fortunes turned further downward for CPB. Last week’s selling confirmed a rejection from 50DMA resistance. Friday delivered a hammer bottoming pattern, but I am not optimistic for a confirmation.
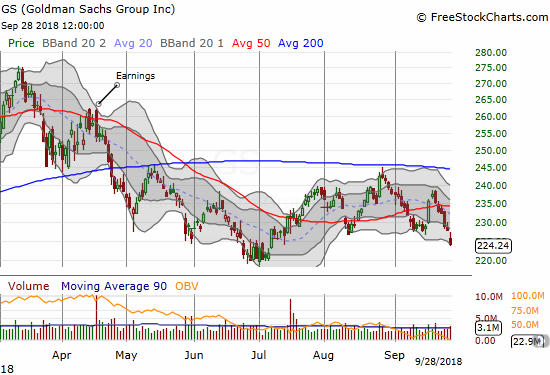
Goldman Sachs (GS)
GS led the way of weakness for the financial sector. The selling last week was strong enough to put the 2018 low, set in July, into play.
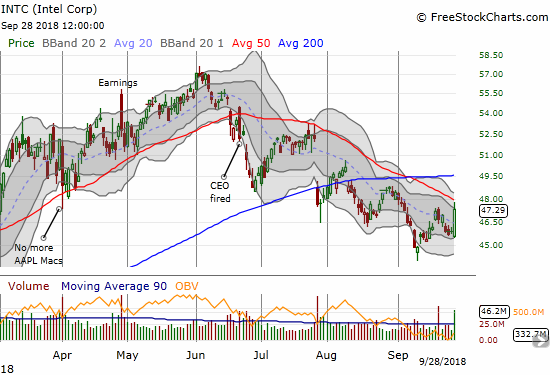
Intel (INTC)
INTC revived itself with an encouraging supply update: re-affirmation of the 2018 revenue outlook along with reported progress on 10nm yields. There is now a better than outside chance that my between earnings play on INTC will deliver profits. Overhead resistance looms large.
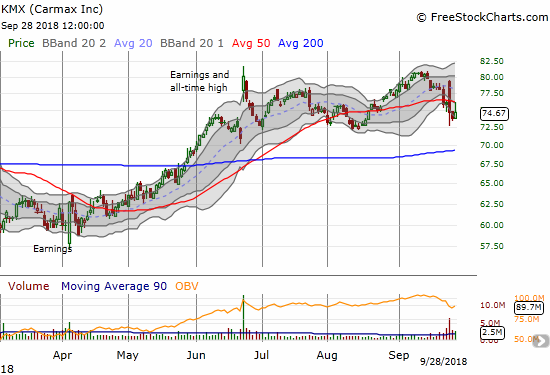
Carmax (KMX)
In mid-September, KMX broke out to a new all-time high and looked ready to follow-through. Instead, the stock sold off into earnings. After reporting earnings, KMX rebounded for a hot minute before suffering a sharp fade. The stock is now struggling below its 50DMA.
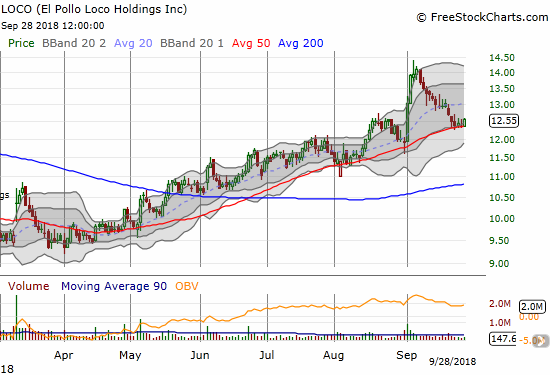
El Pollo Loco (LOCO)
The chicken trade is back on. I bought a fresh tranche of shares in LOCO as it tested and held uptrending 50DMA support last week. As in previous LOCO trades, I will accumulate more shares on weakness (the now uptrending 200DMA presents another natural buying point). Intrigue in the sector increased with Arby’s parent buying burger joint Sonic.
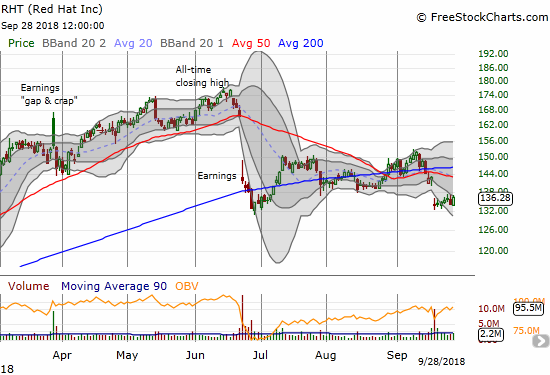
Red Hat (RHT)
RHT has yet to budge much since its last post-earnings gap down. I decided to buy shares ahead of earnings on what I thought looked like a bullish post July earnings breakout. I will have to stop out if RHT breaks the low from July earnings.
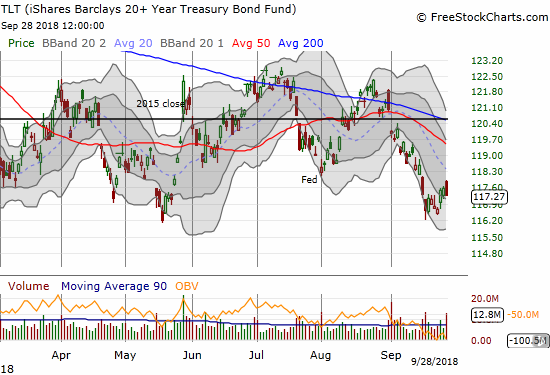
iShares 20+ Year Treasury Bond ETF (TLT)
I bought TLT calls ahead of the Federal Reserve’s announcement on monetary policy last week on a bet that the 2018 lows would hold as support. So far, so good. The Fed hiked rates yet again, but, as usual, the market is only very reluctantly accepting the implications of higher and higher rates beyond the likes of home builders.
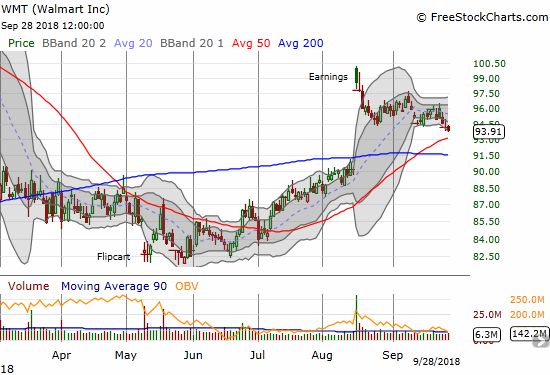
Walmart (WMT)
WMT set off fireworks with an historic post-earnings pop in August. The stock has mainly fizzled since then. I made a play for a rebound with the stock at its post-earnings low. Now it looks like WMT will soon test 50DMA support.
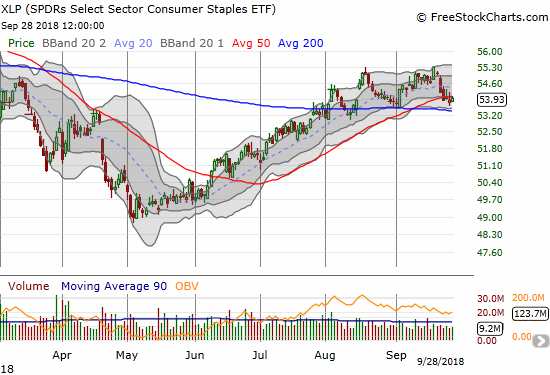
Consumer Staples Select Sector SPDR ETF (XLP)
XLP looked ready to rip higher after making a 7-month high. My recent call options were sitting pretty. All that changed in a flash last week with consumer staples falling quickly out of favor. XLP even broke 50DMA support.
— – —
FOLLOW Dr. Duru’s commentary on financial markets via email, StockTwits, Twitter, and even Instagram!
“Above the 40” uses the percentage of stocks trading above their respective 40-day moving averages (DMAs) to assess the technical health of the stock market and to identify extremes in market sentiment that are likely to reverse. Abbreviated as AT40, Above the 40 is an alternative label for “T2108” which was created by Worden. Learn more about T2108 on my T2108 Resource Page. AT200, or T2107, measures the percentage of stocks trading above their respective 200DMAs.
Active AT40 (T2108) periods: Day #154 over 20%, Day #123 over 30%, Day #1 over 40% (overperiod, the drop to high 30s ended 115 days above 40%), Day #5 under 50% (underperiod), Day #21 under 60%, Day #74 under 70%
Daily AT40 (T2108)
")
Black line: AT40 (T2108) (% measured on the right)
Red line: Overbought threshold (70%); Blue line: Oversold threshold (20%)
Weekly AT40 (T2108)

*All charts created using freestockcharts.com unless otherwise stated
The charts above are my LATEST updates independent of the date of this given AT40 post. For my latest AT40 post click here.
Related links:
The AT40 (T2108) Resource Page
You can follow real-time T2108 commentary on twitter using the #T2108 or #AT40 hashtags. T2108-related trades and other trades are occasionally posted on twitter using the #120trade hashtag.
Be careful out there!
Full disclosure: long UVXY calls, long RIO puts, long CPB call spread, long INTC calls, long LOCO shares, long RHT shares, long TLT calls, long WMT calls, long XLP calls
*Charting notes: FreeStockCharts.com stock prices are not adjusted for dividends. TradingView.com charts for currencies use Tokyo time as the start of the forex trading day. FreeStockCharts.com currency charts are based on Eastern U.S. time to define the trading day.