
The S&P 500 (SPY) printed its best quarter since the fourth quarter of 2013. While the index gained 7.2% for the third quarter of 2018, home builders went in the exact opposite direction. The iShares US Home Construction ETF (ITB) tumbled 7.4% for Q3 and is now down a whopping 20.9% year-to-date. The selling accelerated in ITB in the closing week of the quarter as ITB broke down to a new low for 2018 and then a 52-week low.
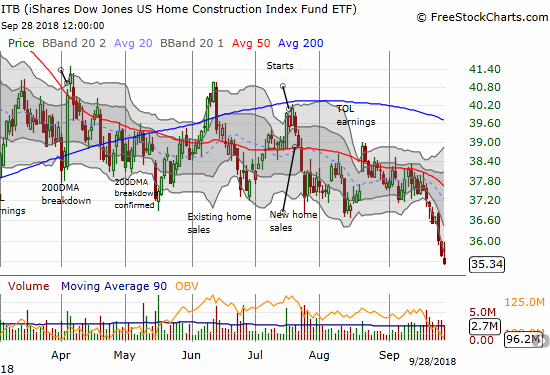
This kind of trading action is definitively bearish. The negative sentiment directed toward home builders is highlighted by the extremely low valuations of most of the stocks in the sector. A large number of these builders are now trading at book value or LESS. These kind of depths typically happen during economic downturns so the contrast with the rest of the economy is very stark. “Something” presumably has to give at some point: either home builders are screaming buys or home builders are screaming imminent recession.
Here are home builders which hit or crossed the 1.0 book value threshold (all valuations from Yahoo Finance)…
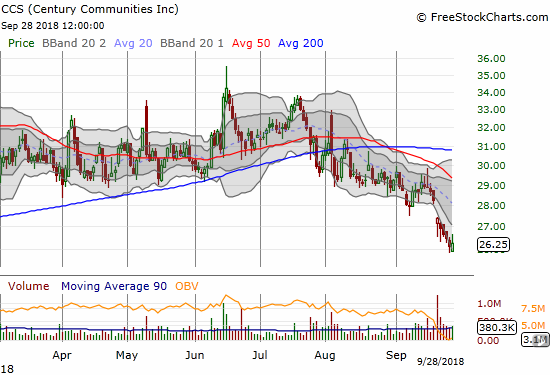
Century Communities (CCS)
Price/Book: 0.98
Trailing P/E: 9.4, Forward P/E: 5.3, Price/Sales: 0.43
I bought shares of CCS at the end of June as an exception to my growing wariness about the housing market and home builder stocks. At the time, CCS looked like it would hold support at its 50-day moving average (DMA) and remain a strong house in a deteriorating neighborhood.
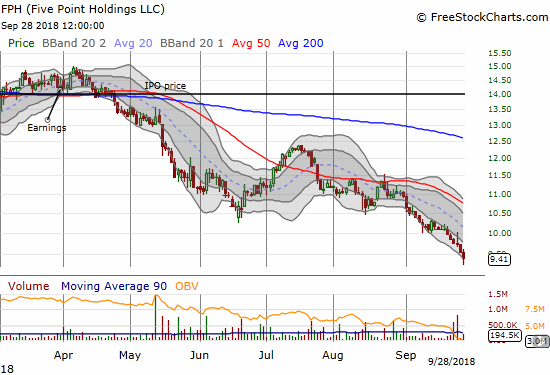
Five Point Holdings (FPH)
Price/Book: 1.04
Trailing P/E: 106.9, Forward P/E: 44.8, Price/Sales: 22.2
FPH has suddenly become my longest standing holding in the sector. While I slowly shed other positions, I stuck by newly issued FPH as a play on the strong performance in California’s housing market. The stock never gained any real traction and has spent a lot of time selling off. I held onto FPH assuming that the stock was just “misunderstood.” Instead, it was ME who misunderstood! At this point, I am just going to keep this position as a base holding through whatever cycle is underway for housing. Note that FPH’s high valuation beyond book value suggests the stock could go down a lot further if market sentiment stays negative.
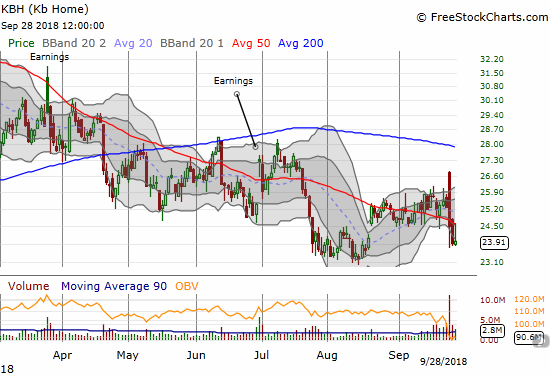
KB Home (KBH)
Price/Book: 1.04
Trailing P/E: 15.1, Forward P/E: 7.5, Price/Sales: 0.46
KBH is the latest home builder to suffer a bearish post-earnings fade. The market’s reversal confirmed that the pain in home builders is very much alive.
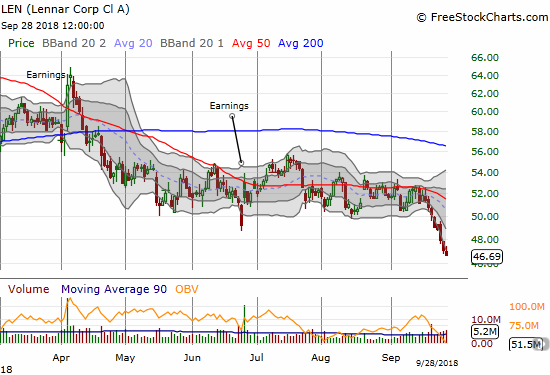
Lennar (LEN)
Price/Book: 1.13
Trailing P/E: 12.4, Forward P/E: 6.8, Price/Sales: 0.97
LEN has been a favorite speculative play on CNBC’s Fast Money since at least late May, and I have not liked a single one of the trading calls. LEN accelerated to the downside this past week. With a 19-month low, LEN now has the ominous look of popped euphoria (see the weekly chart).
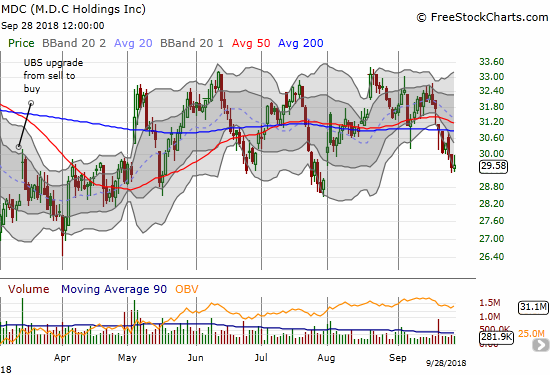
M.D.C. Holdings (MDC)
Price/Book: 1.12
Trailing P/E: 9.0, Forward P/E: 7.5, Price/Sales: 0.61
MDC is actually well above its low of 2018. The stock has also been rangebound since April, 2017. This trading action makes MDC a “strong performer” in the sector.
Meritage Homes (MTH)
Price/Book: 0.96
Trailing P/E: 9.4, Forward P/E: 6.7, Price/Sales: 0.48
At several points this year, I pegged MTH as my favorite stock among the home builders. I finally tired of the wild pivoting through a widening trading range. MTH is down 8 of the last 9 trading days. The stock closed at a new 52-week low and is down 22.1% year-to-date. Note that MTH has tended to bounce back from the kind of sharp sell-offs it suffered to end the month. So if I dare to make a fresh short-term trade in home builders any time soon, MTH will be at the top of the list (stay tuned on that one!).
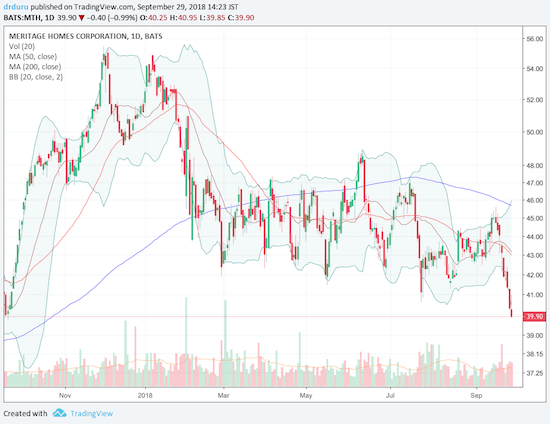
Source: TradingView
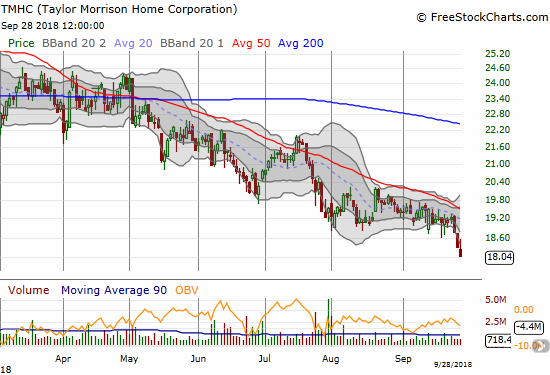
Taylor Morrison Home Corporation (TMHC)
Price/Book: 0.90
Trailing P/E: 15.7, Forward P/E: 6.4, Price/Sales: 0.5
TMHC is not a builder I follow closely, but the stock popped into my radar after watching a Nightly Business Report segment on CEO and Chairwoman Sheryl Palmer. She is the only female CEO among the publicly traded home builders. Unfortunately, since peaking with the rest of the sector, TMHC has experienced an on-going sell-off. Its attempted consolidation period was much shorter than for other builders. CNBC’s Jim Cramer interviewed Palmer right at the end of this consolidation – you guessed it, neither of them saw the cliff that waited less than a month away.
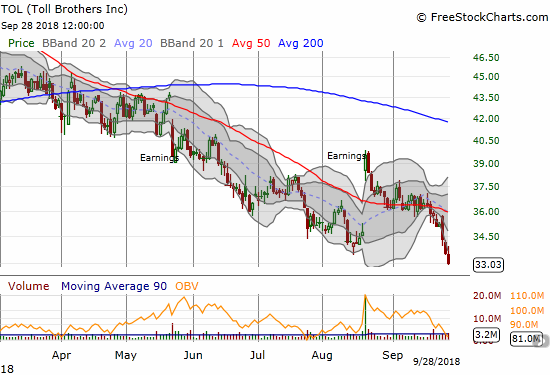
Toll Brothers (TOL)
Price/Book: 1.08
Trailing P/E: 8.3, Forward P/E: 6.4, Price/Sales: 0.72
TOL finally reversed all its post-earnings gains last week and closed the week at a 19-month low. The stock is closing in on a gap fill from February, 2017 that marked the beginning of a major breakout and run-up.
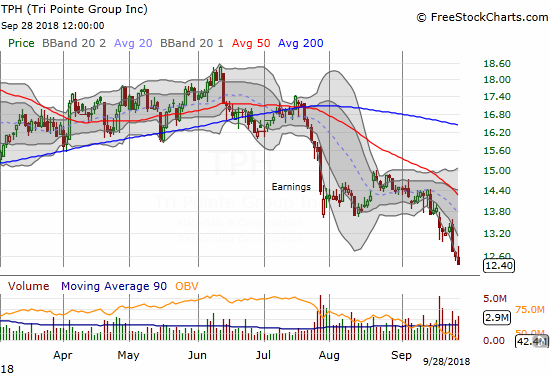
Tri Pointe Group (TPH)
Price/Book: 0.93
Trailing P/E: 7.5, Forward P/E: 6.3, Price/Sales: 0.59
TPH fell 6.5% last week to a 52-week low. I have long liked TPH and its business. If not for the bearish context in the sector, I would be loading up on the stock at these levels. Instead, I will just sit on my hands and continue looking for signs to be more optimistic about housing’s outlook.
Source for stocks unless otherwise stated: FreeStockCharts.com
Long-suffering Beazer Homes (BZH) is at 0.58 for its price/book ratio. This is one of the few home builders I largely ignore.
On the high side, LGI Homes (LGIH) and D.R. Horton (DHI) have price/book ratios of 1.89 and 1.85 respectively. Pulte Homes (PHM) is in the middle of the pack with a 1.56 price/book ratio.
In my Housing Market Review for September, I will discuss whether the housing data show ANY signs of a turn-around or at least a reason to bet against the market’s negative sentiment.
Be careful out there!
Full disclosure: long CCS, long FPH