
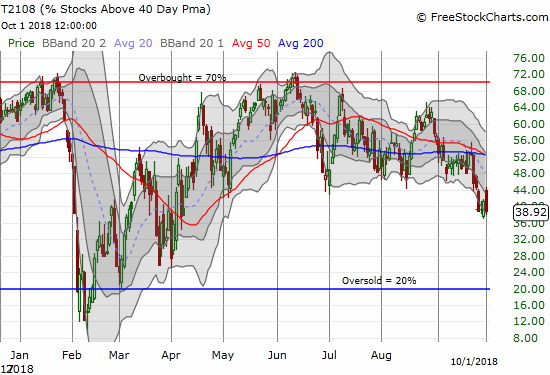
AT40 = 38.9% of stocks are trading above their respective 40-day moving averages (DMAs)
AT200 = 51.6% of stocks are trading above their respective 200DMAs
VIX = 12.1
Short-term Trading Call: neutral
Commentary
Looks like I had good reason to give a tepid endorsement to the upside potential for the stock market off the over-stretched conditions on display in AT40 (T2108), the percentage of stocks trading above their respective 40-day moving averages (DMAs). The S&P 500 (SPY) had every reason to rally robustly in the wake of a trade deal among the U.S., Canada, and Mexico. Instead, the index only gained as much as 0.5% or so before reversing almost the entire gain. Only a desperate bounce in the last 15 minutes of trading took the index to a 0.4% close.
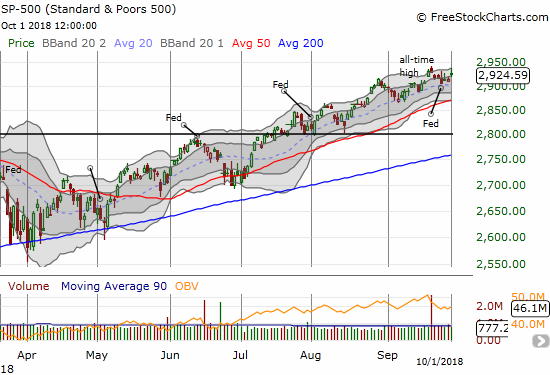
The S&P 500 sustained a hollow victory with AT40 sinking on the day to close below 40% again. AT40 has not looked this bad since April. Now I think the risk of going even lower is somewhere higher than 50%.
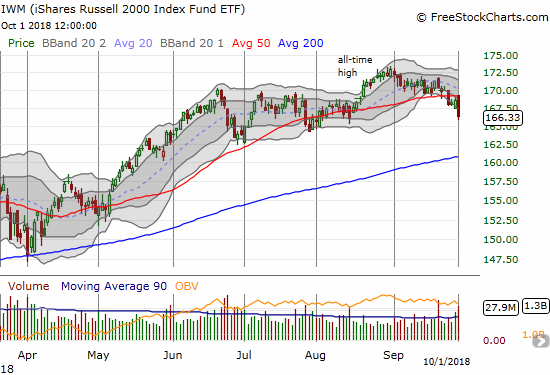
The anchor from small caps weighed quite heavily on AT40. The iShares Russell 2000 ETF (IWM) opened up and promptly faded from resistance at its 50DMA. IWM closed with a 1.3% loss and a 6-week low. A downtrend continues from IWM’s last all-time high.
The market did not worry about the broad, underlying weakness betraying the small gains on the S&P 500. The volatility index, the VIX, closed LOWER by about 1%. I went ahead and bought a small amount of SPY call options expiring October 8th that I plan to sell on the very next bounce or a fill of Monday’s gap up, whichever comes first. Beyond that trade, I am even more wary about the market than I was in the last Above the 40. I am still keeping the short-term trading call at neutral just out of deference for the relatively low level of AT40 while the S&P 500 remains above important support at its uptrending 20DMA.
CHART REVIEWS
General Electric (GE)
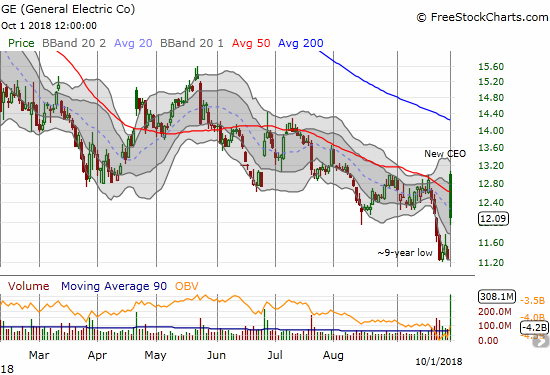
Last week I made the case for waiting on GE before making a fresh trade on a bottom. Then out of nowhere, GE replaced its CEO with former Danaher (DHR) CEO and current GE board member Larry Culp. The market’s initial reaction was extremely positive and easily cleared the thresholds for more safely playing a bottom. However, the stock failed to hold the best levels at the close and thus shut the down the buy trigger. GE even closed under its downtrending 20DMA; GE went from breakout to fakeout. This sharp fade makes a more aggressive trade even more risky than it looked on Friday.
CNBC Fast Money’s Karen Finerman made a case for a GE bottom from a fundamentals perspective. Like me, she likes the January 2020 call options. She is targeting the $13 strike while I have $15 strikes from an earlier dip.
Is GE a value trade or value trap? @karenfinerman makes the call. $GE pic.twitter.com/Im4ao1kCSu
— CNBC's Fast Money (@CNBCFastMoney) October 1, 2018
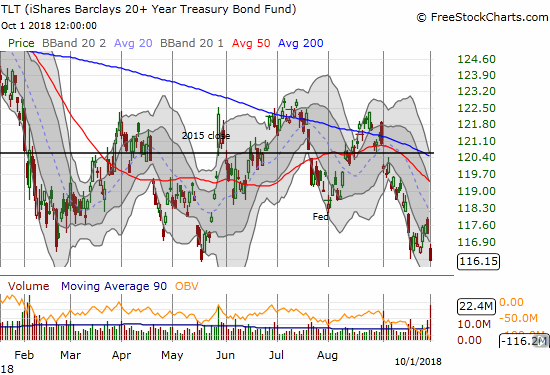
iShares 20+ Year Treasury Bond ETF (TLT)
Speaking of bottoms, TLT violated the bottom that I thought was secured with last week’s Federal Reserve announcement on monetary policy. Still, I doubled down on my TLT call options as they have suddenly become a very cheap hedge on bullishness. I fully expect TLT to soar again if the market sells off at some point this month.
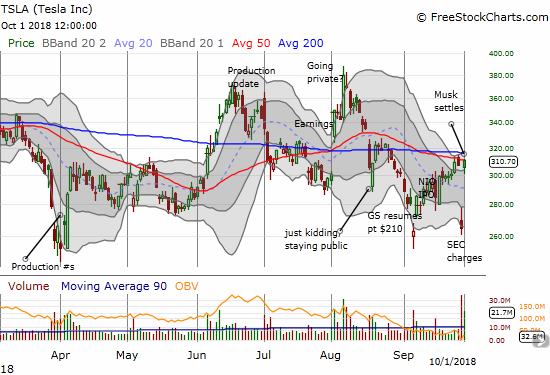
Tesla (TSLA)
TSLA delivered major relief in line with CEO Elon Musk coming to his senses and settling fraud charges from the SEC. In keeping with the tantalizing theme, TSLA nearly perfectly filled Friday’s gap down. As is its habit, the stock even closed at an obvious technical level which in this case was 50DMA resistance.
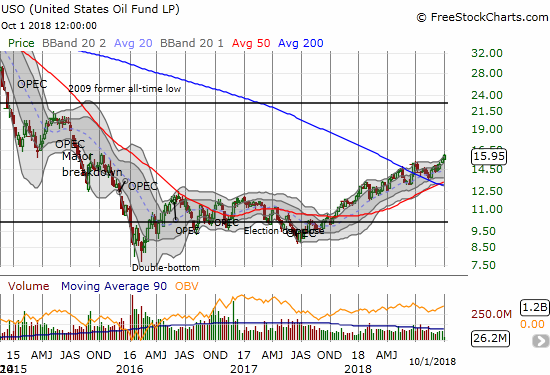
United States Oil (USO)
I suddenly see an elephant in the room: oil. Oil prices soared today perhaps in sympathy with Canada and the U.S making nice on a trade deal that includes Mexico. Whatever the reason, oil sitting around 3-year highs is NOT good news for consumers. Moreover, inflation watchers are likely starting to worry about inflation expectations creeping higher along with oil prices. I am now watching oil a lot more closely.
— – —
FOLLOW Dr. Duru’s commentary on financial markets via email, StockTwits, Twitter, and even Instagram!
“Above the 40” uses the percentage of stocks trading above their respective 40-day moving averages (DMAs) to assess the technical health of the stock market and to identify extremes in market sentiment that are likely to reverse. Abbreviated as AT40, Above the 40 is an alternative label for “T2108” which was created by Worden. Learn more about T2108 on my T2108 Resource Page. AT200, or T2107, measures the percentage of stocks trading above their respective 200DMAs.
Active AT40 (T2108) periods: Day #155 over 20%, Day #124 over 30% (overperiod), Day #1 under 40% (underperiod, ending 1 day above 40%), Day #6 under 50%, Day #22 under 60%, Day #75 under 70%
Daily AT40 (T2108)
")
Black line: AT40 (T2108) (% measured on the right)
Red line: Overbought threshold (70%); Blue line: Oversold threshold (20%)
Weekly AT40 (T2108)

*All charts created using freestockcharts.com unless otherwise stated
The charts above are my LATEST updates independent of the date of this given AT40 post. For my latest AT40 post click here.
Related links:
The AT40 (T2108) Resource Page
You can follow real-time T2108 commentary on twitter using the #T2108 or #AT40 hashtags. T2108-related trades and other trades are occasionally posted on twitter using the #120trade hashtag.
Be careful out there!
Full disclosure: long GE calls, long call TSLA call spreads, put spreads, and calendar put spread, long TLT calls
*Charting notes: FreeStockCharts.com stock prices are not adjusted for dividends. TradingView.com charts for currencies use Tokyo time as the start of the forex trading day. FreeStockCharts.com currency charts are based on Eastern U.S. time to define the trading day.