
Toll Brothers (TOL) is more than halfway through reversing a surprising post-earnings gap up a week and a half ago. The 13.8% post-earnings gain surprised me because the message from TOL was little different than its messages in the past two earnings reports that have coincided with an extended sell-off in the stock.
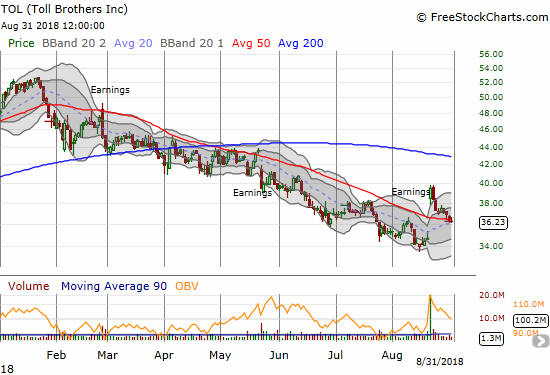
Source: FreeStockCharts.com
Post-earnings trouble is nothing new for TOL. Ahead of its late 2017 run-up TOL experienced two hiccups that looked troubling at the time. For its May, 2017 report, TOL gapped higher and faded enough to end the day at a loss (the dreaded “gap and crap”). In August, 2017, TOL gapped down and closed lower after reporting earnings. In both cases, investors eventually firmed up their confidence and took TOL higher. December’s poor post-earnings response ended a relentless buying streak that was only once interrupted by the market’s initial disapproval of the announced tax reform plan from President Trump’s administration.
The post-earnings positivity on August 21st was the first solidly positive response for TOL since February, 2017. Yet, the TOL message and strong financial performance has been nearly consistent. TOL even initiated a dividend last year and has been spending a large amount of money buying up stock. The market’s consistent skepticism suggests a sentiment anticipating peak performance and perhaps even an imminent downturn in housing. TOL’s valuation is also at or near downturn levels with a 1.2 price/book ratio. TOL’s 9.1 trailing and 7.1 forward P/Es and a 0.8 price/sales ratio normally represent an absolute steal.
I highlight the near consistency in TOL’s message and financial performance with choice selections from the last three earnings report.
December 5, 2017: 4Q 2017
“We completed FY 2017 with our highest annual contracts and revenues in over a decade…We ended FY 2017 with a $5 billion backlog, up 27% in dollars and 25% in units from one year ago. This should result in strong revenue and earnings per share growth in FY 2018.”
For the quarter, TOL repurchased approximately 5.2M shares at a $38.48 average price and spent about $200.2M. For the full year, TOL spent $290.9M buying back 7.7M shares at an average price of $37.81/share. TOL also instituted a dividend in fiscal year (FY) 2017.
TOL’s stock gapped down 9.6% in response to these earnings and ended the day with a 7.4% loss. In another month investors regained their confidence by closing the gap down. In another week, TOL peaked at a 14 1/2 year high and just short of its all-time high.
February 27, 2018: 1Q 2018
“The Company reaffirms its previous guidance for full FY 2018 Adjusted Gross Margin of between 23.75% and 24.25%…”
For the quarter, TOL repurchased approximately 4.4M at a $47.43 average price spending about $210.0M. For the second quarter to-date, TOL spent $65.3M buying back 1.4M shares at an average price of $46.07.
TOL’s stock initially gapped up for a 2.0% gain but quickly and sharply faded into a 5.1% loss. TOL managed to close marginally higher two weeks later, but it has not closed higher since.
May 22, 2018: 2Q 2018
“We had another solid spring selling season. The value of signed contracts, the highest quarter in our history, rose 18% in dollars on a 6% increase in units. On a same-store-basis, signed contracts of 9.04 per community were up 16% from last year and the highest for a second quarter since FY 2005. This was our eighth consecutive quarter of year-over-year same-store contract growth…
With our $6.36 billion backlog, our highest second-quarter backlog ever, we believe FY 2018 will be a year of significant revenue growth.”
For the quarter, TOL repurchased approximately 1.8M shares at a $45.44 average price, spending about $81.5M. For the year-to-date, TOL spent $291.6M buying back 6.2M shares at an average price of $46.86. TOL also increased its dividend in April to $0.11/share from $0.08/share.
August 21, 2018: 3Q 2018
“Revenues of $1.91 billion were up 27%, our highest third quarter ever…We achieved 12% growth in the value of new contracts signed, which, at $2.03 billion, was the highest for any third quarter in our history. Record third-quarter contracts and a third-quarter-end backlog, up 22% in dollars from one year ago, indicate revenue and earnings growth in FY 2019. On a per-community (same store) basis, contracts of 8.1 were the highest for a third quarter in over a decade, and up 18% compared to FY 2017…”
For the quarter, TOL repurchased approximately 3.7M shares at a $37.24 average price, spending about $136.0M. For the quarter-to-date, TOL spent $10.5M buying back 300K shares at an average price of $35.02. For the year-to-date, TOL spent $438.0M buying back 10.2M shares at an average price of $43.05.
Conclusion
With $728.9M spent buying back stock since fiscal year 2017, TOL must be quite surprised by this year’s persistent price decline. The company’s balance sheet remains strong, but its cash balance is now down to $522M. Its loans payable plus senior notes combine for a $3.6B liability. So it is clear that TOL will have to at least slow down its downward pursuit of its stock price. Given the market’s pessimism, I am guessing investors will interpret such a slowdown in buybacks as another signal of trouble ahead.
I want to interpret the market’s skepticism and pessimism as a golden value opportunity but staying on the sidelines has proven to be a good position. For a trade, TOL could be a buy here with a stop at a new 2018 low. I am waiting to see TOL bounce away from its 50-day moving average (DMA) as a potential sign that “this time” is actually different. Any time TOL finally makes a post-earnings high after its first day of market response, I will assume the stock is indeed turning around.
In the meantime, I produce some key notes from the last earnings conference call per the earnings press release and transcript provided by the company. I am eager to compare these results and the market’s response to November’s earnings report given November is the start of the seasonally strong period for the stocks of home builders.
Guidance (emphasis mine)
“…we project full FY 2018 deliveries of between 8,100 and 8,400 units with an average price between $835,000 and $860,000. This would result in revenues of between $6.76 billion and $7.22 billion, which would be the highest annual revenues in the history of the Company. Fourth-quarter deliveries are expected to be between 2,550 and 2,850 units with an average price of between $840,000 and $870,000.
For the full FY 2018, we are projecting an Adjusted Gross Margin of approximately 24.0%, which is consistent with the mid-point of our previous guidance, and 24.8% for the fourth quarter.”
“We expect to reach approximately 315 selling communities by fiscal year-end 2018, which should give us a strong start to fiscal year ’19. We expect interest in cost to sales to be 2.7% of revenues for the full year and 2.65% for the fourth quarter…
Fiscal year 2018 joint venture and other income guidance is approximately $145 million with approximately $55 million expected in the fourth quarter. We are also revising lower our full year effective tax rate from a midpoint of 24% to approximately 23%. Our fourth quarter effective tax rate guidance is approximately 28.5%…The full year share count is down 8.5% from last year’s fiscal year-end share count.”
Regional Markets
California stuck out as a source of disappointing (relative) weakness. Yet, as the initial post-earnings response demonstrated, the market was perfectly fine over-looking the commentary on California. Otherwise, I am sure the California weakness would have generated loud headlines.
“The value of our contracts in the West, South and Mid-Atlantic regions and in our City Living division were all up at least double digits while the North was essentially flat. In California, our contracts were down 1% in dollars and 4% in units. The comp the last year is unique and was frankly fairly extraordinary in that last summer we actually saw acceleration of sales over the spring, which is something that typically doesn’t occur. And I think what has happened this year is we’ve gone back to a normalized seasonality where the summer months are a little bit slower than the spring.”
“While California is not as hot as it was a year ago, it is still one of our stronger markets. Charolette [sic], Raleigh, Dallas, Houston and Austin drove our positive results in the South. “
Buyback
TOL attempted to allay analyst concerns that the company is reaching the end of its buyback efforts.
“With respect to capital allocation, we’ve obviously exceeded through 3 quarters the $400 million of guidance we gave, which was obviously very soft guidance as to how much stock we would buy back. And we will continue to be strategic in our buyback. So we have not exceeded some cap. And therefore, on the sidelines, we will continue to examine stock price, land opportunities, M&A opportunities and any other use of our capital. And share buyback will continue to be a growing part of our capital allocation as we move forward…”
Buyer and market behavior
As I noted in an earlier post, Redfin (RDFN) caused market-wide concern with warnings about recent weakness in the housing market. TOL is the first post-RDFN earnings report from a major home builder. TOL firmly refuted RDFN’s observations. I can only assume that the large post-earnings surge in TOL’s stock was part relief rally and part short-covering by bears who assumed that RDFN’s warning guaranteed another TOL post-earnings sell-off.
“…our mortgage company, TBI Mortgage, has seen behavior that seems to run counter to those headlines. Our cash buyers have jumped to roughly 24% this year compared to our more typical level of 20%. We have not seen an uptick in leverage rates and in fact, our buyers’ loan-to-value ratio in Q3 dropped to 67% from a more typical level of 70%.”
“May over May and June over June were slightly down and July was up….There is no region or division I will point to that drove it. My best guess is my comment about interest rates. They’re down. They stabilize right with the fear of rising and in fact came down 0.8 point over the last 3 months.”
An analyst rightly pointed out that with the full quarter up 7%, TOL must have experienced an extremely strong July. The looming question is whether this burst was an outlier or the sign of a refreshed and more confident housing market.
Then there is the constant hand-wringing over the reduced federal benefits for buying a home. TOL is still not worried (note that the company led the negative commentary on tax reform last year and then reversed its tune in December).
“…we’ve not seen any impact from SALT in those high taxed states. And the mortgage interest deduction now at $750,000 cap, we only have 18% of our mortgages in excess of that $750,000.”
Margins and costs
Increasing costs have become a part of the negative narrative for builders. I posted earlier about the sharp DROP in lumber prices in recent months. Of course, bears can turn around and take the plunge as a sign of weakness in demand for the housing market. TOL was cautious to note that the drop in lumber has not compensated for the increase in other costs.
“…over the next 3, 6, 9 months, we are encouraged by the drop in lumber pricing since it’s a — obviously major component on the material side of the home. But remember that has been offset with some continued cost creep on the labor side and some continued cost creep with some other materials.”
Be careful out there!
Full disclosure: no positions