
AT40 = 57.5% of stocks are trading above their respective 40-day moving averages (DMAs)
AT200 = 56.5% of stocks are trading above their respective 200DMAs
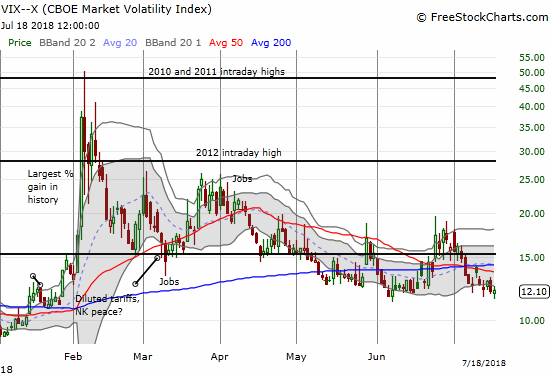
VIX = 12.1
Short-term Trading Call: neutral
Commentary
In my last Above the 40 post, I expressed my lingering suspicion of the market’s rally and drive right past a bearish divergence. Buyers continued their stubborn persistence by driving the S&P 500 (SPY) ever so slightly higher so far this week. The index closed at 2815.62 a day after gapping down in a move that initially looked like it confirmed the bearish divergence. Instead, gap buyers stepped right in and drove the S&P 500 to a strong closing price on Tuesday.
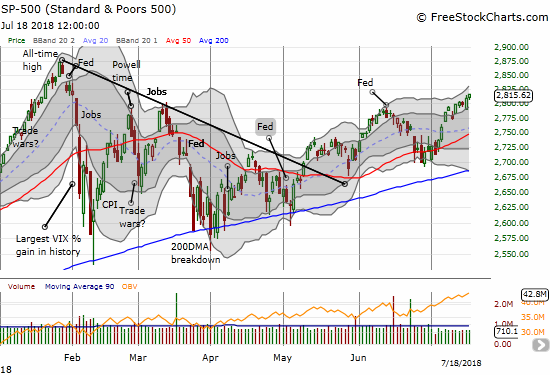
The buying has done nothing to resolve the bearish divergence. AT40, the percentage of stocks trading above their respective 40-day moving averages (DMAs), is still languishing below 60%. It ended last week at 58.4% and closed on Wednesday at 57.5%. In other words, the bearish divergence actually worsened slightly.
The volatility index, the VIX, is also staying stubborn. The fear gauge is clinging to the 12 level and still looks poised for the next upswing.
My latest tranche of SPY put options AND my latest swing at the weekly AAPL call trade will both likely go down in flames. The combination is a perfect commentary on this juncture of the market. The bearish divergence implies that only a select few “anointed” stocks will work for short-term trades. With earnings season in full swing, the stakes could not be higher for this latest setup in bearish divergence.
CHART REVIEWS
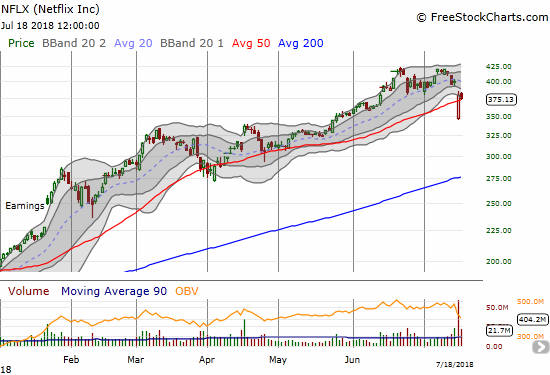
Netflix (NFLX)
In late June, I made a case for a top in NFLX. Ahead of earnings, NFLX ALMOST invalidated its bearish topping pattern. The stock’s nasty post-earnings gap down validated the topping pattern. However, consistent with the theme of stubbornness, buyers rushed into the breach and forced NFLX back over its 50DMA. That move was a very impressive 35 point (10%) swing at one point! Sellers were only able to take the stock back down to 50DMA support on Wednesday. I am watching NFLX closely as a sentiment barometer even as I used Wednesday’s weakness to fade the stock with a calendar put spread.
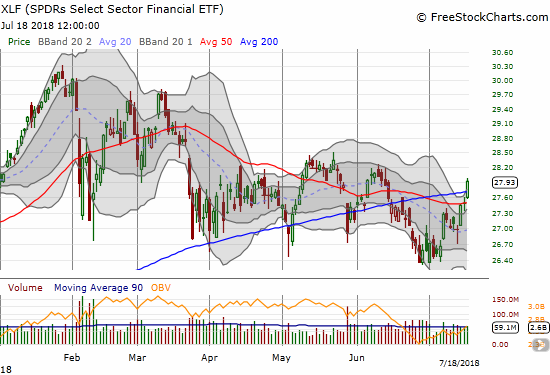
The Financial Select Sector SPDR ETF (XLF)
XLF has had an uncharacteristically strong week. On Friday, the finance-laden index swooned in the wake of some important earnings from financial institutions. The response this week has been markedly better. XLF broke out above the 200DMA resistance that has capped it for almost a month. While overhead resistance remains thick with multiple prior peaks, financials look like a decent rotation play as investors may leave “expensive” plays priced for perfection like NFLX and seek relative “safety” in beaten up regions like the financials where a lot of negatives may be priced in already.
— – —
FOLLOW Dr. Duru’s commentary on financial markets via email, StockTwits, Twitter, and even Instagram!
“Above the 40” uses the percentage of stocks trading above their respective 40-day moving averages (DMAs) to assess the technical health of the stock market and to identify extremes in market sentiment that are likely to reverse. Abbreviated as AT40, Above the 40 is an alternative label for “T2108” which was created by Worden. Learn more about T2108 on my T2108 Resource Page. AT200, or T2107, measures the percentage of stocks trading above their respective 200DMAs.
Active AT40 (T2108) periods: Day #103 over 20%, Day #72 over 30%, Day #67 over 40%, Day #10 over 50% (overperiod), Day #6 under 60% (underperiod), Day #23 under 70%
Daily AT40 (T2108)
")
Black line: AT40 (T2108) (% measured on the right)
Red line: Overbought threshold (70%); Blue line: Oversold threshold (20%)
Weekly AT40 (T2108)

*All charts created using freestockcharts.com unless otherwise stated
The charts above are my LATEST updates independent of the date of this given AT40 post. For my latest AT40 post click here.
Related links:
The AT40 (T2108) Resource Page
You can follow real-time T2108 commentary on twitter using the #T2108 or #AT40 hashtags. T2108-related trades and other trades are occasionally posted on twitter using the #120trade hashtag.
Be careful out there!
Full disclosure: long SPY puts, long AAPL calls, long NFLX calendar put spread
*Charting notes: FreeStockCharts.com stock prices are not adjusted for dividends. TradingView.com charts for currencies use Tokyo time as the start of the forex trading day. FreeStockCharts.com currency charts are based on Eastern U.S. time to define the trading day.