
AT40 = 56.7% of stocks are trading above their respective 40-day moving averages (DMAs)
AT200 = 57.5% of stocks are trading above their respective 200DMAs
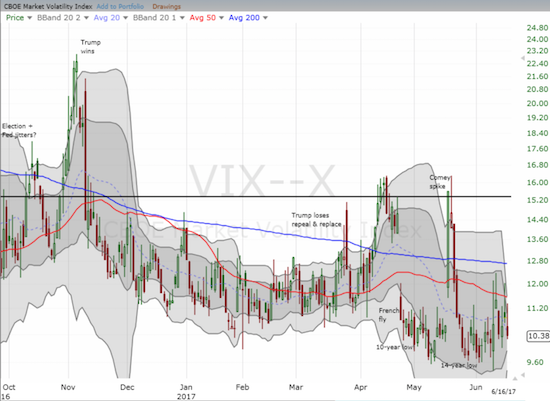
VIX = 10.4 (volatility index)
Short-term Trading Call: cautiously bullish
Commentary
The Federal Reserve gave the permission to the stock market that I awaited…well, sort of.
On Wednesday, June 14, 2017, the Federal Reserve issued its latest statement on monetary policy. The statement included another rate hike of 25 basis points (.25%) and the official launch of the Fed’s effort to reduce the size of its balance sheet. During the Q&A period, Fed Chair Janet Yellen had the opportunity to knock down stocks but instead took a pass:
“We have certainly noticed the stock market is up considerably over the last year. That usually shows up in financial conditions indexes and is an important reason why some of them show easier financial conditions.”
With the Fed ever so slowing tightening monetary conditions, Yellen could have easily noted a relative loftiness of stock valuations.
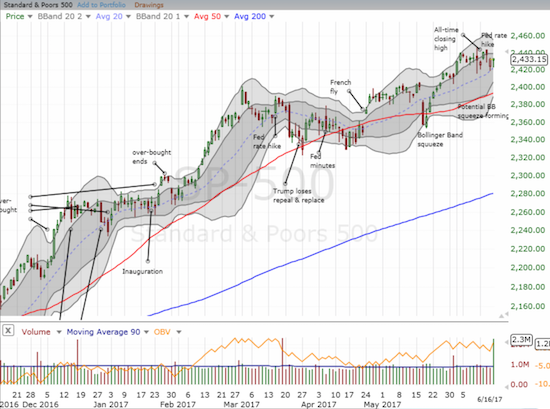
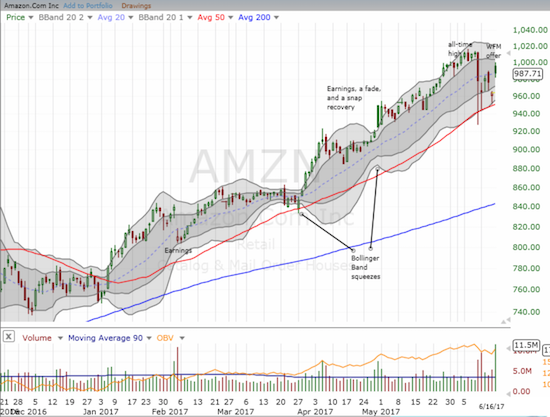
The S&P 500 (SPY) ended that day flat but lost a few points going into the end of the week. Its 20-day moving average (DMA) uptrend held up as support. Another Bollinger Band (BB) squeeze seems underway, but I am guessing the index is in for an extended period of consolidation until at least earnings next month. Investors will likely want to confirm all is well (or not) on the earnings front before making any decisive post-Fed moves.
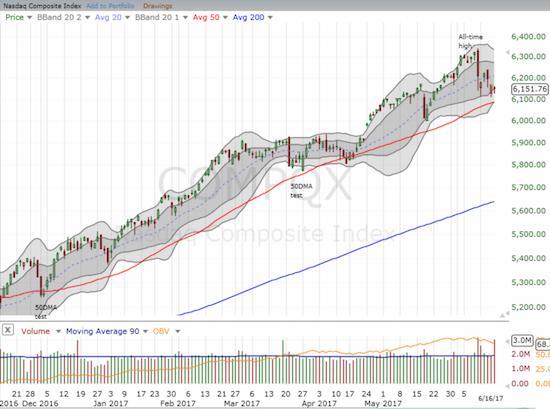
For the first time in a while, the NASDAQ is under-performing the S&P 500. The tech-laden index has yet to mount a serious reversal of the big 1-day sell-off from June 9th. Its 50-day moving average (DMA) is still holding as support; the same for the related PowerShares QQQ Trust (QQQ) which represents the biggest 100 stocks of the NASDAQ.
AT40 (T2108), the percentage of stocks trading above their respective 40DMAs, fell from its high pre-Fed perch of 64.2% and closed the week at 56.7%. This performance is still impressive given the recent calamities in big cap high-tech. AT40 did not get quite close enough to overbought status (above 70%) for me to declare this pullback a bearish moment. AT200 (T2107), the percentage of stocks trading above their respective 200DMAs, is performing similarly to AT40.
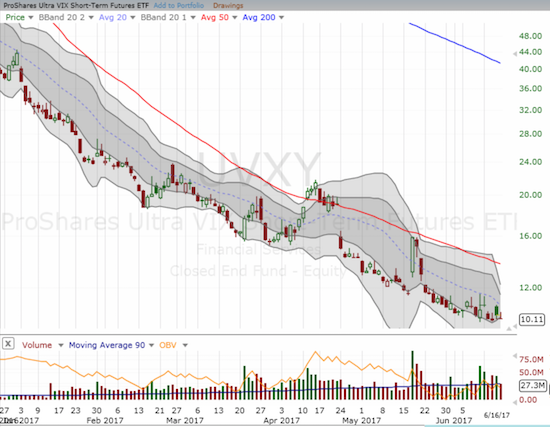
To underline the overall strength of the market, the volatility index remains comfortably seated in extreme lows. Each visit above 12, and even each stretch to solid intra-day gains, has been met with a subsequent implosion of volatility. In the wake of the Fed on Thursday, I departed from my strategy of quickly locking in profits from my call options on ProShares Ultra VIX Short-Term Futures ETF (UVXY). I thought maybe, just maybe, the market might churn further, even if just for one more day, in angst over the implications of the Fed’s latest move. I am now sitting on a small loss as a sharp reminder to stick to the script!
There are a lot of sub-themes I want to cover for additional color on the market and for my strategy going forward (for at least the next month or so until earnings). I have divided these into sections.
Tech stocks
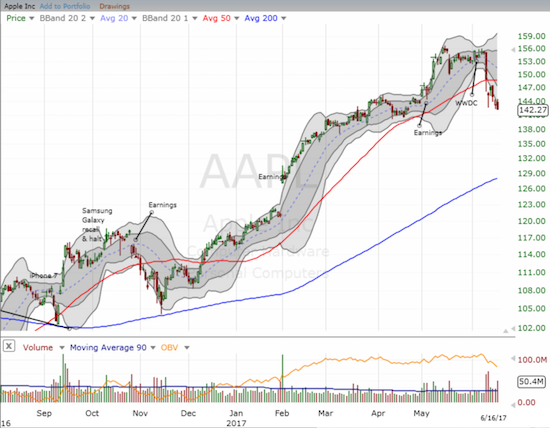
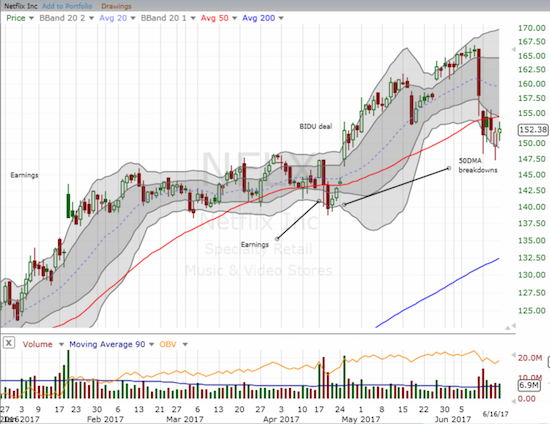
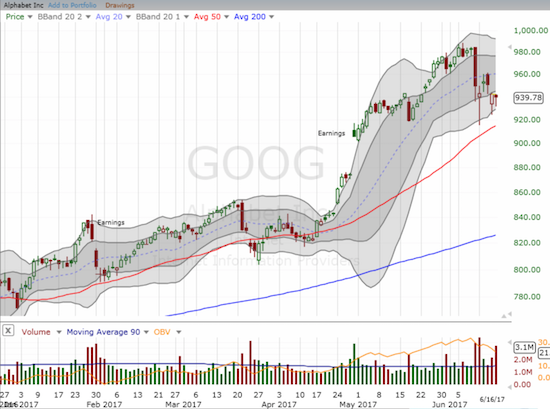
As I stated in a prior post, I used the swoon on big cap tech to trade the call options and/or shares of PowerShares QQQ Trust (QQQ), Apple (AAPL), and Nvidia (NVDA). Seeing AAPL continue to weaken, I decided on Thursday to speculate on a hedged (swing trade) approach. I bought call options on Alphabet (GOOG) and put options on Netflix (NFLX). While I eked out a small gain in GOOG, NFLX was a complete bust as it rallied into the end of the week – the exact opposite of what AAPL did.
It just so happened Amazon.com (AMZN) was the best big cap tech stock to play for the week. On Friday, AMZN even came within $0.25 of returning to the psychologically important $1000 level. I wish I had AMZN call options in play, but at least I did not leave the AMZN story of the week empty-handed.
Retail/Groceries
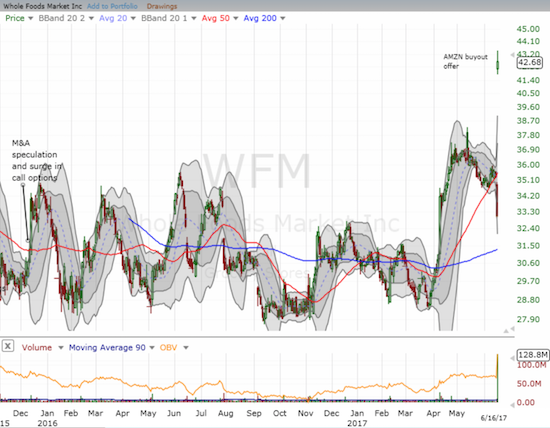
The biggest news from Friday was the move by Amazon.com (AMZN) to buy out Whole Foods Market Inc (WFM). AMZN offered to buy WFM for $13.7B in an all-cash deal. While this deal sent WFM soaring 29.1%, the truly remarkable reaction was the parallel 2.4% gain in AMZN which added about $11.1B in market cap.
The stock market essentially made the deal a no-brainer for AMZN as the company received WFM almost for free. Yet, industry-wide there were PLENTY of costs which turned the AMZN/WFM gain into a giant sucking sound. Nightly Business Report delivered extensive deal coverage that outlined a slew of casualties. The collateral damage ranged from grocery stores…
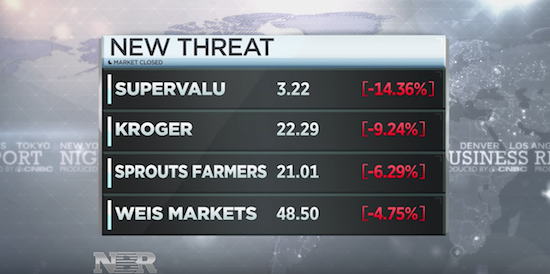
Source: Nightly Business Report
…to any store which sells food: trading down on heavy volume were Wal-Mart (WMT) by 4.7% although up notably from its low of the day, Costco (COST) by 7.2%, and Target (TGT) by 5.1% which was down as much as a whopping 12.4% at its low of the day (I wish my trading radar was up on THAT move!).
…to packaged goods companies which now face potentially tougher negotiations from a robust Amazon grocery business… Hershey’s (HSY) lost 2.7% (my buying radar is up!), Kellogg (K) lost 1.7%, and Mondelez (MDLZ) lost 1.5% all on heavy trading volume.
…to shopping center REITs which include grocers as tenants, considered by many to be stable renters…
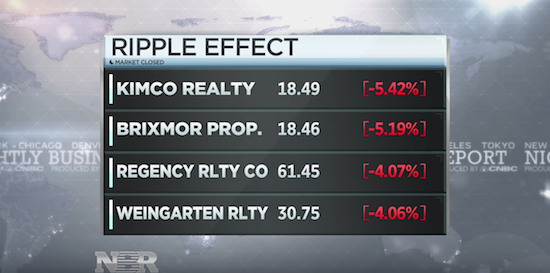
Source: Nightly Business Report
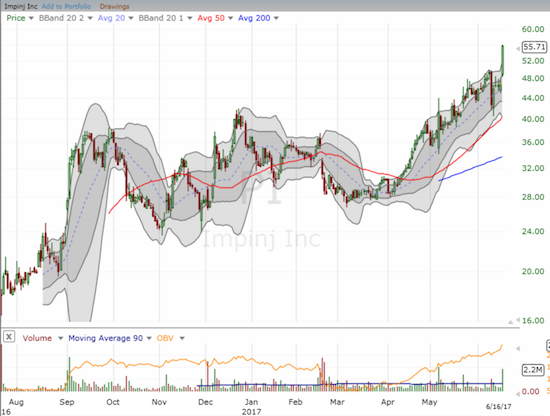
Even payment processor Vantiv (VNTV) took a 3.8% hit on high volume because presumably it will lose business due to the combined AMZN/WFM entity. The one sliver of sympathy benefit came from Impinj (PI) which soared 19.1% on high volume. This is a gain I will not chase: the move seems like an extremely speculative bet on a gain in business from WFM transactions that will presumably use RFIDs (Radio Frequency Identity tags) thanks to Amazon’s prowess in inventory automation. PI went public a year ago. The stock now sits at a fresh all-time high.
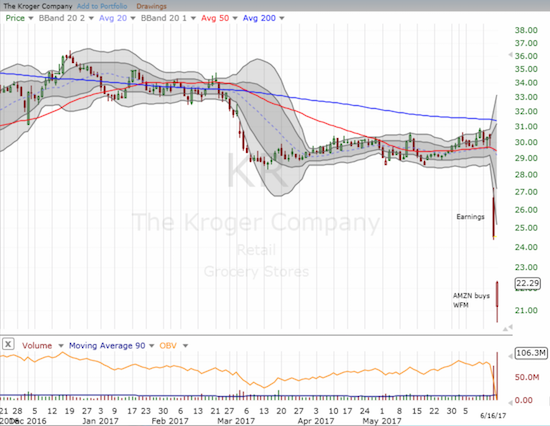
The ironic component of the market action was the large dip in WFM the previous day. Presumably in sympathy with a poor earnings report from Kroger Company (KR), WFM plunged 6.7%. KR sank 18.9%. I happened to be holding a substantial amount of WFM stock from an accumulation I made after fresh buyout talk/rumors in April. If I had not just gone through a similar situation with Nordstrom (JWN) where that stock plunged ahead of fantastic news and a big one-day jump, I would have cut my losses and bailed on WFM. Instead, I bit my lip, ground my teeth, and held. Thank goodness I did. I sold my shares into the post-Amazon gap up.
On Friday, I decided to start accumulating KR. The grocery business has been a rough business for a very long time. It has gone through cycles like the current one. Sure AMZN is poised to put a new twist on the competitive pressure, but the history for grocers is one of adaptability. To start my bet on a future rebound, I sold a single put option on KR expiring in January, 2018. I will be looking for additional opportunities to accumulate (likely using long-term call options). I have yet to figure out how to play the rest of the ripple effects of AMZN/WFM, but I strongly suspect some good value will emerge from the rubble. There are likely even good pairs trades in the mix.
Autos
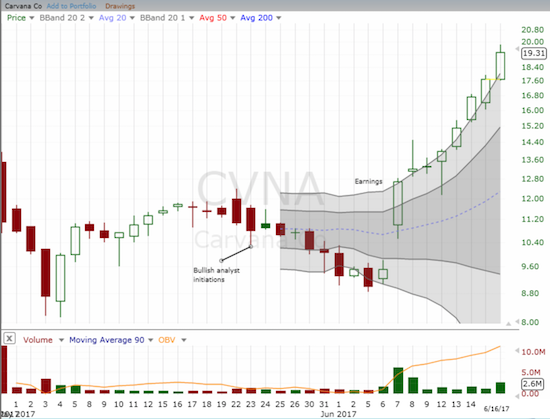
In an earlier Above the 40 post, I introduced my thoughts on plays in the market for used cars. Since then, I made major changes to my positioning. With earnings approaching on Wednesday, June 21st for Carmax (KMX), I decided to take a small profit in my short position. I will be watching the results closely and looking for a reason to get short again. I also took profits and sold my latest tranche of shares in Carvana (CVNA). With CVNA trading above its upper-Bollinger Band (BB), I figured it would pull back, and I would buy back shares relatively quickly. That tradeturned out to be premature in a big way. CVNA is up another 27% and running!
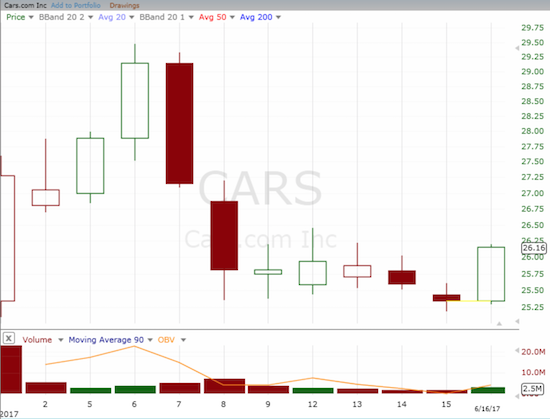
The spin-off Cars.com (CARS) finally showed some life. On Friday, CARS jumped 3.2% off its lows on slightly higher volume. I am still looking for this stock to challenge, and then surpass, its highest trading level to-date.
Forex
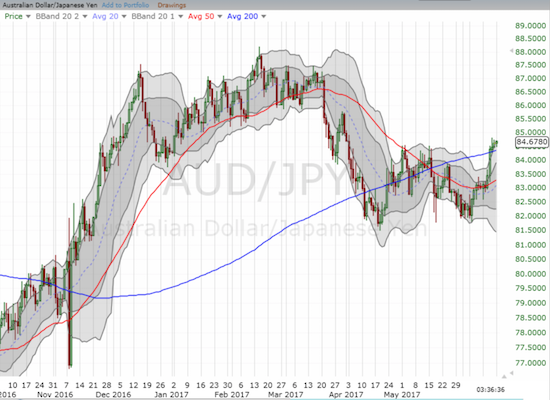
Plain and simple – the Australian dollar (FXA) is somehow on another strengthening cycle and the Japanese yen (JPY) is weakening. Put them together and AUD/JPY bullishly breaks out above 200DMA resistance and provides an all-clear to carry trades and a bullish bias for risk taking – like going long stocks.
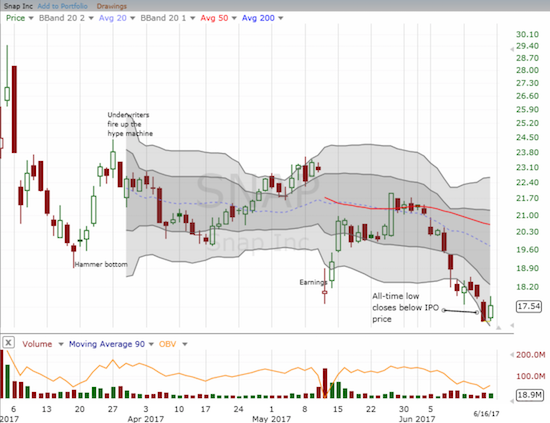
Snapchat
Snap, Inc. (SNAP) deserves its own section. I covered my last short position on June 7th as I figured SNAP was “close enough” to its IPO price and thus presented a poor risk/reward for staying short. Moreover, margin interest continued to creep higher. I think when I locked in profits, interest charges had gone up as high as 32% (annualized). I am now 100% long again as I fully speculate that by next earnings SNAP will figure out a way to re-excite investors and traders about its shares (perhaps with some timely help from underwriters). I just hope the stock does not break below its $17 IPO price again: otherwise SNAP could be launching through earnings from much lower levels. Also at stake will be pricing the deluge of shares sure to come after insider lock-ups expire starting sometime in September (I assume).
Fed Rate Trades
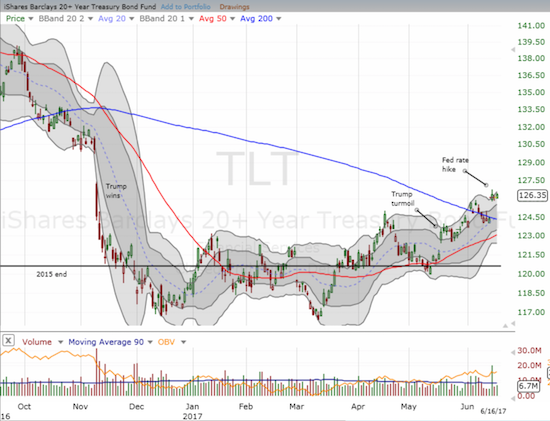
Now I bring things all the way back to where I started…the Fed. As has been the case for some time, the market reacted to the Fed’s rate hike in exactly the opposite intended direction: long-term rates decreased further. The iShares 20+ Year Treasury Bond ETF (TLT) gapped up above 200DMA resistance and closed at its highest point since election day. TLT seems perfectly poised to join the long and growing list of Trump trades that have completely reversed.
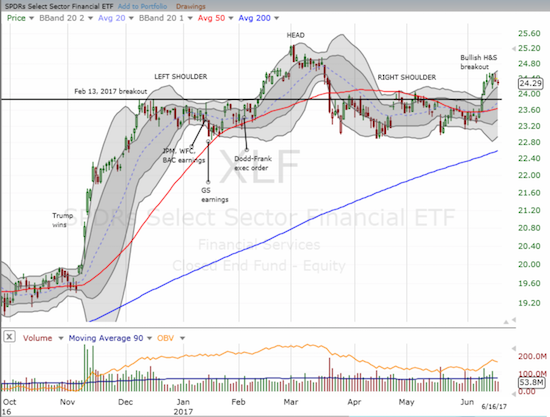
The decline in rates made the going tough for financials. The Financial Select Sector SPDR Fund (XLF) remains in a bullish breakout from a previously ominous head and shoulders pattern. Yet, XLF has also failed to follow-through on the breakout.
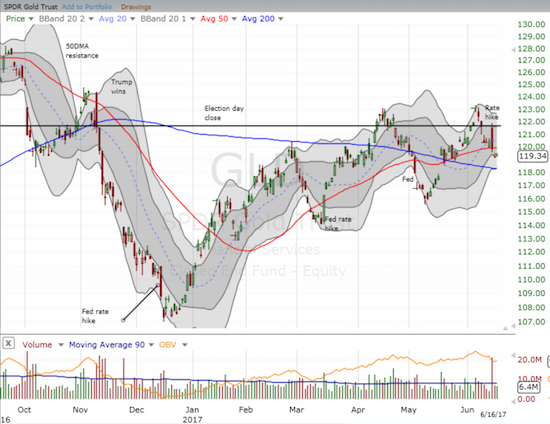
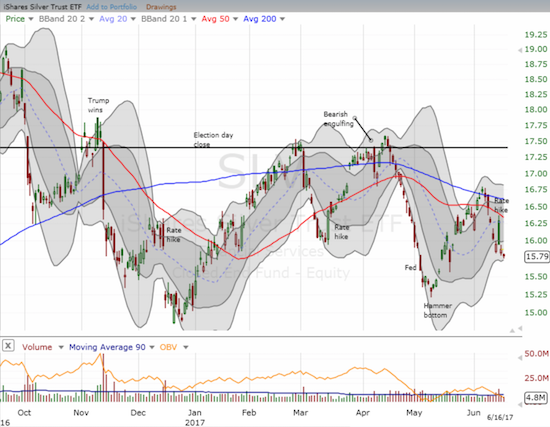
Strangely enough, gold (GLD) and silver (SLV) failed to gain from the decline in interest rates. Both precious metals gapped higher along with TLT and maintained a correlation that I would expect. Yet both faded hard into the day’s close and closed the week with a slight post-Fed loss. I will be watching this divergence closely for a new opportunity to execute pairs trades.
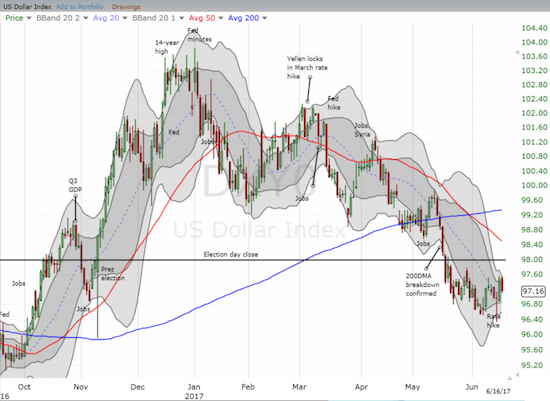
And then there is the U.S. dollar index (DXY0). The dollar had to rally off its intraday low to close flat on Wednesday. The dollar rallied the next day and sold down on Friday. It sits on a very marginal post-Fed gain that I am betting will melt away in due time with the dollar index returning to its previous (grinding) downtrend.
Note well that the market disagrees with the Fed on the timing for the next rate hike. Yellen is still talking up at least one more rate hike this year. The 30-day Fed Fund futures say another rate hike is not coming until at least March, 2018; this behavior may explain how and why long-term rates decreased. From the transcript…
“The median projection for the federal funds rate is 1.4 percent at the end of this year, 2.1 percent at the end of next year, and 2.9 percent at the end of 2019, about in line with its estimated longerrun value. Compared with the projections made in March, the median path for the federal funds rate is essentially unchanged.”
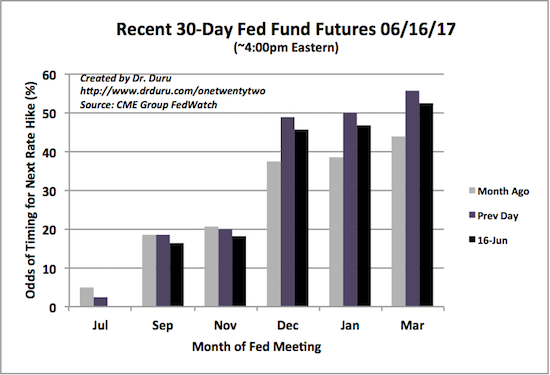
Source: CME FedWatch Tool
Finally, here are snippets from the rest of the transcript that I found of greatest interest:
- The Fed admits inflation remains surprisingly low but insists inflation has to increase given other economic conditions…
- Business people and consumers have yet to plan for any economic impact from President Trump’s wishes for fiscal policy…
- Monetary policy remains accommodative…
- No one has any good idea on where the neutral Fed rate sits…
- Balance sheet reduction will have no market impact…(emphasis mine)
- The best estimate for the launch of balance sheet reduction is “soon”…
- Dodd-Frank regulations have not impeded credit growth…
“Our statement indicates that we expect inflation to remain low in the near term. But on the other hand, we continue to feel that with a strong labor market and labor market that’s continuing to strengthen, the conditions are in place for inflation to move up. Now, obviously we need to monitor that very carefully.”
“I would say that based on my observation of actual spending behavior and my discussions with our wide range of contacts that I haven’t seen very much evidence that thus far expectations of policy changes have driven substantial changes in either consumer spending or investment spending.”
“We’re not moving so aggressively as to put a break on continued improvement in the labor market.”
“And also the fact, we’re quite uncertain ourselves about what the likely– what the evolution will be of the neutral federal funds rate. So, we do try to write that down and provide the public with information about our current expectations. And the median now stands at around 3 percent but we have uncertainty about that. Many of my colleagues, and I, think that the current neutral level is lower than that. And as I said in my opening statement, the fed funds rate path reflects an expectation that that neutral rate will be moving up some in future years. But that remains uncertain and I think that’s something that market participants are trying to assess and we will be as well.”
“So that when this plan does go into effect, no one is taken by surprise and market participants understand how this will work. I think that we– the plan is one that is consciously intended to avoid creating market strains and to allow the market to adjust to a very gradual and predictable plan. My hope and expectation is that when we decide to go forward with this plan, that there will be very little reaction to it, that it’s clear how we intend to proceed and that this is something that will just run quietly in the background over a number of years, leading to a reduction in the size of our balance sheet and in the outstanding stock of reserves, and that it’s something that the committee will not be reconsidering from time to time. We think this is a workable plan and it will, as one of my colleagues, President Harker described it, it will be like watching paint dry, that this will just be something that runs quietly in the background.”
“…if the economy evolves in line with our expectations which, you know, we will be watching, always are, we could put this into effect relatively soon.”
“…with respect to the impact of credit conditions and bank regulation on slow growth, I previously in testifying indicated that I don’t think that our regulations have played an important role at least broadly speaking in impeding credit growth and the growth of the economy. And I’ve pointed in the past to a number of statistics suggesting that credit growth continues to be healthy, including among small– smaller community banks that are most concerned with regulatory burden.”
Be careful out there!
— – —
FOLLOW Dr. Duru’s commentary on financial markets via email, StockTwits, Twitter, and even Instagram!
“Above the 40” uses the percentage of stocks trading above their respective 40-day moving averages (DMAs) to assess the technical health of the stock market and to identify extremes in market sentiment that are likely to reverse. Abbreviated as AT40, Above the 40 is an alternative label for “T2108” which was created by Worden. Learn more about T2108 on my T2108 Resource Page. AT200, or T2107, measures the percentage of stocks trading above their respective 200DMAs.
Active AT40 (T2108) periods: Day #339 over 20%, Day #153 over 30%, Day #20 over 40%, Day #7 over 50% (overperiod), Day #2 under 60% (underperiod), Day #99 under 70% (corrected from June 9, 2017 post by doing complete recount!)
Daily AT40 (T2108)
")
Black line: AT40 (T2108) (% measured on the right)
Red line: Overbought threshold (70%); Blue line: Oversold threshold (20%)
Weekly AT40 (T2108)

*All charts created using freestockcharts.com unless otherwise stated
The charts above are my LATEST updates independent of the date of this given AT40 post. For my latest AT40 post click here.
Related links:
The T2108 Resource Page
You can follow real-time T2108 commentary on twitter using the #T2108 or #AT40 hashtags. T2108-related trades and other trades are occasionally posted on twitter using the #120trade hashtag.
Be careful out there!
Full disclosure: long AAPL call options, long NVDA call and put spread and shares, short KR put option, long GLD, long SLV, long CARS, long JWN call options, long XLF call options, short AUD/JPY
*Charting notes: FreeStockCharts.com uses midnight U.S. Eastern time as the close for currencies.
Pretty! This was an extremely wonderful article. Thank you for supplying these details.