
AT40 = 35.7% of stocks are trading above their respective 40-day moving averages (DMAs)
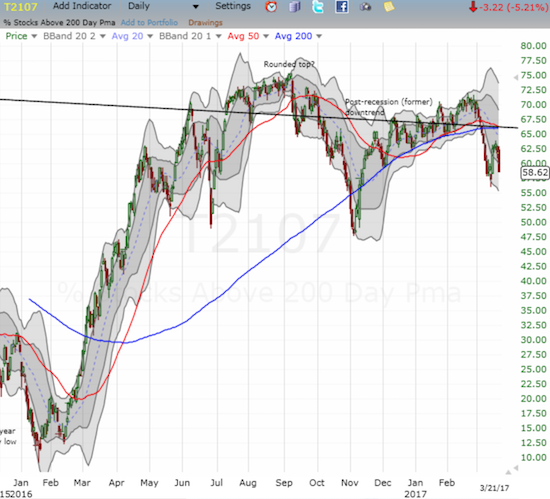
AT200 = 58.6% of stocks are trading above their respective 200DMAs
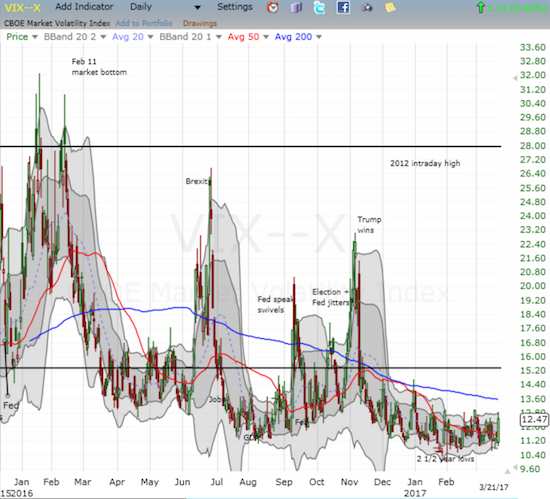
VIX = 12.5 (volatility index)
Short-term Trading Call: bearish
Commentary
The S&P 500 (SPY) finally flipped the switch on the bearish threshold I have described since the last bullish breakout to new all-time highs. At that time the stock market celebrated President Trump’s address to a joint session of Congress. This one-day plunge immediately put the index’s support at its 50-day moving average (DMA) into play. The move also planted a definitive bearish spin on the reaction to the Fed’s rate hike last week.
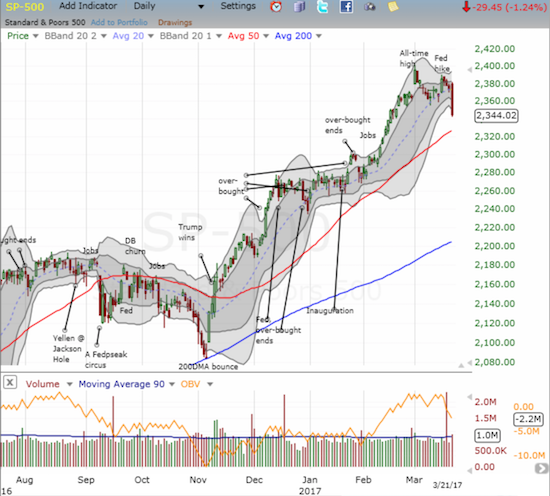
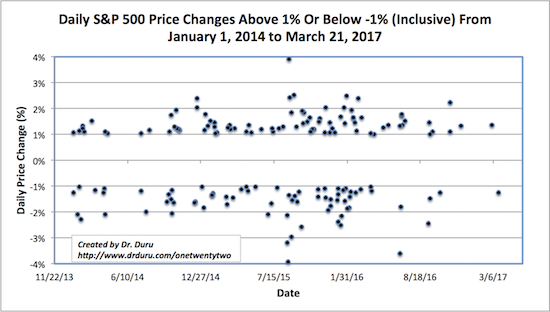
The selling felt worse than it really was because in recent months the S&P 500 has so rarely made one percent moves, much less one percent declines. March 21, 2017 delivered the worst one-day performance for the S&P 500 since Trump was elected President. The last decline worse than -1% was on October 11, 2016 of -1.2%, exactly the same decline as today. That 109 trading day stretch without a decline of 1% or more missed the all-time record by one trading day set in 1995. The last 1%+ gain was on March 1, 2017. The chart below shows the sparsity of one percent moves since May, 2016 relative to the preceding months.
Source for price data: Yahoo Finance
AT40 (T2108), the percentage of stocks trading above their respective 40DMAs, confirmed the day’s weakness. AT40 dropped from 46.5% to 35.7%. This close officially reversed ALL of AT40’s post-election gain. The move is yet one more reminder of why extended bearish divergences are important warnings. When AT40 swooned last week below 40%, the S&P 500 barely responded, stubbornly held onto support at its uptrending 20DMA, and failed to close below my bearish threshold. THIS time, the S&P 500 came tumbling down along with AT40 in a synchronous move that confirmed the market’s selling pressure.
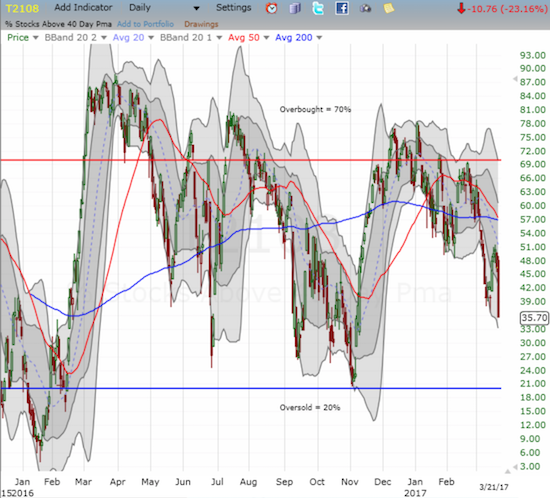
TraderMike provided a great description of the significance of bearish divergences in his latest review of the market’s technicals. In “READING TODAY’S TECHNICAL DAMAGE VIA THE SCANS PAGE AND GENERAL MARKET ANALYSIS PAGE” he covered the market’s technical weakness from many angles. Like TraderMike, I too have been nagged with the bearish implications of the year’s divergence. It never allowed me to flip the short-term trading call to bullish when I might otherwise have done so. This nagging was particularly important as I reviewed the mild one-day bullish divergence from last Friday. In that review, I pointed out that a sell-off into oversold conditions (AT40 below 20%) would not likely be a steep one. Sure enough, AT40 is at a level where I would start to consider “close enough” to oversold while the S&P 500 has yet to even test uptrending 50DMA support.
AT200 (T2107), the percentage of stocks trading above their respective 200DMAs, should give the bulls and buyers a little encouragement. AT40 dropped just a few percentage points, and it did NOT make a new recent low. The low from last week stands which means a few key stocks actually strengthened their hold on 200DMA support from last week and into today’s selling.
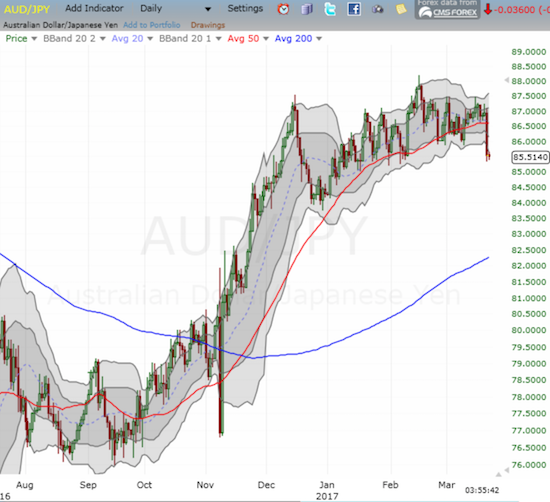
As often happens in these sell-offs, the currency market provided my first clues of trouble. The Australian dollar entered U.S. trading in trouble. It was weak across the board. In particular, AUD/JPY had cracked through its 50DMA support and even the U.S. dollar had momentum on the currency. This bearish warning sign from forex put me in the proper mood going into the U.S. trading day. Note that I covered my short on AUD/JPY into this sell-off (sellers have too often failed to deliver follow-through).
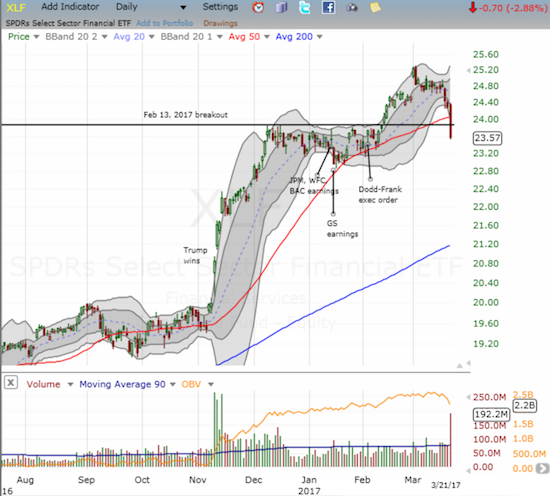
I next looked at financials, the stocks that are supposed to be leading the market. The Financial Select Sector SPDR ETF (XLF) was weak coming into the week, so financials were suspect from the beginning. So after a small gain at the open quickly turned into red and a breach of 50DMA support, I assumed I had my confirmation that the S&P 500 would likely break down.
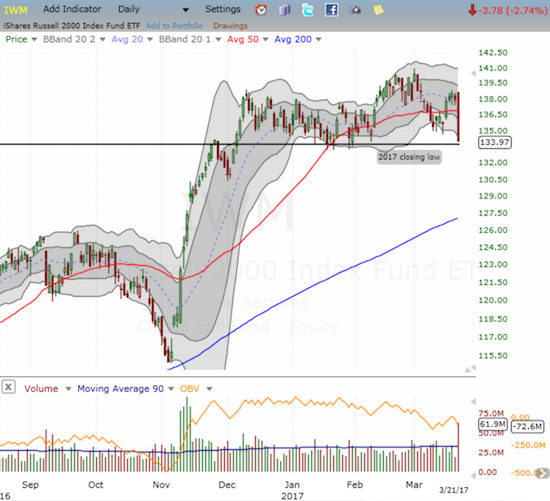
The iShares Russell 2000 (IWM) suffered a similar loss as XLF. The one good sign is that the ETF of small-cap stocks managed to hold the line at 2017’s closing low. Yet, given the current downward momentum, I doubt this line will hold for long. IWM is back to negative for 2017 year-to-date performance.
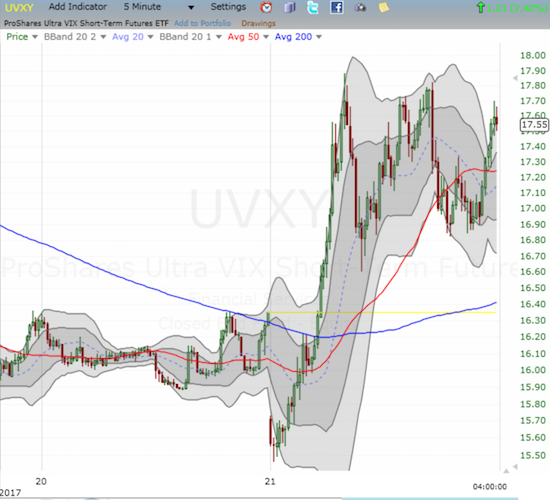
The volatility index responded to the bearishness with an intraday surge. The closing gain of 10.0% was surprisingly not enough to break the VIX out of its recent consolidation, but it was enough to create a great intraday trading opportunity in the volatility products. With the bearish signs abounding, I rushed to buy call options on the ProShares Ultra VIX Short-Term Futures (UVXY) even though UVXY was already up around 4% or so at the time. The 5-minute chart shows how UVXY swooshed and swooned throughout the day. I flipped out my call options on the rush to the day’s first high. A fresh limit order to buy back in never filled (I must have JUST missed out!).
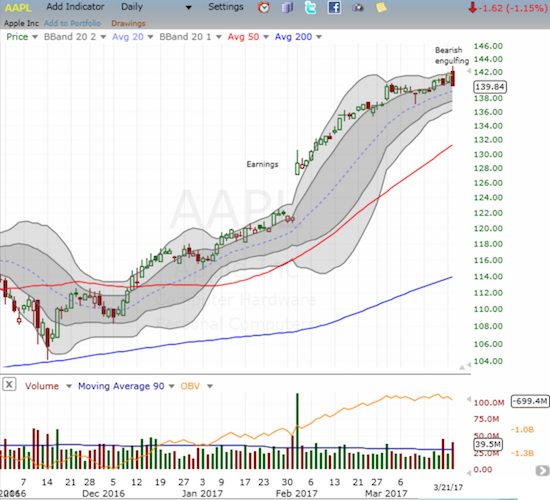
The warning signs also made me rush to take profits on this week’s Apple (AAPL) trade on call options. I also took profits on my shares in Cognizant Technology (CTSH). The AAPL trade was the most fortuitous. AAPL faded hard from its high of the day and closed with a 1.2% loss. More importantly, the move printed a bearish engulfing topping pattern. Needlessly to say, I am bringing my weekly trade on AAPL call options to an end here.
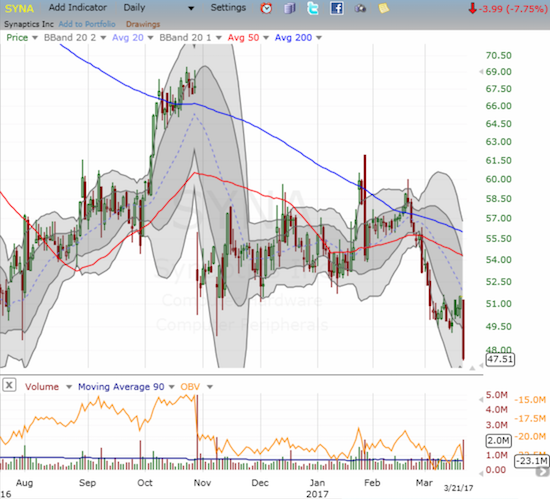
Since sellers have been so incapable of follow-through for so long, I did not move too aggressively into new short positions. I did load up on shares of ProShares UltraShort S&P500 (SDS) which carry a stop loss upon the S&P 500 breaking out to a new all-time high. Synaptics was the one new stock I went after, and it delivered good results by the close. I bought put options on SYNA after it cracked last week’s low. It ended the day with a 7.8% loss and a new 8-month low. SYNA is just a few points away from levels last seen in late 2013.
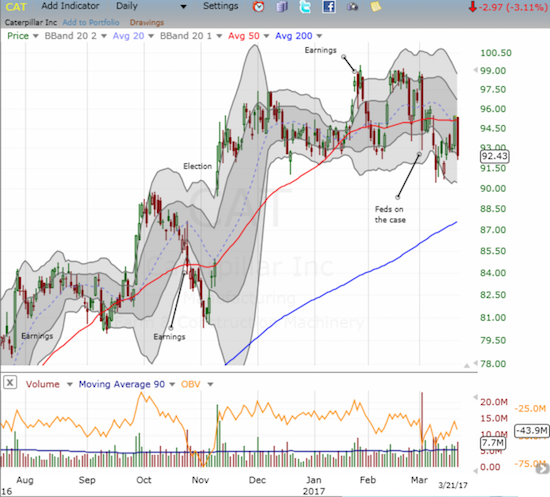
Caterpillar (CAT) is on the verge of adding its blessings to the sell-off. CAT lost 3.1% on the day as 50DMA resistance held. I added to my put options on the previous day’s close at resistance. It was a bit of a speculative move encouraged by the sudden plunge earlier this month that delivered surprise profits. (Readers recognize that I use CAT as a regular hedge against bullishness).
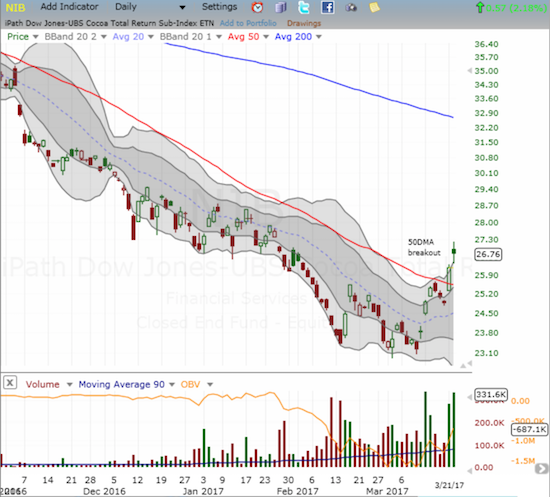
One buy of the day was iPath Bloomberg Cocoa SubTR ETN (NIB). NIB has stayed on my radar every day since I identified a potential bottom. That bottom was confirmed with today’s follow-through to yesterday’s breakout, and I was fortunate enough to add to my position on an intraday pullback.
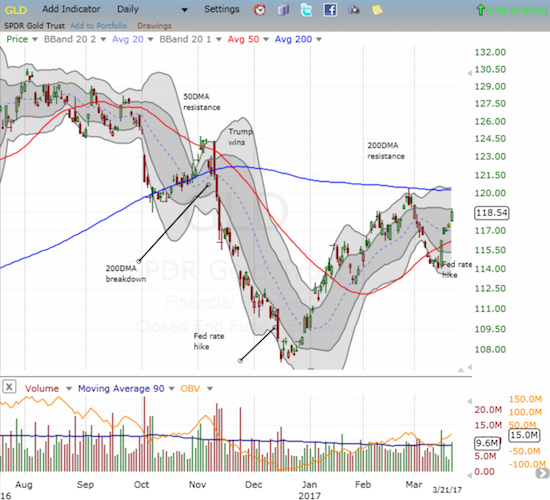
The decline in the U.S. dollar index combined with a fresh decline in bond yields have driven the SPDR Gold Shares (GLD) higher. I am still sitting on my accumulated call options from my gold versus bonds pairs trade. I added to the rebuilt put side of the trade on iShares 20+ Year Treasury Bond (TLT). I find it hard to imagine that just last week I assumed this second phase of the trade had come to an effective end.
There are a myriad of catalysts I could pull out the headlines to claim as drivers of today’s return of the bears. However, the technicals in this case are sufficient, especially since some of the presumed drivers are known catalysts that the market until today simply chose to ignore. The bearishness is a culmination of many signals which I explained in their greatest detail two weeks ago “A Quiet Pre-Fed Breakdown for the Stock Market.” The non-participation of financials in the stock market’s reflex post-Fed celebration was the most significant of the warnings since last week. However, note carefully that I am not aggressively bearish and certainly not calling for a big crash or sell-off in this moment. AT40 is already at low levels – just a little more selling will push me into considering the bullish case. Now once this low volatility period runs its course, I will start to get a lot more bearish…
— – —
FOLLOW Dr. Duru’s commentary on financial markets via email, StockTwits, Twitter, and even Instagram!
“Above the 40” uses the percentage of stocks trading above their respective 40-day moving averages (DMAs) to assess the technical health of the stock market and to identify extremes in market sentiment that are likely to reverse. Abbreviated as AT40, Above the 40 is an alternative label for “T2108” which was created by Worden. Learn more about T2108 on my T2108 Resource Page. AT200, or T2107, measures the percentage of stocks trading above their respective 200DMAs.
Active AT40 (T2108) periods: Day #273 over 20%, Day #93 over 30% (overperiod), Day #1 under 40% (underperiod, ending 4 days over 40%), Day #2 under 50%, Day #14 under 60%, Day #45 under 70%
Daily AT40 (T2108)
")
Black line: AT40 (T2108) (% measured on the right)
Red line: Overbought threshold (70%); Blue line: Oversold threshold (20%)
Weekly AT40 (T2108)

*All charts created using freestockcharts.com unless otherwise stated
The charts above are my LATEST updates independent of the date of this given AT40 post. For my latest AT40 post click here.
Related links:
The T2108 Resource Page
You can follow real-time T2108 commentary on twitter using the #T2108 or #AT40 hashtags. T2108-related trades and other trades are occasionally posted on twitter using the #120trade hashtag.
Be careful out there!
Full disclosure: long put options on CAT and SYNA, long SDS, long GLD shares and call options, long put options on TLT, long and short various positions on the U.S. dollar index