
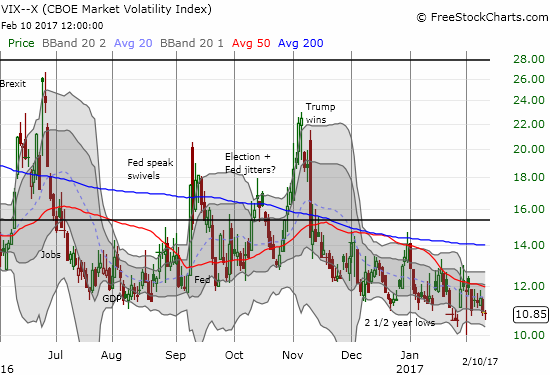
The volatility index, the VIX, has closed below 11 for 2 straight days, 3 of the last 6, and 6 of the last 13 days.
Source: FreeStockCharts.com
These low levels of the VIX seem dangerously low, and I have labelled them as such in my recent “Above the 40” posts. Yet, I have discovered the record of the aftermath of low VIX extremes is quite mixed. The last time the VIX closed below 11 was July 3, 2014. This was the last day of a period of extremely low volatility that began with a drop below 11 on June 6, 2014. This extremely low volatility seemed particularly dangerous because the S&P 500 (SPY) was hitting all-time highs. Yet, it took the S&P 500 (SPY) 70 more trading days before it managed to pull back at least 5% from that first day the VIX closed below 11. I use 5% as the bare minimum definition of a “significant pullback.” Two and a half years later, the VIX has once again closed below 11 alongside new all-time highs for the S&P 500. So, should traders be concerned?
To answer this question I looked at the entire history of the VIX available from Yahoo Finance, all the way back to January 2, 1990. I marked off all the trading days where the VIX closed below 11. Once 20 trading days passed with the VIX staying above 11, I counted the last day on which the VIX closed below 11 as the end of an “extremely low volatility period.” My use of 20 trading days (4 calendar weeks absent holidays) is somewhat arbitrary, but this rule allowed me to simplify the definition of drawdowns following periods of extremely volatility. This rule created 13 such periods including the current one which began on January 25, 2017. Without the rule I ended up with 42 periods of extremely low volatility where too often 1) the VIX would bounce above and below 11 or 2) the VIX would trade below 11 for long stretches interrupted by just a few days above 11. In neither case did the S&P 500 pullback significantly only to drop right back into extremely low volatility.
For reference, I post below a list of all the periods of extremely low volatility. The list includes the start date followed by the duration of the period counted by trading days. I put an asterisk next to the periods that preceded a 5% pullback in the S&P 500 as measured by the intraday LOW (I used this measure as it represents the full extent of the market risk).
4/15/93: 1
7/9/93: 6
10/15/93: 1
*12/13/93: 38
2/3/95: 15
*6/16/95: 1
12/4/95: 14
7/12/05: 13
11/21/05: 35
*3/14/06: 14
*10/13/06: 90
*6/6/14: 20
1/25/17: ?
First note that of the 12 completed periods of extremely low volatility, only FIVE preceded pullbacks of at least 5% for the S&P 500 as measured from the last day of the period. The last three periods of extremely low volatility all preceded such pullbacks. In other words, since 1990, not only have periods of extremely low volatility been rare, but also pullbacks following such periods were NOT the norm until 2006. Whether we should expect the current period to be like the last three or more like the previous 9 is a matter of perspective. This is where I combine VIX-wariness with the technical signals provided by AT40, the percentage of stocks trading above their respective 40-day moving averages (DMAs). You can read more at “Above the 40.”
At a minimum, the historical record suggests that it takes a lot of time for the S&P 500 to weaken after a period of extremely low volatility. This delay is a testament to the tremendous buying power (and/or complacency) that is required to push the VIX so low. To show this delay, I calculated the change in the S&P 500 as measured from the last day the VIX dropped below 11. From there, I counted off the number of trading days it took for the S&P 500 to lose at least 5%. Since we cannot know in advance when the period of extremely low volatility will end, I include in parentheses the total days as measured from the first day of the period. The date is the date the pullback reached at least 5% (again, as measured from the LAST day of the period of extremely low volatility).
3/28/94: 36 (73)
10/12/05: 53 (65)
6/8/06: 49 (62)
3/5/07: 6 (95)
10/13/14: 70 (89)
Note that even when a pullback quickly followed the end of a period of extremely low volatility, that period lasted a very long time! IF a 5% pullback occurs, the average time for it to happen is 77 days. If that average prevails for the current period, the 5% pullback will not occur until mid-May! Sell in May anyone?
The big lesson here is that bears take on larger than expected risks trying to predict a top once a period of extremely low volatility begins. With the S&P 500 currently at all-time highs, we of course know now that every single pullback and trial and tribulation had a happy ending, but these data show that the opportunity window for shorting a low-volatility market is more fleeting than we might originally expect. It is a counter-intuitive result given the presumption that high complacency leads to bad results.
For additional reference, I post below a distribution chart that shows the percent of time the VIX spends at various levels.
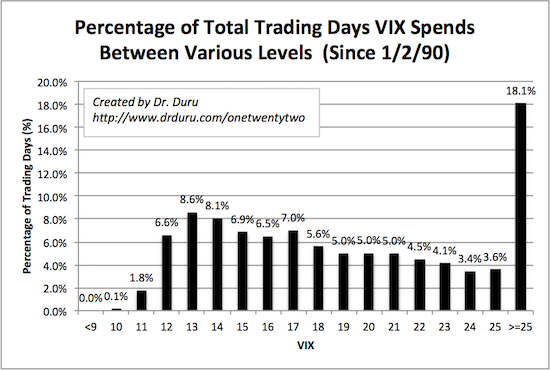
Read the x-axis as follows…Since January 2, 1990, the VIX has spent 1.8% of its trading days between 10 (inclusive) and 11 (exclusive). Over this time, the VIX has spent 18.1% of its trading days at or above 25. Flipped around, the VIX has spent 82.9% of its trading days below 25. This makes me think that conventional wisdom should consider the VIX elevated at 25 and not 20 (based on the famous 80/20 rule). The VIX has only spent 61.2% of its trading days below 20.
Finally, you can review the data and its analysis by clicking here to download the Excel spreadsheet.
====
My analysis was inspired by three posts. The first inspiration was a Yahoo finance article titled “What everyone gets wrong about the ‘fear index’.” The article cited research from Citi which came to the following conclusion about trying to predict market behavior from the VIX:
“Widely available indicators provide little investment ‘edge’ even if the consensus narrative is overly focused on this volatility metric despite its poor predictive power. Indeed, the S&P 500 has been higher 84%-88% of the time 12 months later when VIX readings were between 10 and 20 or between 30 and 40; hence, low or high VIX levels are not nearly as useful as advertised.”
I took some exception to this perspective because it took a short-term measure, the VIX, and tried to predict market behavior well beyond the short-term. I am not surprised by the inconclusive results. Moreover, with the S&P 500 now at all-time highs, we already know that measured from many points in time, the S&P 500 is likely to be higher 12 months out. For example, the S&P 500 has closed out years on a positive note 73% of the time since 1951.
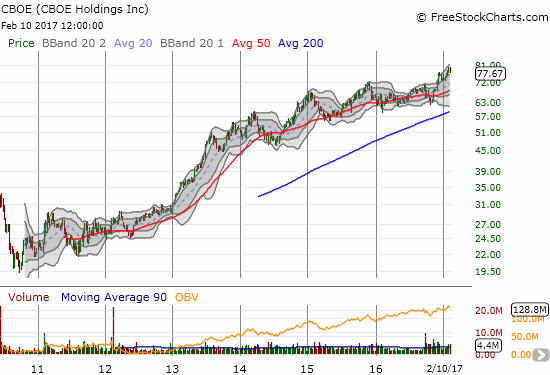
The second inspiration came from a Barron’s article titled “Where Has the Stock Market’s Volatility Gone?.” The article points out the baffling contrast between political volatility in the U.S. and abroad and the absolute calm in the stock market. The article argues that betting on or against the VIX is less interesting than betting on the company that profits from trades on the VIX: CBOE Holdings (CBOE).
Source: FreeStockCharts.com
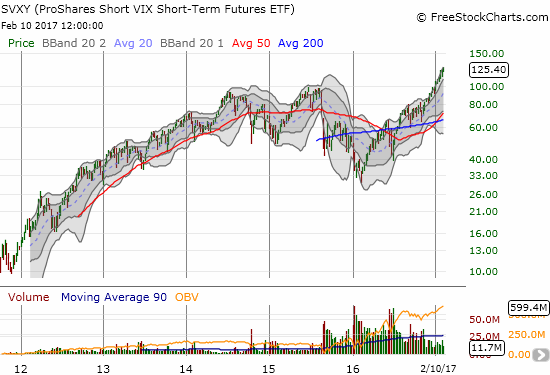
Interestingly enough, betting AGAINST volatility has been one of the biggest winners of this post-recession period although after 2014 that bet got incredibly more risky (some very big drawdowns).
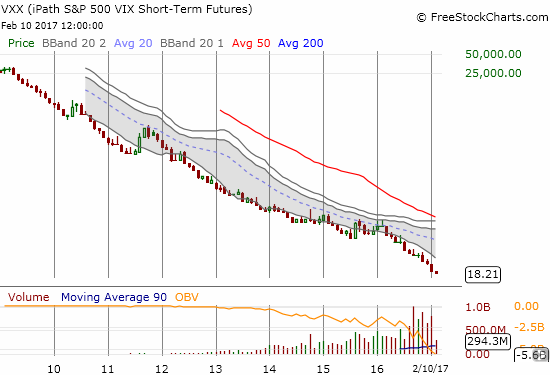
Source: FreeStockCharts.com
The third inspiration came from a post on StockTwits showing the high likelihood of a bounce in the VIX after the high of the day drops below 11. These are good data for short-term trading on the VIX but not for betting on a significant decline in the S&P 500 in the near-term.
Click for a larger view…
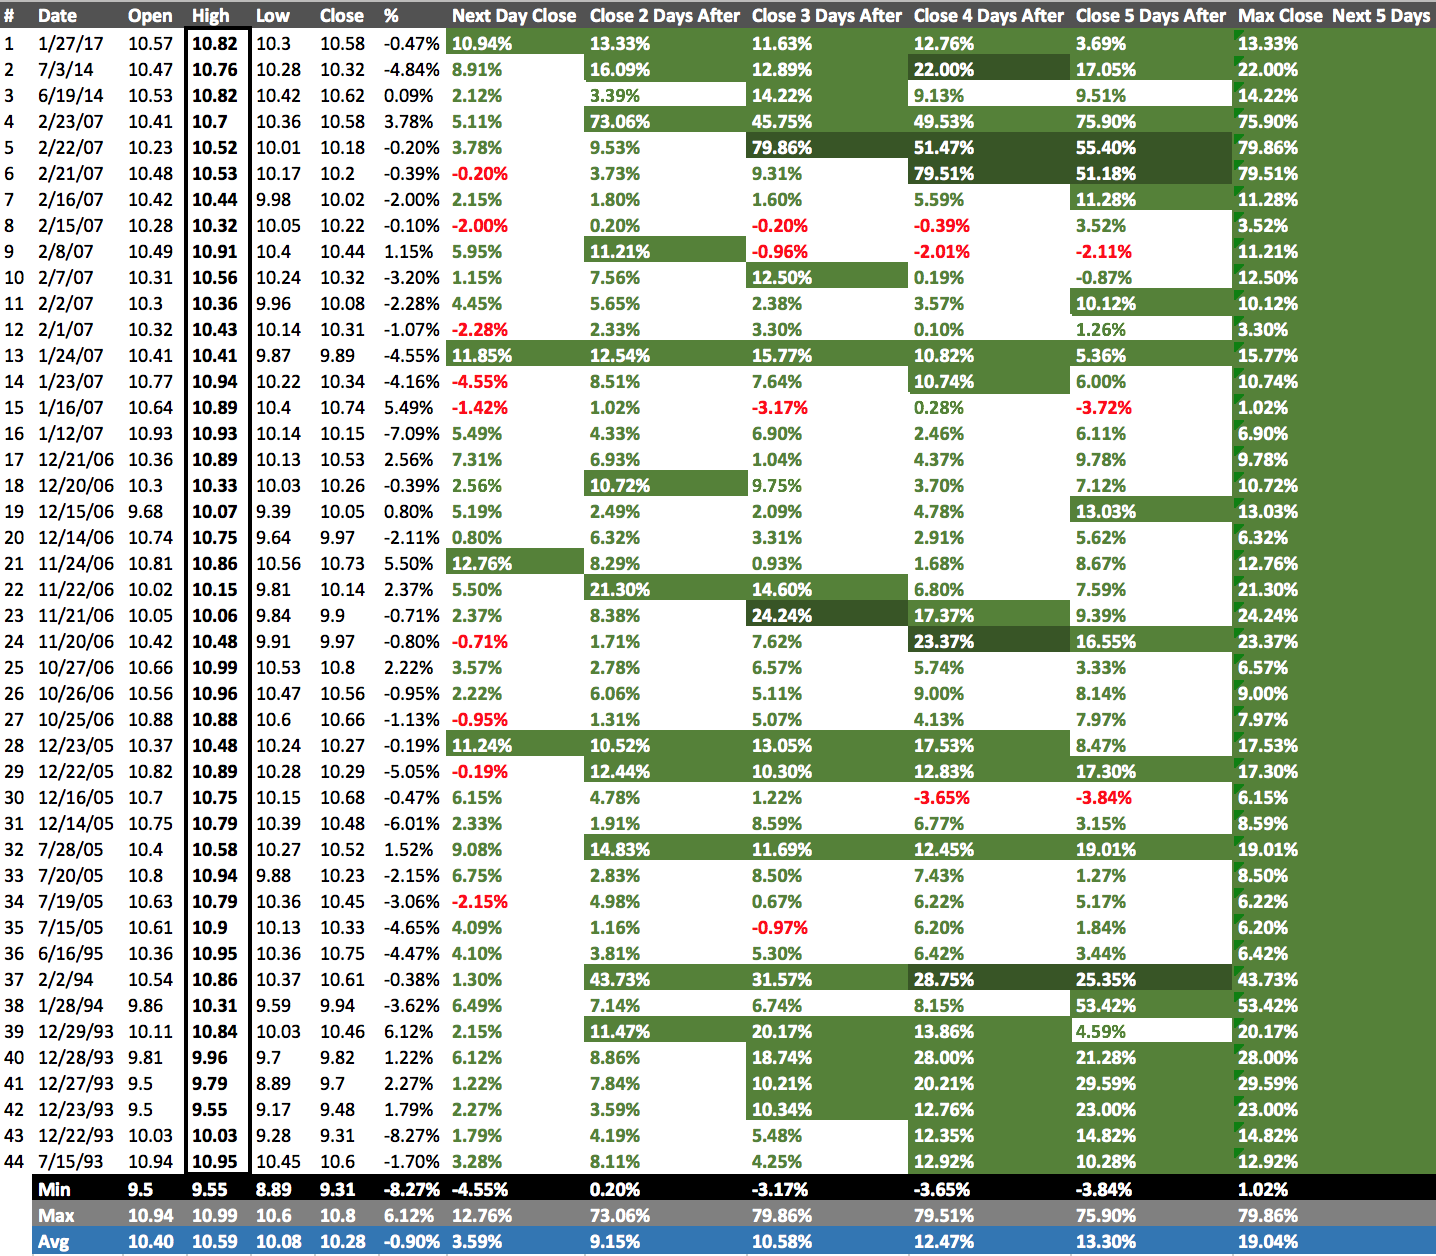
Source: StockTwits
Source: FreeStockCharts.com
Be careful out there!
Full disclosure: no positions
Great analysis on low volatility. Very insightful! Looking forward for more! Thank you!
Thanks for the kudos and thanks for reading! You can subscribe to this blog and get emailed whenever I publish a new post….