
AT40 = 50.3% of stocks are trading above their respective 40-day moving averages (DMAs)
AT200 = 63.3% of stocks are trading above their respective 200DMAs
VIX = 11.3 (volatility index)
Short-term Trading Call: neutral
Commentary
After the U.S. Federal Reserve hiked interest rates, the market’s expectations on future rate hikes relaxed a bit. That relaxation prevented financials from getting the expected rate hike boost. That under-performance continued on Friday, March 17 as the Financial Select Sector SPDR Fund (XLF) fell almost 1% while the S&P 500 (SPY) trickled down by 0.2%.
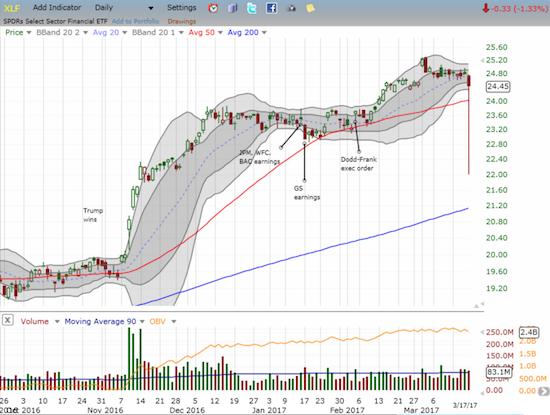
(I assume the long tail on XLF is a reporting error)
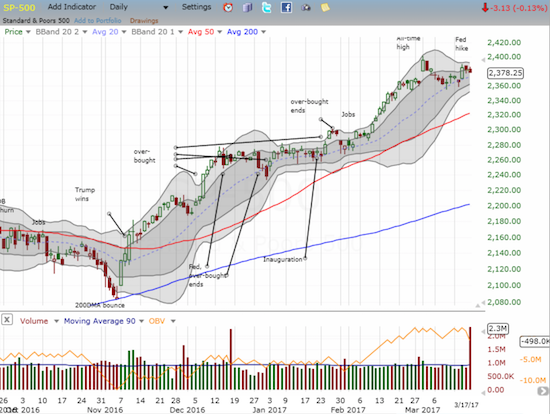
For 2017, the S&P 500 (SPY) has experienced just THREE periods of multi-day pullbacks. Two of those three have occurred this month. The other period was the longest of the year: a shallow 4-day pullback that brought an end to the last over-bought period. Instead of licking my chops in preparation for a long overdue confirmation of the deterioration of the underlying technicals of the stock market, I was taken aback by AT40 (T2108), the percentage of stocks trading above their respective 40-day moving averages (DMAs). AT40 bounced off its intraday low to end the day with a marginal gain; the rebound was quite a surprise given the weakness in financials. This (very) mild bullish divergence gives me pause, so I will now look to see whether the S&P 500 follows-through next week from its (very) mild post-Fed swoon.
AT40 has now traded for 271 straight days above oversold conditions (AT40 above 20%). My favorite technical indicator just missed oversold conditions ahead of the U.S. Presidential election, but its bounce from there helped form the basis of my post-Trump bullishness. The S&P 500 has gained 27.5% since ending oversold conditions on February 12, 2016 as part of the “J.P. Morgan Chase bottom.” This performance is a few percentage points above what I would expect if the “20% overperiod” ended here.
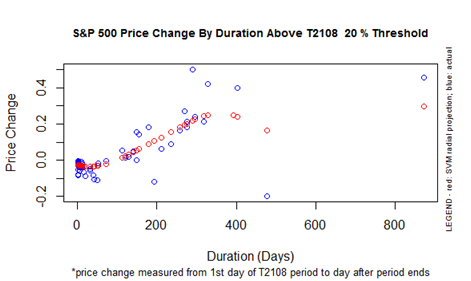
The chart below shows the history of the 20% overperiod. Note that the duration of the current 20% overperiod is in VERY rare territory. Yet, the duration could extend for more than another 100 trading days before I would call a market top just based on the duration alone. In the meantime, I am noting that the chart below suggests that a sell-off back to oversold conditions would not cause a particularly large percentage drop in the S&P 500. Some of that behavior was on display when AT40 dropped as low as 36.5% on March 14th while the S&P 500 continued its reluctant swoon. The index ended that day just 1.3% off its all-time high. Note well that these data do not indicate how much additional selling might occur during an oversold period.
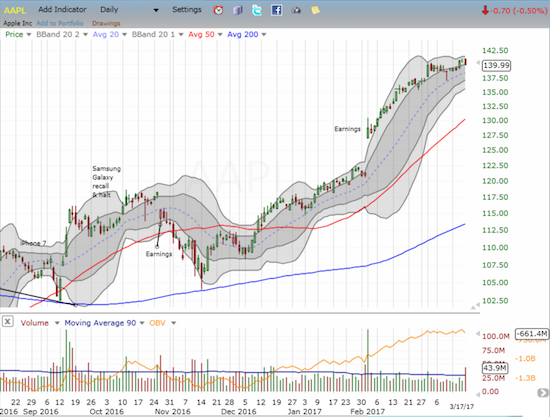
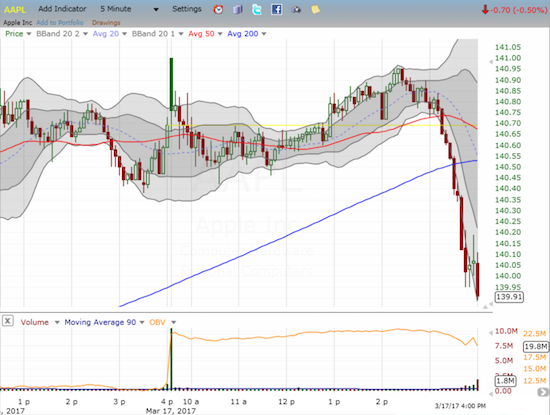
I am now 1-1 for my return to the weekly Apple (AAPL) trade. AAPL kept its price close to the vest until the post-Fed celebration. I decided to hold onto my position for one more day in the hopes the stock would follow-through. AAPL barely gained a penny, so I locked in slightly lower profits before the close. I decided to wait until Monday to reinitiate the trade. My decision may have caused me a good entry point for the next trade: AAPL strangely collapsed intraday into the close. The 90-minute sell-off accelerated in the last hour. I will have my eyes on AAPL right from Monday’s open. I assume the rush to sell into the close was somehow related to quadruple witching – the simultaneous expiration of stock and index options. If so, AAPL should experience a nice bounceback at least Monday morning.
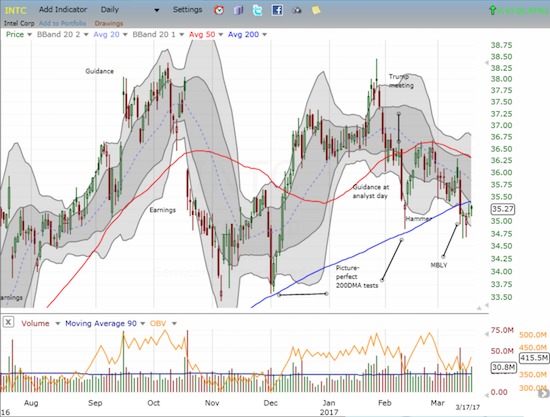
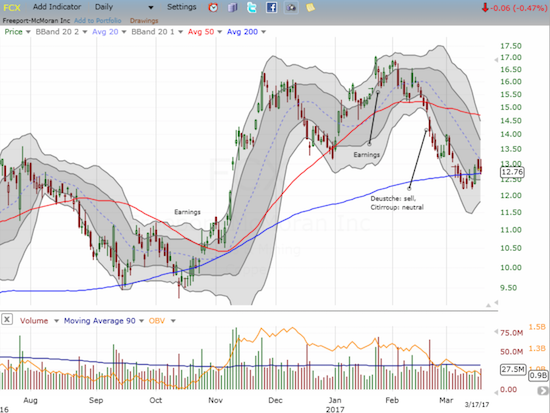
The monthly expiration of options is my time to review trades that went wrong. The most notable gaffes were Intel (INTC) and Freeport McMoran (FCX). I stubbornly reinitiated my INTC “between earnings” trade as I think the sell-off on the Mobileye N.V. (MBLY) acquisition was overdone. FCX is struggling with support at its 200DMA. I am content to wait for resolution of this battle before deciding my next move.

— – —
FOLLOW Dr. Duru’s commentary on financial markets via email, StockTwits, Twitter, and even Instagram!
“Above the 40” uses the percentage of stocks trading above their respective 40-day moving averages (DMAs) to assess the technical health of the stock market and to identify extremes in market sentiment that are likely to reverse. Abbreviated as AT40, Above the 40 is an alternative label for “T2108” which was created by Worden. Learn more about T2108 on my T2108 Resource Page. AT200, or T2107, measures the percentage of stocks trading above their respective 200DMAs.
Active AT40 (T2108) periods: Day #271 over 20%, Day #91 over 30%, Day #3 over 40%, Day #1 over 50% (overperiod ending 8 days under 50%), Day #12 under 60%, Day #43 under 70%
Daily AT40 (T2108)
")
Black line: AT40 (T2108) (% measured on the right)
Red line: Overbought threshold (70%); Blue line: Oversold threshold (20%)
Weekly AT40 (T2108)

*All charts created using freestockcharts.com unless otherwise stated
The charts above are my LATEST updates independent of the date of this given AT40 post. For my latest AT40 post click here.
Related links:
The T2108 Resource Page
You can follow real-time T2108 commentary on twitter using the #T2108 or #AT40 hashtags. T2108-related trades and other trades are occasionally posted on twitter using the #120trade hashtag.
Be careful out there!
Full disclosure: long INTC call options