
(T2108 measures the percentage of stocks trading above their respective 40-day moving averages [DMAs]. It helps to identify extremes in market sentiment that are likely to reverse. To learn more about it, see my T2108 Resource Page. You can follow real-time T2108 commentary on twitter using the #T2108 hashtag. T2108-related trades and other trades are occasionally posted on twitter using the #120trade hashtag. T2107 measures the percentage of stocks trading above their respective 200DMAs)
T2108 Status: 65.1%
T2107 Status: 66.2%
VIX Status: 11.2
General (Short-term) Trading Call: cautiously bearish
Active T2108 periods: Day #225 over 20%, Day #45 over 30%, Day #44 over 40%, Day #42 over 50%, Day #36 over 60% (overperiod), Day #5 under 70% (underperiod)
Commentary
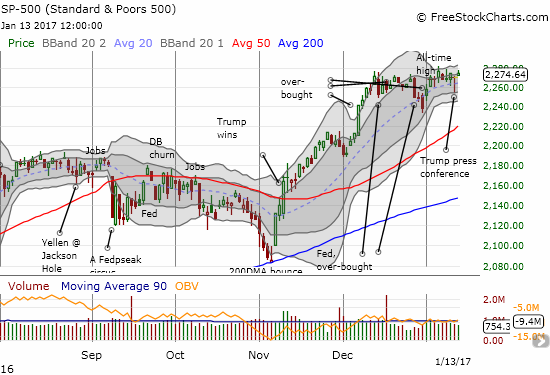
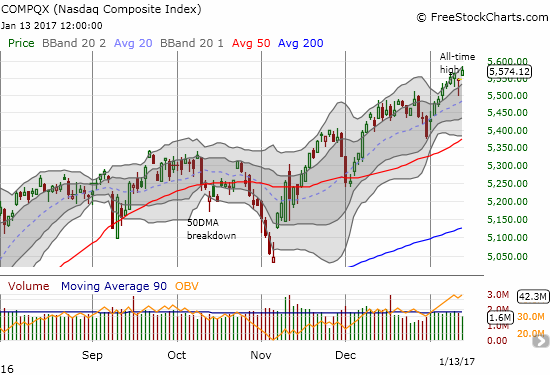
Last week began with a definitive end to the last overbought period. T2108, the percentage of stocks trading above their respective 40-day moving averages (DMAs), plunged from 70.8% to 64.0% in one day, yet the S&P 500 (SPY) lost just a fraction of a percent. The NASDAQ (QQQ) further confounded my T2108 trading rules that dictate aggressively bearish trades upon a drop out of overbought conditions by eking out out a GAIN on that day. For the rest of the week, the S&P 500 floundered just below its all-time high while the NASDAQ continued to leave the rest of the market behind by gaining 3 out of the next 4 days and hitting new all-time highs.
Thursday, January 11th was the second most interesting day of the week. President-elect Donald Trump held his first “wide-ranging” press conference in 167 days. Apparently, expectations were riding high and were soundly disappointed. The stock market first took a dip so deep that T2108 dropped all the way to 55%, a level last seen on November 15, 2016. However by the close, traders regathered their wits and returned to the regularly scheduled programming. The S&P 500 closed almost where it opened, and the NASDAQ closed a little higher than its open. Both indices printed marginal gains to end the topsy turvy week.
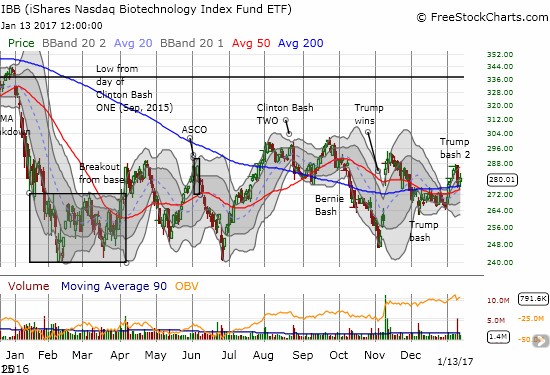
Trump’s reiteration of his desire to go after high drug prices sent the iShares Nasdaq Biotechnology (IBB) reeling for a second “Trump bash.” IBB recovered quickly from the first Trump bash. This second swoon stopped right at 200DMA support with a 2-day bounce to confirm a rapid halt to the selling. The next battle lines are well-drawn between the high and lows of the day.
“I think a lot of industries are going to be coming back. We have to get our drug industry coming back. Our drug industry has been disastrous. They’re leaving left and right. They supply our drugs, but they don’t make them here. To a large extent. And the other thing we have to do is create new bidding procedures for the drug industry because they’re getting away with murder.
Pharma, pharma has a lot of lobbies, a lot of lobbyists and a lot of power. And there’s very little bidding on drugs. We’re the largest buyer of drugs in the world, and yet we don’t bid properly. And we’re going to start bidding and we’re going to save billions of dollars over a period of time.” – President-elect Donald Trump, January 11, 2017
Thursday’s dip fooled me into thinking the market was confirming bearish trading conditions. Fortunately, the dip reversed so quickly that I did not have much of a chance to accumulate a lot of wrong-way trades. The return to regularly scheduled trading also means I go back to mainly waiting for some confirmation of the market’s next direction. I am still biased toward a downward move. My short-term trading call remains at cautiously bearish given T2108 recently dropped below over-bought conditions, and the S&P 500 has failed to break out to new all-time highs.
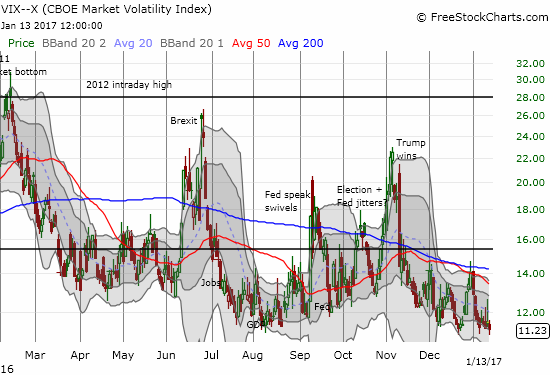
The volatility index, the VIX, ended the week sitting on its recent lows. Traders did try to goad the VIX higher on Wednesday and Thursday but to no avail. Complacency is simply too heavy right now.
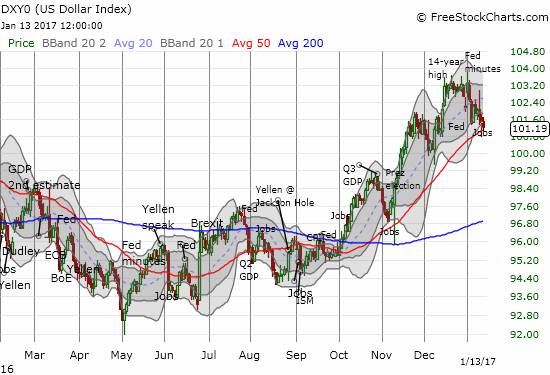
With the S&P 500 generally going nowhere, the lion share of my focus sat in forex (foreign exchange). The Turkish lira dominated the headlines; I wrote two articles on the dramatic moves in the currency. The U.S. dollar index (DXY0) resumed the selling from the previous week that took the index off its 14-year high. Suddenly, the U.S. dollar index is testing support at its 50DMA. Such a test has not happened since the election; the 50DMA has guided the U.S. dollar higher since early October.
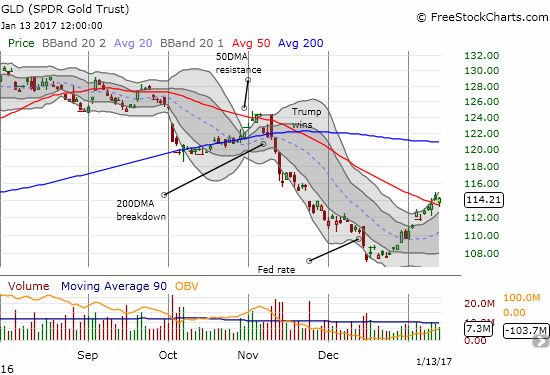
Gold runs alongside forex. Looking backward, I see now that the SPDR Gold Shares (GLD) quietly carved out a bottom after the U.S. Federal Reserve hiked interest rates last month. Suddenly, a repeat of the response to 2015’s rate hike seems possible. GLD is already trading well above where it opened just ahead of the Fed. GLD’s 20DMA turned upward this month, and GLD printed a 50DMA breakout last week. A new high above the 50DMA will confirm the breakout and get me interested in making fresh short-term trades to the long side on GLD. Granted, this bottoming process perplexes me a bit. I interpreted the rise in gold after 2015’s rate hike as indicative of market fears that the Fed’s planned hikes for 2016 would crush the economy and lead to looser monetary policy all over again. This time around, 11-year high consumer sentiment, bullish stock market sentiment, and expectations for a robust Trumpflation economy all seem to work against the knee-jerk fears that come with a rate hike cycle. I admit that the chorus of bullishness seems strange given Wall Street supposedly prefers a divided government that gets little done, but I am content to follow the technicals…
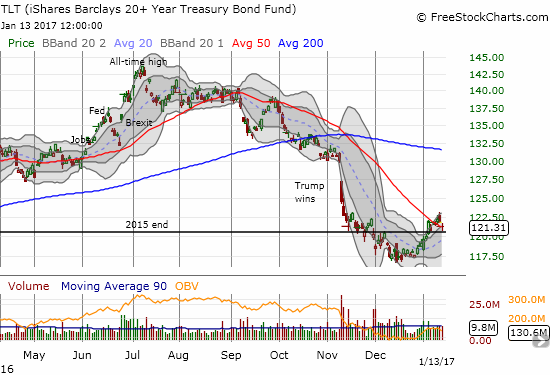
Interest rates have followed the U.S. dollar lower, and iShares 20+ Year Treasury Bond (TLT) has followed gold higher. A pairs trade between call options on a gold-related play and put options on TLT looks very attractive. I think dramatic moves in both are bound to occur in coming weeks or months as the Trump administration and Congress cooperate on launching an aggressive agenda.
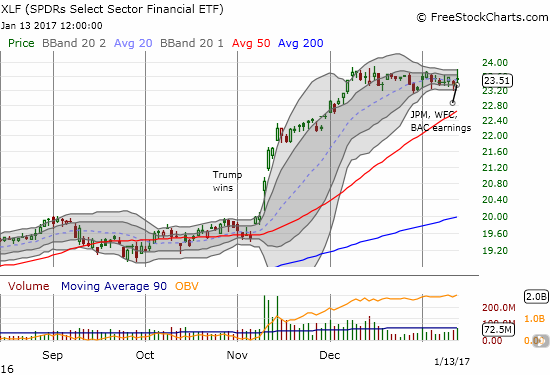
Earnings season is in full swing and bank earnings were in full focus on Friday. I was hoping these earnings would spark a definitive resolution to a near 5-week long consolidation period. The Financial Select Sector SPDR ETF (XLF) managed to race out the gate toward the top of the recent range. However, over the course of the day, XLF waned and fell right back into the middle of the muck. XLF is the poster child for the grinding waiting game that almost all but the NASDAQ are playing.
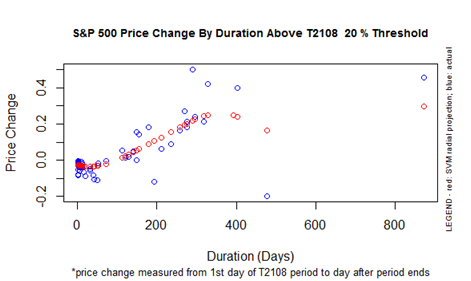
Finally, I am duly noting that T2108 has spent a LONG time trading above oversold conditions. The election came close to sealing the deal but instead the market rallied before T2108 took that one last step into oversold territory. So now T2108 has spent 225 days trading above the oversold threshold, the 20% overperiod. On a historic basis, such a feat is unusual, but the 20% overperiod could run 300 trading days before hitting truly rarefied space. Still, the performance of the S&P 500 (SPY) over this timespan is remarkable. The S&P 500 is up 22.0% since the current 20% overperiod began. This performance is well ahead of the 15% gain the T2108 trading model predicts if the 20% overperiod ended on the next trading day. In other words, this rally is very strong. Yet, unless this 20% overperiod ends as a historically strong run-up, the inevitable return to oversold conditions will likely occur via a substantial pullback.
— – —
FOLLOW Dr. Duru’s commentary on financial markets via email, StockTwits, Twitter, and even Instagram!
Daily T2108 vs the S&P 500
")
Black line: T2108 (measured on the right); Green line: S&P 500 (for comparative purposes)
Red line: T2108 Overbought (70%); Blue line: T2108 Oversold (20%)
Weekly T2108

*All charts created using freestockcharts.com unless otherwise stated
The charts above are the my LATEST updates independent of the date of this given T2108 post. For my latest T2108 post click here.
Related links:
The T2108 Resource Page
Be careful out there!
Full disclosure: long SDS, long and short positions on the U.S. dollar, long GLD