
The last Housing Market Review covered data reported in November for October, 2016. At that time, the iShares US Home Construction (ITB) was experiencing its first post-election pullback. I stayed focused on the strong housing data and treated the episode as a buying opportunity. Over a month later, the market is still ignoring the strong housing data in favor of hand-wringing over monetary policy and slightly higher mortgage rates. Like last month, I am preparing to take advantage of a fresh buying opportunity despite the surface temptation to conclude that it is time to get bearish on the housing sector.
Since I believe the market over-reacted to the Fed’s “hawkishness” and since I believe the latest 30-day Fed Fund Futures support my assessment, I am ignoring the rate concerns as I stay focused on what should be a seasonally strong period for home builders and related stocks.
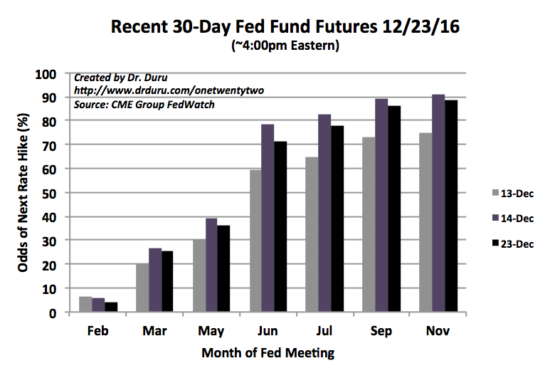
Source: CME Group FedWatch
Still, the Federal Reserve may have effectively capped housing-related trades for at least the next few months. As a result I will be as patient as possible in looking for steeper discounts on housing-related plays.
New Residential Construction (Housing Starts) – November, 2016
The downward revisions for housing starts resumed. After four straight months of downward revisions, housing starts for single-family homes received two upward revisions in a row (September and October). October’s privately owned 1-unit housing starts were revised from 869,000 units to 863,000. November starts fell 4.1% month-over-month but increased 5.1% year-over-year to 828,000. The modest monthly pullback is of little concern since single-family starts achieved a new post-recession high in October.
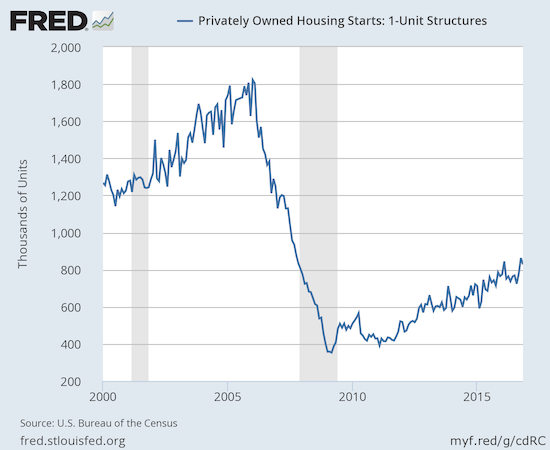
Source: US. Bureau of the Census, Privately Owned Housing Starts: 1-Unit Structures [HOUST1F], retrieved from FRED, Federal Reserve Bank of St. Louis, December 27, 2016.
Starts were mixed year-over-year across the regions: the Midwest soared 33% while the Northeast suffered the largest drop at 7.6%. The West dropped 2.7%, and the South gained 2.8%. This mixed performance ends two straight months of regional unison. The Midwest was the only region to gain month-over-month.
Existing Home Sales – November, 2016
September put existing home sales back on solid footing, and October delivered validating follow-through. November took existing home sales to a new post-recession high. The numbers were enough to motivate definitive optimism from the National Association of Realtors (NAR) which has spent most of the year wary to pessimistic…
“The healthiest job market since the Great Recession and the anticipation of some buyers to close on a home before mortgage rates accurately rose from their historically low level have combined to drive sales higher in recent months…Furthermore, it’s no coincidence that home shoppers in the Northeast — where price growth has been tame all year — had the most success last month.”
The seasonally adjusted annualized sales of 5.61M were down 0.7% month-over-month from a downwardly revised 5.57M in sales for October (previously 5.6M). Year-over-year sales saw an extremely impressive gain of 15.4% to notch the highest sales level since February, 2007.
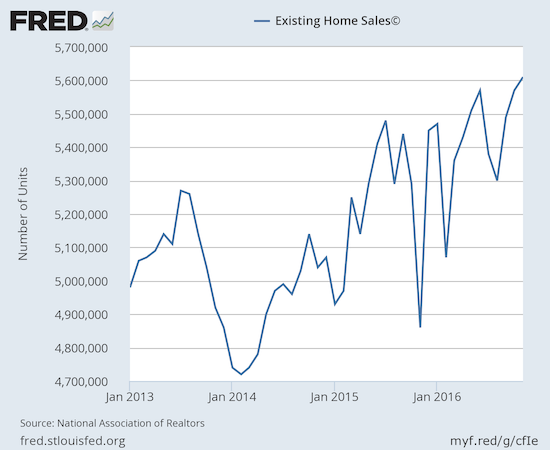
Source: National Association of Realtors, Existing Home Sales© [EXHOSLUSM495S], retrieved from FRED, Federal Reserve Bank of St. Louis, December 1, 2016.
Once again, these exceptionally strong sales results occurred even with the continuation of the on-going trends of shrinking inventory and rising median prices. The NAR complained earlier this year about these factors as impediments to the market. In the last Housing Market Review, I marveled that the NAR explained strong sales as the release of pent-up demand from tight inventory. I wondered instead whether anticipation of higher mortgage rates played a role. THIS month, the NAR pulled the rate card as noted in the quote above.
I continue to believe the data demonstrate underlying fundamental strength in demand even as inventory, price, and now rate headwinds loom. Rising prices and tightening inventory are symptoms of strong demand and housing starts are still lagging previous recovery cycles. Even first-time home buyers rebounded in 2016 with 35% of sales going to first-timers versus 32% last year and 38% in 2013.
In August, inventory cratered 10.1% year-over-year. In September it dropped 6.8% year-over-year. In October, inventory declined 4.3%. For November, inventory plunged 9.3% year-over-year to 2.04M homes. Inventory has declined year-over-year for 18 straight months. Months of inventory marginally decreased from 4.3 to 4.0 months of supply.
Investors retreated slightly again as a share of sales. In October that share dropped from 14% to 13% which was the same share in August. For November, investor share of sales dropped to 12%. The share was 11% in July. As context, recall July’s share was the lowest share since 9% in July, 2009. In February, investors bought 18% of existing homes which was the highest share since April, 2014.
In May and June, the West was the only region in the country to experience year-over-year drops in existing home sales. In July, every region suffered year-over-year declines. In August, no region experienced a year-over-year decline. In September, the South was the only region to experience a year-over-year decline. For October, sales were so strong that every region experienced year-over-year gains. November’s strong sales also produced broad and impressive regional strength: Northeast 15.7%, Midwest 18.8%, South 11.6%, West 19.0%.
November’s 6.8% year-over-year increase in the median price of an existing home represents the 57th consecutive month of year-over-year increases. The median price of $234,900 is below the all-time record of $247,700 set in June.
Single-family home sales yet again fared similarly to overall existing sales. Single-family sales declined slightly on a monthly basis (0.4%) and surged on a yearly basis (16.2%). The median price of $236,500 increased from October’s $233,700 and jumped 6.8% year-over-year.
“Single-family home sales declined 0.4 percent to a seasonally adjusted annual rate of 4.95 million in November from 4.97 million in October, but are still 16.2 percent above the 4.26 million pace a year ago. The median existing single-family home price was $236,500 in November, up 6.8 percent from November 2015.”
New Residential Sales – November, 2016
New home sales were the big headline in August as July sales soared to a fresh post-recession high. I predicted that post-recession peak would not get challenged until the next Spring selling season. That assessment remains well intact.
New single-family home sales hit 592,000 for November, marking an increase of 5.2% from October’s 563,000 sales (flat with the originally reported level). Sales increased 16.5% year-over-year which maintains a torrid sequence: October was up 17.8%, September was up 24.9% year-over-year, August was up 10.7% year-over-year, July was up 24.9% year-over-year, and June was up 18.2% year-over-year (all measured using the current revisions).
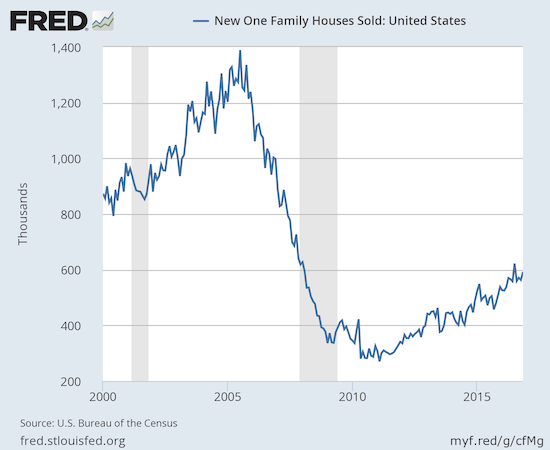
Source: US. Bureau of the Census, New One Family Houses Sold: United States [HSN1F], retrieved from FRED, Federal Reserve Bank of St. Louis, January 1, 2017.
New home inventory declined marginally from 5.2 to 5.1 months of supply.
New home sales surged in all regions. The Northeast and the Midwest were above average with year-over-year increases of 22.2% and 39.4% respectively. The Southeast increased 13.8%. The West returned to laggard (relative) status with a 10.3% year-over-year gain.
Home Builder Confidence: The Housing Market Index– November, 2016
Perhaps the most impressive data point of all was the Housing Market Index. Home builders and consumers shared in a surge of confidence in December that SHOULD augur well for economic activity going into the first part of 2017…which of course includes the Spring selling season.
The Housing Market Index (HMI) started the year at 61 and then sat four straight months at 58. In June, the HMI came to life again with a jump to 60 but dropped back to 58 for July. For August, the HMI was revised downward from 60 to 59 which made September’s 65 reading and post-recession high look like an even stronger jump. October dipped to 63, and I claimed at the time it was no cause for concern. For November, the HMI stabilized at 63. HMI closed out the year with a December surge to 70. This level was not only the high of the year, but also it is the highest level since July, 2005. Given that level is around the peak of the last bull housing cycle, I am not expecting confidence to get much higher in the short-term unless the next Spring selling cycle somehow manages to deliver new catalysts.
The National Association of Home Builders (NAHB) implied last month that the HMI might drop in the wake of the election. Now, the election gets credit for a surge:
“This notable rise in builder sentiment is largely attributable to a post-election bounce, as builders are hopeful that President-elect Trump will follow through on his pledge to cut burdensome regulations that are harming small businesses and housing affordability…This is particularly important, given that a recent NAHB study shows that regulatory costs for home building have increased 29 percent in the past five years.”
All three components of the HMI surged in concert in an impressive confirmation of broadly strong home builder sentiment.
Click for a larger view…
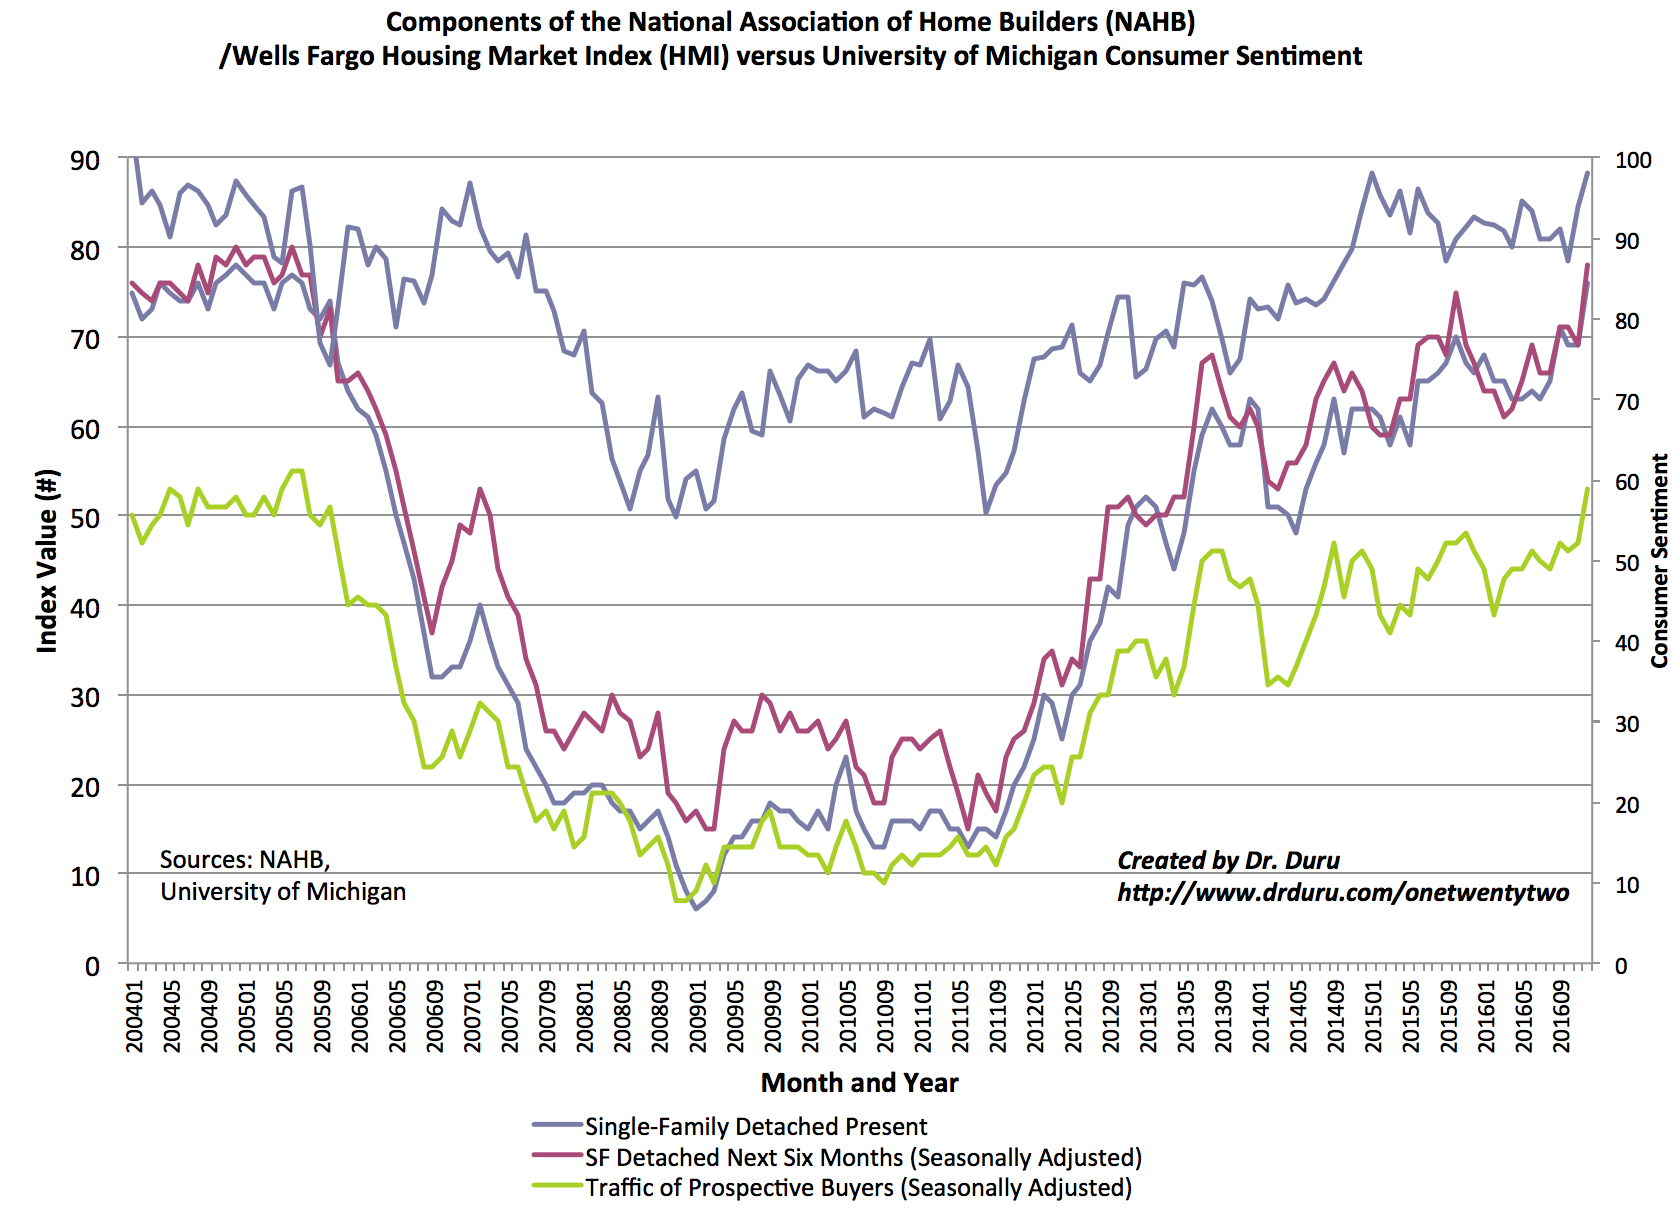
Source: The National Association of Home Builders (NAHB)
Every region saw surges in home builder confidence. The Northeast experienced the largest percentage gain as it jumped 26% from 47 to 59. The Midwest and the West came in next with 12% and 13% respectively. The South increased by 8%.
Parting thoughts
The housing data still look as good as ever in this post-recession period. As I have stated in previous pieces, I am now in buying mode to play the seasonally strong period for housing stocks. My second such trade filled in the middle of last week’s selling as the iShares US Home Construction (ITB) tested support at its 200-day moving average (DMA). I am now once again holding a handful of call options on iShares US Home Construction (ITB) even as my short-term outlook on the stock market is cautiously bearish. Per my on-going strategy for housing-related stocks, I am treating sell-offs as buying opportunities. I suspect more buying opportunities will appear in the coming month or two as interest rate concerns weigh on investor interest in this sector.
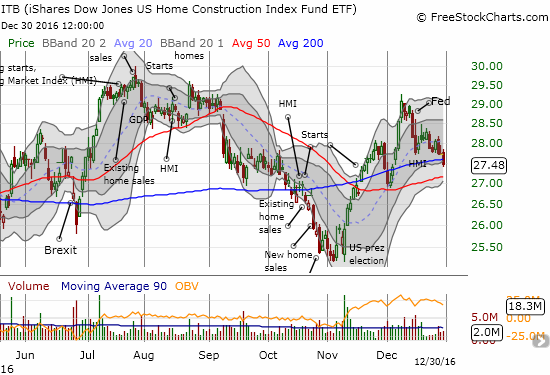
I earlier lamented how post-election market optimism subverted my plan to start buying home builders at discounts. The Federal Reserve put my plan right back in action. The above chart shows how the Federal Reserve’s latest pronouncement on monetary policy delivered an abrupt end to ITB’s rally, a rally that sharpened after a successful test of 50DMA support. In my last Housing Market Review, I discussed my first trade on the seasonally strong period for home builders. ITB bounced back so sharply from there that I was compelled to lock in the profits. So, my latest trade is a restart of my plan to accumulate housing positions.
I temporarily removed LGI Homes (LGIH) from my buy list given its breakdown below 200DMA support. This drop also confirms a bearish “wedge” pattern loosely defined by LGIH’s 50 and 200DMAs. Tri Pointe Group (TPH) broke down below 50DMA support, so now I wait to see whether I can get an entry on a retest of the November lows. Century Communities (CCS) remains remarkably resilient. The stock is still trading above 50DMA support and is not far from a 15-month high. Still, Meritage Homes (MTH) stays at the top of my interest list. I am closely watching the stock as it sold off right to 50DMA support to close 2016.
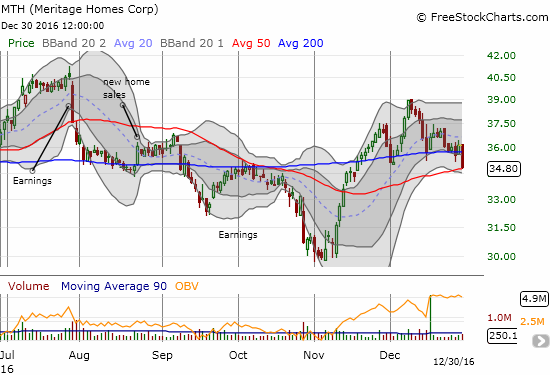
Source: FreeStockCharts.com
Stay tuned for additional trade ideas as the housing sector will likely experience extra volatility from all sides in the coming months: political, economic, fiscal, and monetary. Regardless of how things bounce, I plan to be fully positioned by the beginning of the Spring selling season (roughly late February to early March).
Be careful out there!
Full disclosure: long TPH, long ITB call options