
(T2108 measures the percentage of stocks trading above their respective 40-day moving averages [DMAs]. It helps to identify extremes in market sentiment that are likely to reverse. To learn more about it, see my T2108 Resource Page. You can follow real-time T2108 commentary on twitter using the #T2108 hashtag. T2108-related trades and other trades are occasionally posted on twitter using the #120trade hashtag. T2107 measures the percentage of stocks trading above their respective 200DMAs)
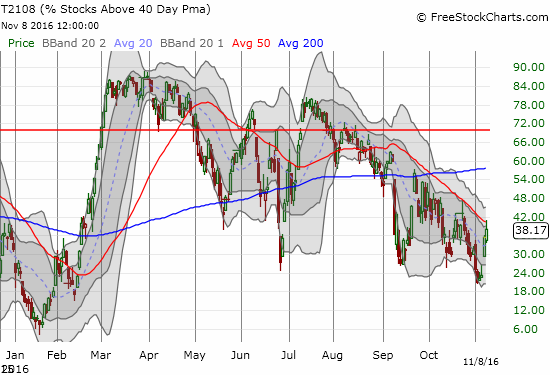
T2108 Status: 38.2%
T2107 Status: 52.9%
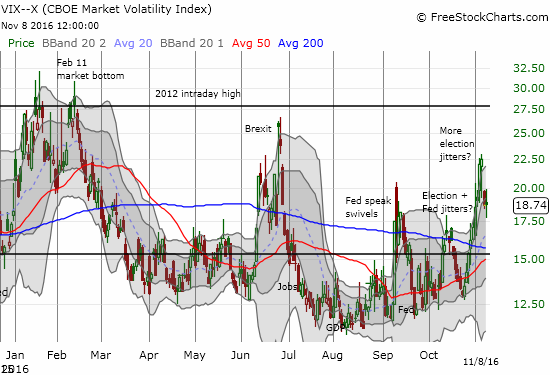
VIX Status: 18.7
General (Short-term) Trading Call: bullish
Active T2108 periods: Day #182 over 20%, Day #2 over 30% (overperiod), Day #13 under 40%, Day #30 under 50%, Day #45 under 60%, Day #71 under 70%
Commentary
The relief rally continued today and once again put on a picture-perfect performance that is hard to make up. Over the last two days, the S&P 500 (SPY) achieved a bracketed rally: the index from a dead stop on Friday at support at its 200-day moving average (DMA) to a dead stop today at resistance at its 50DMA.
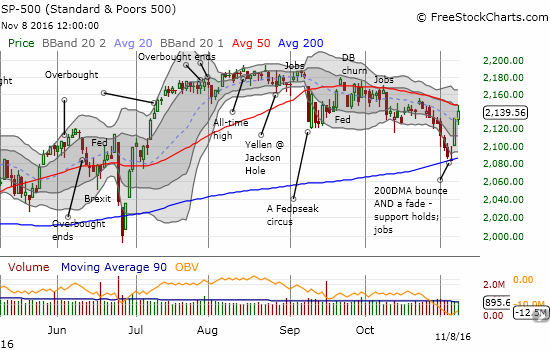
The S&P 500 now faces a very critical test. The index has stayed mostly trapped below 50DMA resistance since the big support breakdown in early September.
T2108, the percentage of stocks trading above their respective 40DMAs, did its own dance with 50DMA resistance. Accordingly, a major downtrend in my favorite technical indicator now faces a major test.
These are ominous tests of resistance given they occurred on the eve of results of the contentious U.S. Presidential election. The volatility index, the VIX, added to the suspense: although the stock market rallied for the day, the VIX stayed exactly flat and well above the 15.35 pivot line. This positioning means the VIX remains poised to soar at the slightest provocation.
Despite the ominous set-up, I am leaving the short-term trading call at bullish. I am poised to buy the dips, including any post-election sell-off. Still, I sold a handful of positions that I bought to play the “almost oversold” trading conditions I discussed is earlier posts. Most importantly, I locked in profits on call options for Facebook (FB), Apple (AAPL), and Freeport-McMoran (FCX). I kept the call spread on Amazon.com.
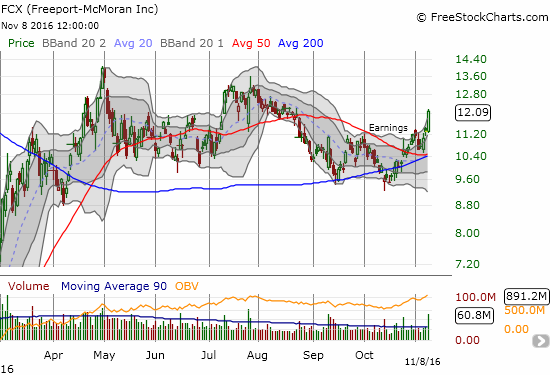
Copper has been on a tear recently: a 12-day rally and a new 52-week high. This rally was another element of the bullish divergence in recent days that I actually missed. Now, I daresay copper, and FCX in particular, are getting over-extended given the overall global economic environment. Still, FCX is in breakout mode, so I am prepared to buy the dips as long as 50 and 200DMA support hold.
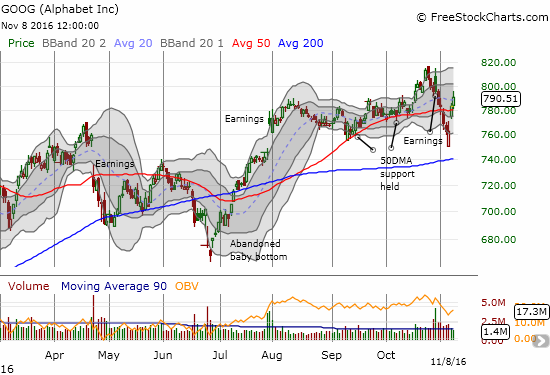
The one market darling I failed to buy ahead of this rally was Alphabet (GOOG). Ironically, it is the one of the darlings that recovered from a recent breakdown.
Now……having said all this, I am typing as early elections results are indicating that, at a minimum, a Hillary Clinton victory for U.S. President will be a LOT closer than anyone with a poll imagined. (At some point, the polling industry will have to be called so much voodoo?). Asian stock markets have sold off heavily, and futures in the U.S. are dumping. My favorite currency indicator of sentiment in financial markets says it all. The Australian dollar (FXA) is cratering against the Japanese yen (FXY). Suddenly, the 200DMA for AUD/JPY looks like resistance all over again.
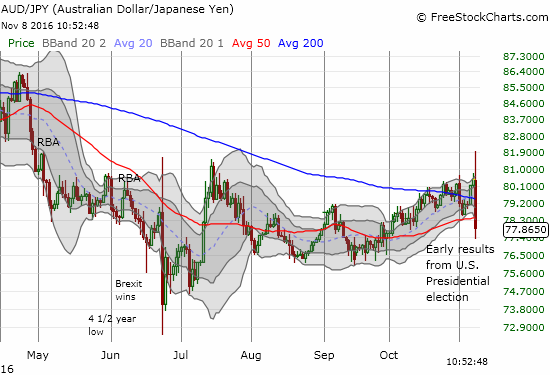
With the market seemingly anticipating a Trump win, and AUD/JPY trading well below its lower-BB, I decided to take profits. These gains are small solace relative to the thumping my long dollar positions are taking!
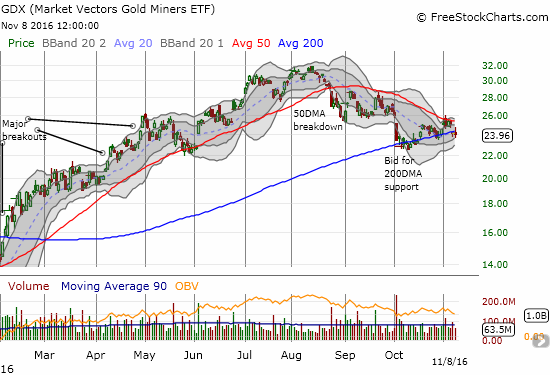
Per my strategy that I have discussed on precious metals, I did start loading up on call options on VanEck Vectors Gold Miners ETF (GDX) as it retested 200DMA support on Monday. Maybe that position will at least see gains tomorrow.
As I said in the last T2108 Update, it is time to brace for surprises. Traders should step cautiously and take the action one day, one step at a time.
— – —
FOLLOW Dr. Duru’s commentary on financial markets via email, StockTwits, Twitter, and even Instagram!
Daily T2108 vs the S&P 500
")
Black line: T2108 (measured on the right); Green line: S&P 500 (for comparative purposes)
Red line: T2108 Overbought (70%); Blue line: T2108 Oversold (20%)
Weekly T2108

*All charts created using freestockcharts.com unless otherwise stated
The charts above are the my LATEST updates independent of the date of this given T2108 post. For my latest T2108 post click here.
Related links:
The T2108 Resource Page
Be careful out there!
Full disclosure: long UVXY shares and short UVXY call, long AMZN call spread, long GDX call options, net long the U.S. dollar