
Desperate times bring out the creativity.
On Thursday, January 12, the Central Bank of the Republic of Turkey (CBRT) effectively tightened monetary policy by canceling its weekly auction used to fund banks. On top of this move, Turkey’s President, Recep Tayyip Erdogan, likened Turkey’s forex predicament to a fight against economic terrorism. Deutsche Bank (DB) emphatically refuted related claims made by a Turkish newspaper. This rhetoric apparently raised the specter of more and greater government intervention to support the lira. Combined, these events sparked a 2-day rally for the lira and its stock market to close the week.
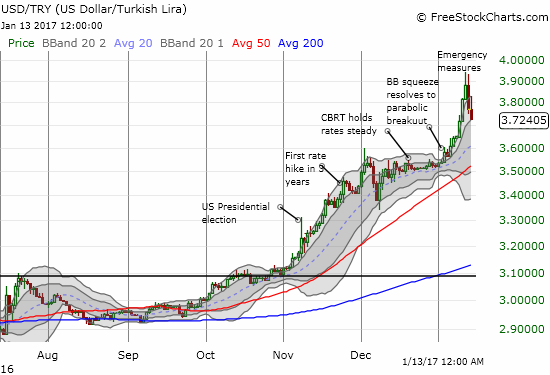
In my last post on the lira drama, I warned: “The recent three-day run up is the classic definition of a parabolic move, so I fully expect a notable pullback. If nothing else, it makes sense for longs to book substantial profits ahead of the next CBRT meeting.” My post came in the immediate wake of the first emergency measures of the week which speculators clearly fought. Given the robustness of the fight, I fully acknowledged that it made sense to step aside from fading USD/TRY until sellers reversed the last breakout. At that time, the key level was 3.82. As the USD/TRY continued to rally, that key level rose. Buyers launched the next breakout from 3.88 and a subsequent rebound from 3.88 before USD/TRY finally topped out.
The remaining fight was short-lived. Parabolic moves are built for implosion. Parabolic runs create panic buying, suck in trend-followers, and exhaust buyers. Most importantly for this particular case, parabolic moves motivate fundamental forces that are hurt by the pace of the change, a pace that can be extremely disruptive to economic activity and life. It is no accident that Turkey’s central bank is now trying to ramp up its creativity in a desperate attempt to defend the currency.
With the fade underway, the daily chart once again becomes more important than the intraday chart. Note on the daily chart above that USD/TRY sits neatly on the bottom of the uptrend channel defined by the upper-Bollinger Bands (BBs). This is the current key level of support. If buyers fail to defend this support, the primary uptrend on USD/TRY will end. The uptrending 20-day moving average (DMA) would then become the next line of (daily) support. I think this line of support is in play because the looming prospects of more intervention going into or during the January 24th CBRT meeting present huge risks for lira holders on top of the high yield they pay for the privilege of that risk.
Source for charts: FreeStockCharts.com
El-Erian Says Buy Emerging-Market Currencies That Fell Too Much
Be careful out there!
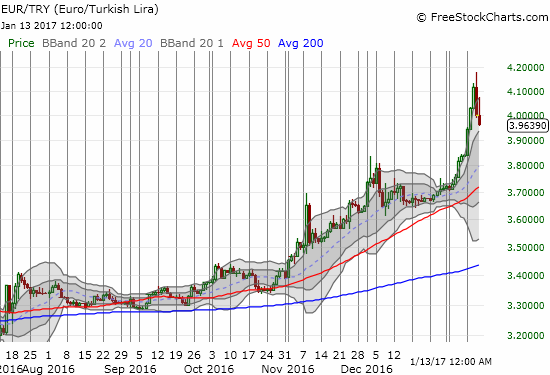
Full disclosure: short USD/TRY, long EUR/TRY (as a small hedge)
Thanks for the new analysis, Doc. When you say DMA is this the double exponential (DEMA) or displaced moving average? If the latter, what displacement do you assume?(This line is not shown on your graph). If it’s the dbl exp then it’s already been breached on the 13th.
So, can you please state the value more clearly in your verdict:
“The uptrending 20-day moving average (DMA) would then become the next line of (daily) support.”
Thanks for your insights.
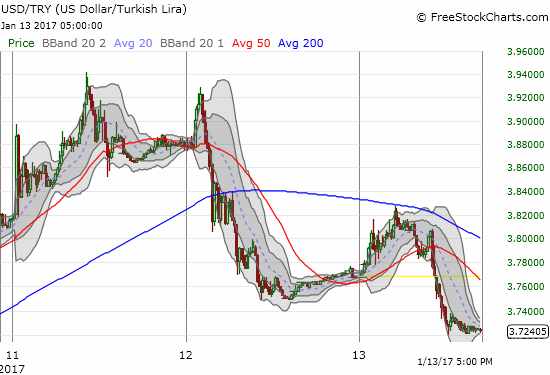
Sorry for the late response – the chart has a legend in the upper-left. The 20-day moving average (DMA) is the dashed, bluish line. This is a simple average, no displacement, exponential smoothing, or anything. Just taking the last 20 days of prices and averaging them.
As I type, USD/TRY has neatly jumped off that 20DMA support. So a lot of traders were indeed eyeing that as an attractive level of support to buy. Given the buying interest remains, I have to next anticipate USD/TRY hitting the upper part of the channel as defined by the upper-Bollinger Bands. This uptrending channel is defined by the lighter gray area.
Dear Doc, are you looking at USD/TRY lately? Now it’s down to 3.57, and the general opinion is that it will pick up from here going forward. Your opinion will be appreciated.
Funny you ask. I was JUST reading up on the Turkish lira because I can’t believe how consistently strong it has been. The lira SHOULD be weaker from here, but this could be a case of seller exhaustion as well as rates being high enough to encourage a lot more speculative buying of the lira. I am short USD/TRY right now, but thinking of covering soon. The 50DMA broke and I really should not be short here, should be long! Hopefully in another week or so, I will have something intelligent to add…