
The Market Breadth Summary
- The sharp memory-stock reversal failed to repair DRAM’s bearish breakdown or prevent broader weakness across technology and semiconductor stocks.
- The NASDAQ confirmed a 50-day moving-average breakdown, while the S&P 500 also closed below its 50-day moving average.
- The Russell 2000 remained technically stronger than the large-cap indices and preserved its bullish positioning above key support.
- Market breadth held stable and supported a cautiously bullish short-term trading call.
The Stock Market Summary
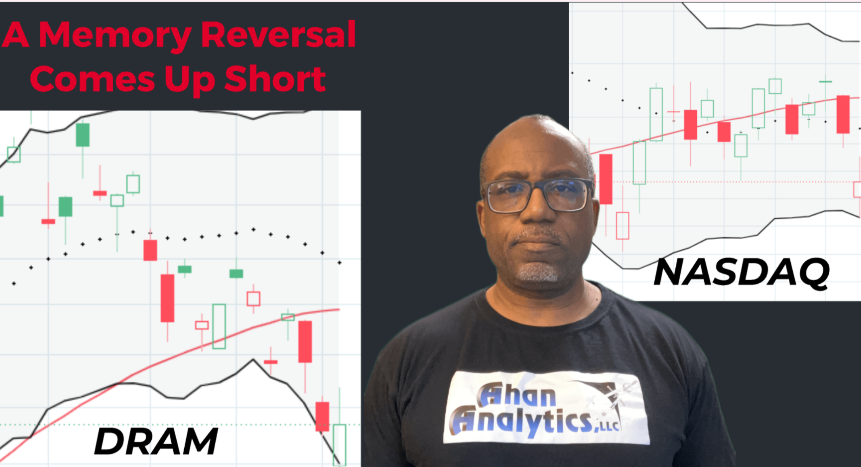
Tech weakness resurfaced last week as the AI trade continued to slowly roll over. A plunge in memory stocks featured prominently in this expanding weakness. After another deep gap down on Friday, buyers pulled off a major intraday reversal in memory stocks. However, this reversal stopped short of ending a bearish breakdown and also failed to help tech stocks generally recover from the day’s selling.
A new AI model called Kimi from Chinese tech company Moonshot seemed to weigh on sentiment Friday as the competitive threat could lower the value of companies like Anthropic and OpenAI and could also call into question the vast sums of money spent on today’s AI tech.
Interest in speculation was already waning with SpaceX becoming a busted IPO. The stock failed to hold its $135 IPO price after falling to $131.11 on Thursday and dropping 5.4% on Friday.
News from South Korea may have already dampened speculative moods. On Thursday, South Korean regulators announced a temporary halt to trading in leveraged single-stock ETFs. These speculative trading instruments caught increased attention last week after extreme volatility in SK Hynix, which recently issued ADRs in the U.S. SKHY fell 9.3% on its first day of trading followed by a 27.3% surge. Two days of selling took the stock right back to the all-time closing low. On Friday, as the DRAM reversal came up short, SKHY soared as high as 10% before settling for a 1.1% gain. I always get cautious when trading in important stocks becomes so extreme. This trading is a microcosm of the increasingly precarious trading in the AI/semi trade.
Having said all that, I remain encouraged by market breadth’s stability. For that reason alone, I avoided getting bearish on the stock market as a whole even though the S&P 500 and the NASDAQ suffered important bearish breakdowns.
S&P 500 (SPY)
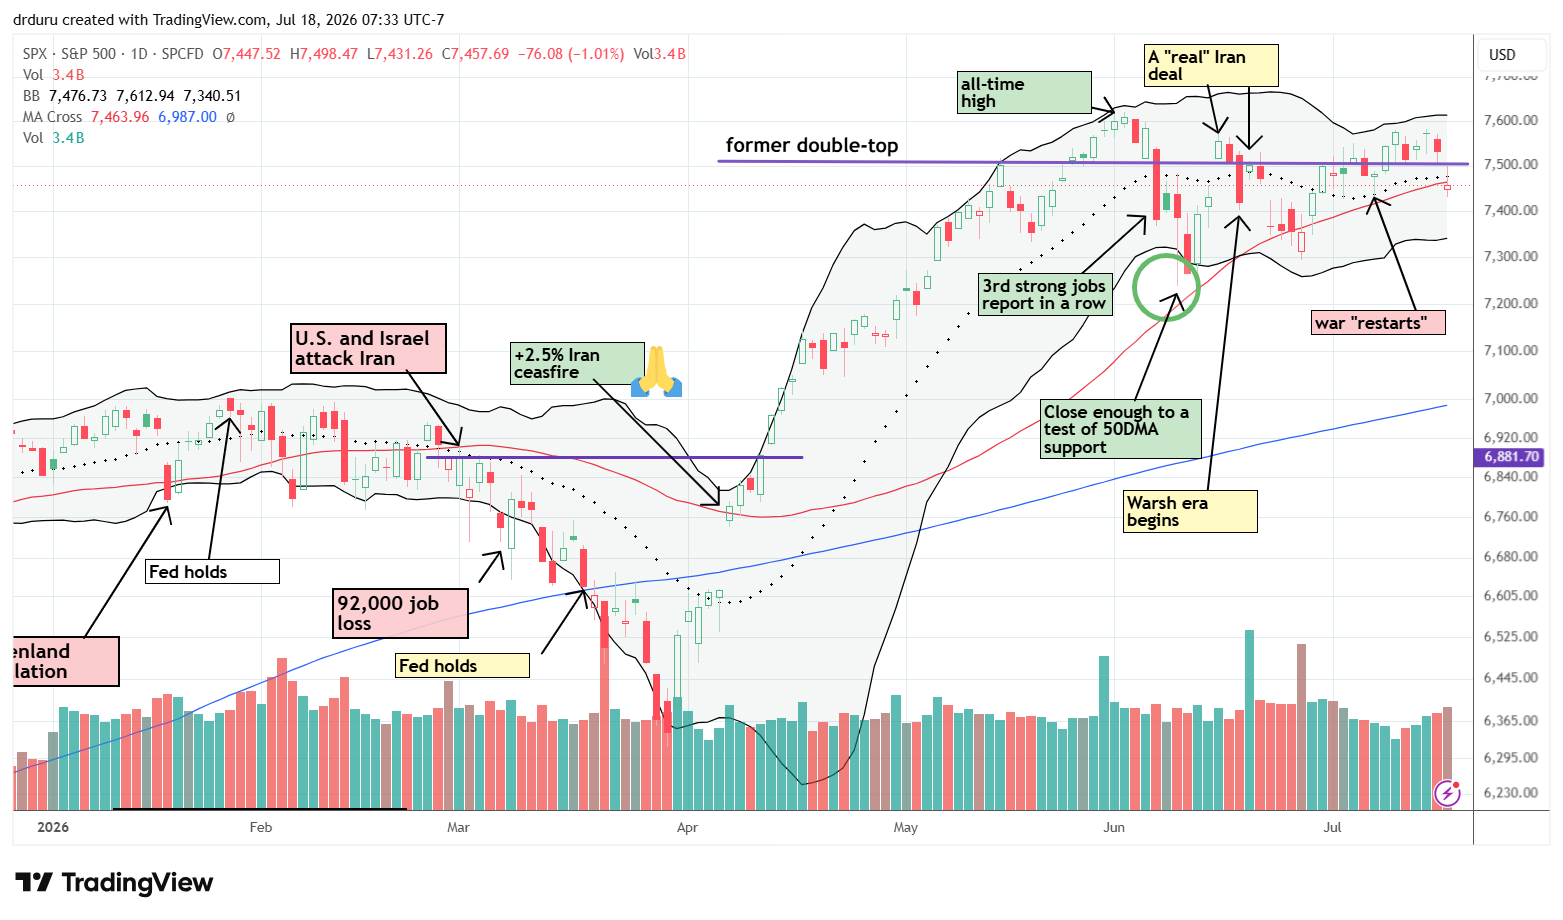
The S&P 500 (SPY) broke back below its former double-top, putting that bearish pattern back into play. More importantly, SPY also closed below its 50-day moving average (DMA) (red line). During the trading session, buyers and sellers battled across a wide intraday range, but the sellers won a rare victory. For now, I am assuming the index is getting stuck in a trading range with the June closing low at the bottom of the range.
NASDAQ (COMPQ)
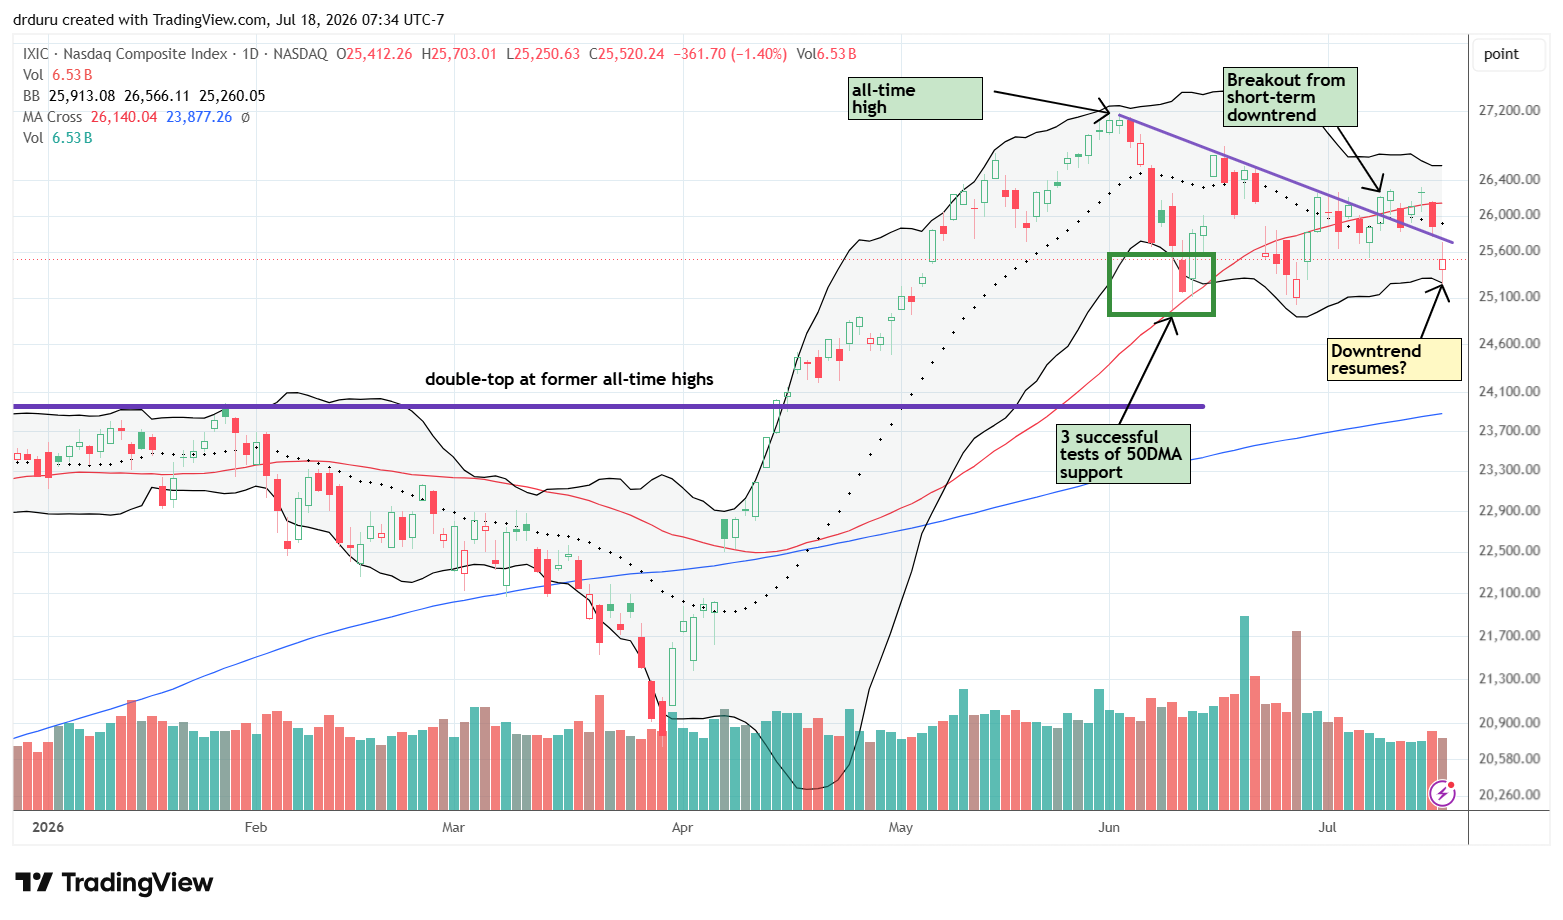
The NASDAQ (COMPQ) concerns me more than the S&P 500. Instead of following through on the bullish breakout I discussed a week ago, COMPQ stalled around the 50DMA before gapping down with a 1.4% loss. The drop confirmed a 50DMA breakdown and planted the tech-laden index underneath the former short-term downtrend line. Thus, the NASDAQ returned to a breakdown even without dropping below the June closing low. The NASDAQ most exposed the inability of the memory reversal to bring other related stocks along for the ride.
iShares Russell 2000 ETF (IWM)
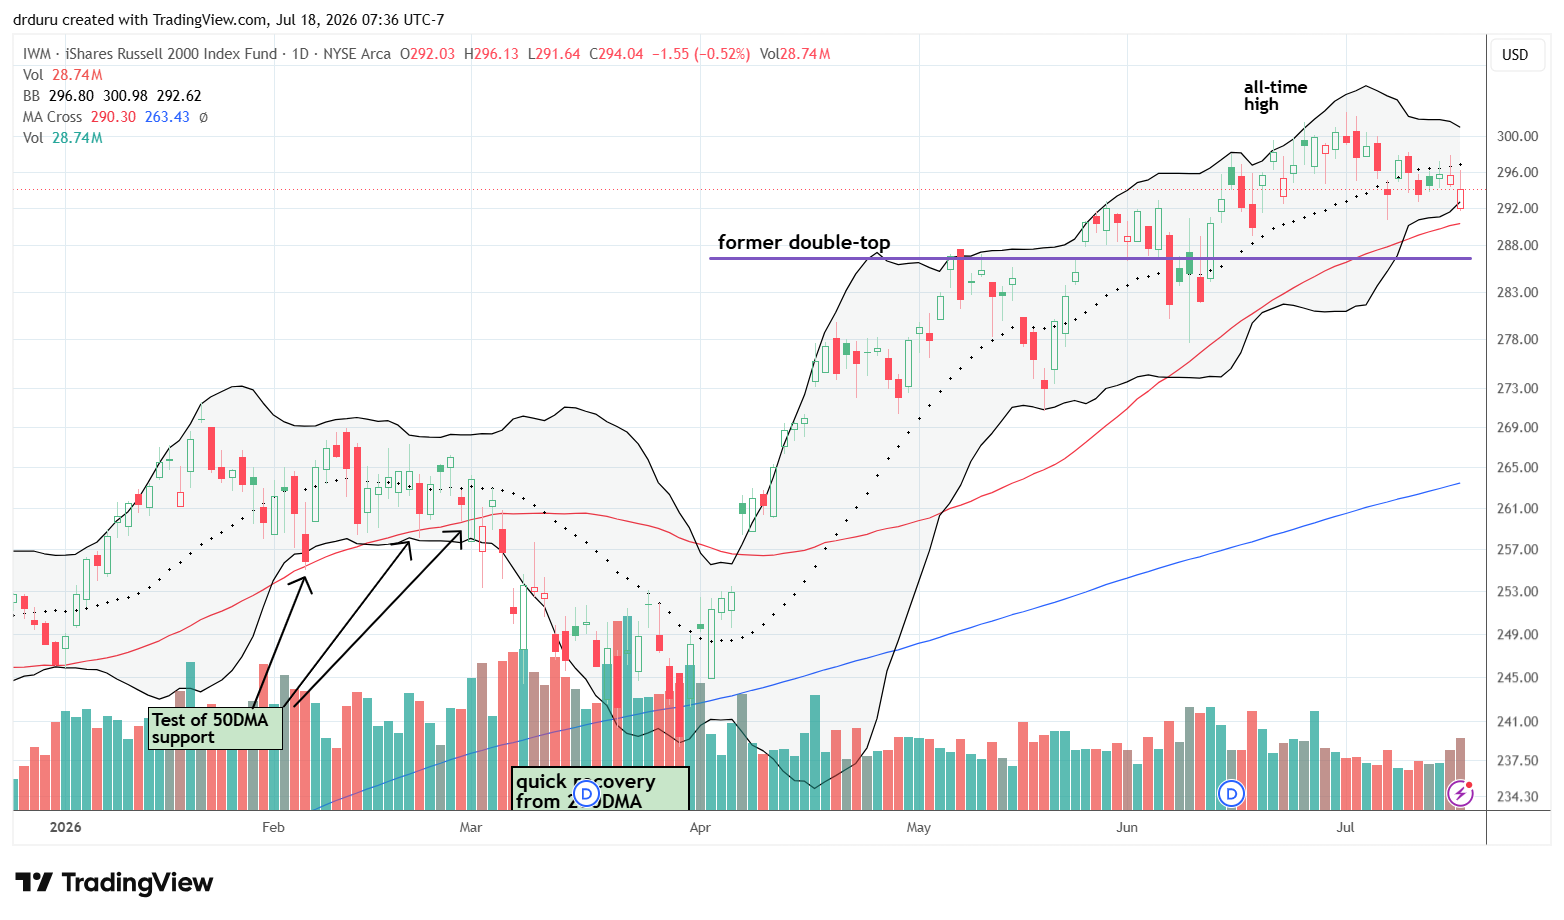
Unlike the large-cap technology indices, IWM continued to hold up well. The ETF remained comfortably above both its former double-top breakout and its 50DMA, keeping the bullish technical picture intact. IWM outperformed with a 0.5% loss.
The ongoing bullish positioning in IWM keeps me trying the weekly call option. This time around, I speculated on a short-term $297.5 call option expiring this coming Friday.
The Short-Term Trading Call With A Reversal
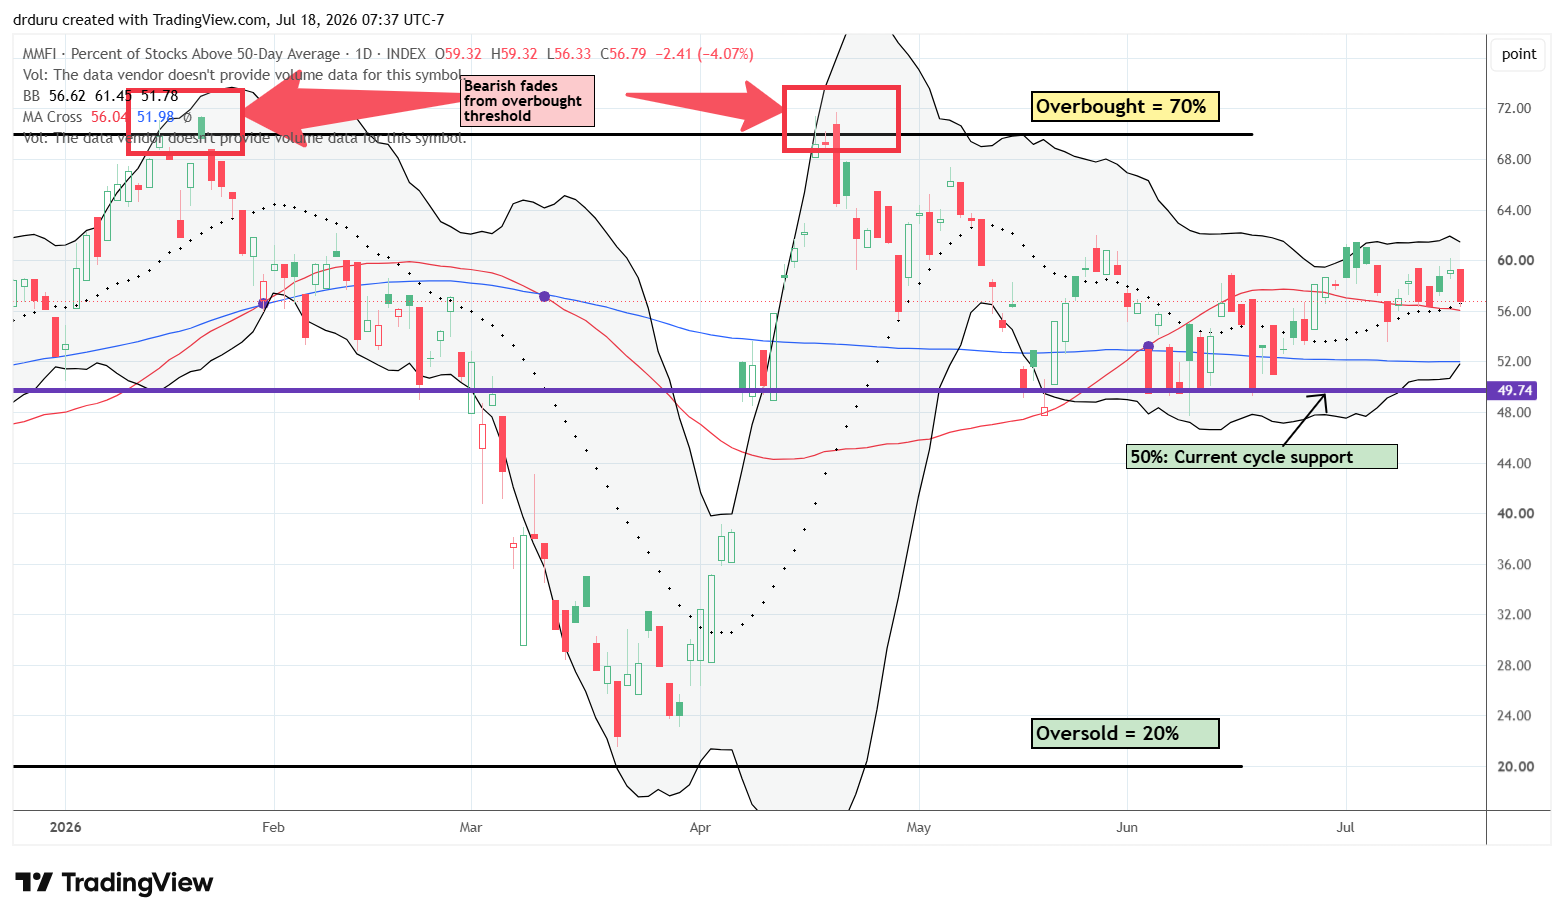
- AT50 (MMFI) = 56.8% of stocks are trading above their respective 50-day moving averages
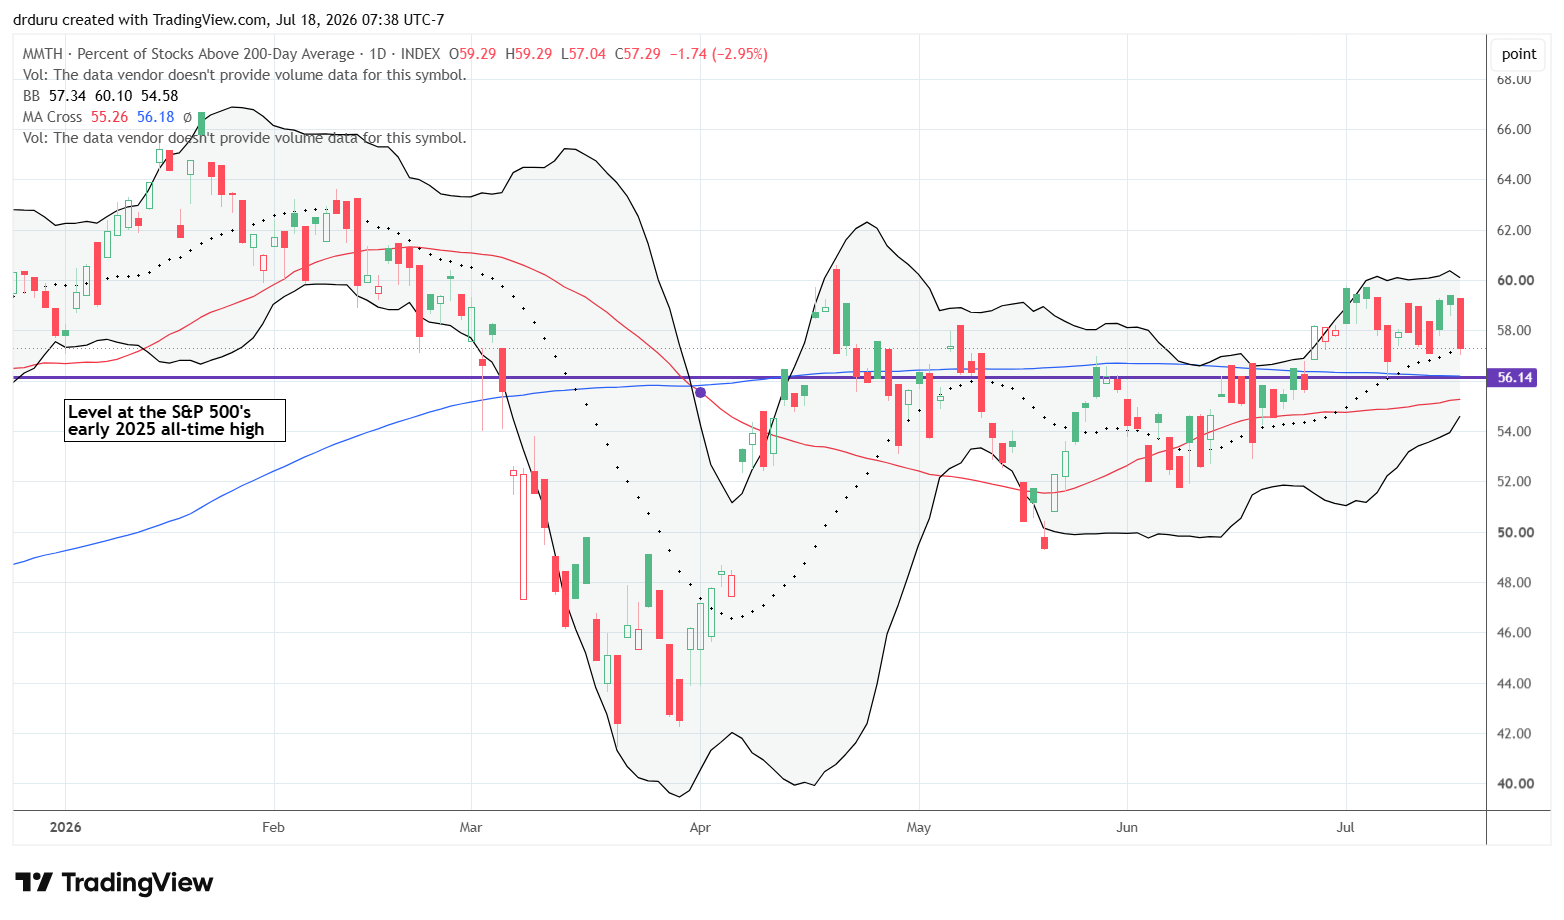
- AT200 (MMTH) = 57.3% of stocks are trading above their respective 200-day moving averages
- Short-term Trading Call: cautiously bullish
AT50 (MMFI), the percentage of stocks trading above their respective 50DMAs, closed the week at 56.8%. The indicator spent the week churning well above the critical 50% support level. The market is neither generating a fresh buy signal nor issuing a warning. For now, I am comfortable viewing this as constructive consolidation.
AT200, the percentage of stocks trading above their respective 200DMAs, closed the week at 57.3%. AT200 delivered essentially the same message as AT50. The indicator remained above its important support level near 56% while continuing to move sideways. As long as AT200 holds these levels, the longer-term picture for market breadth will look sufficiently stable.
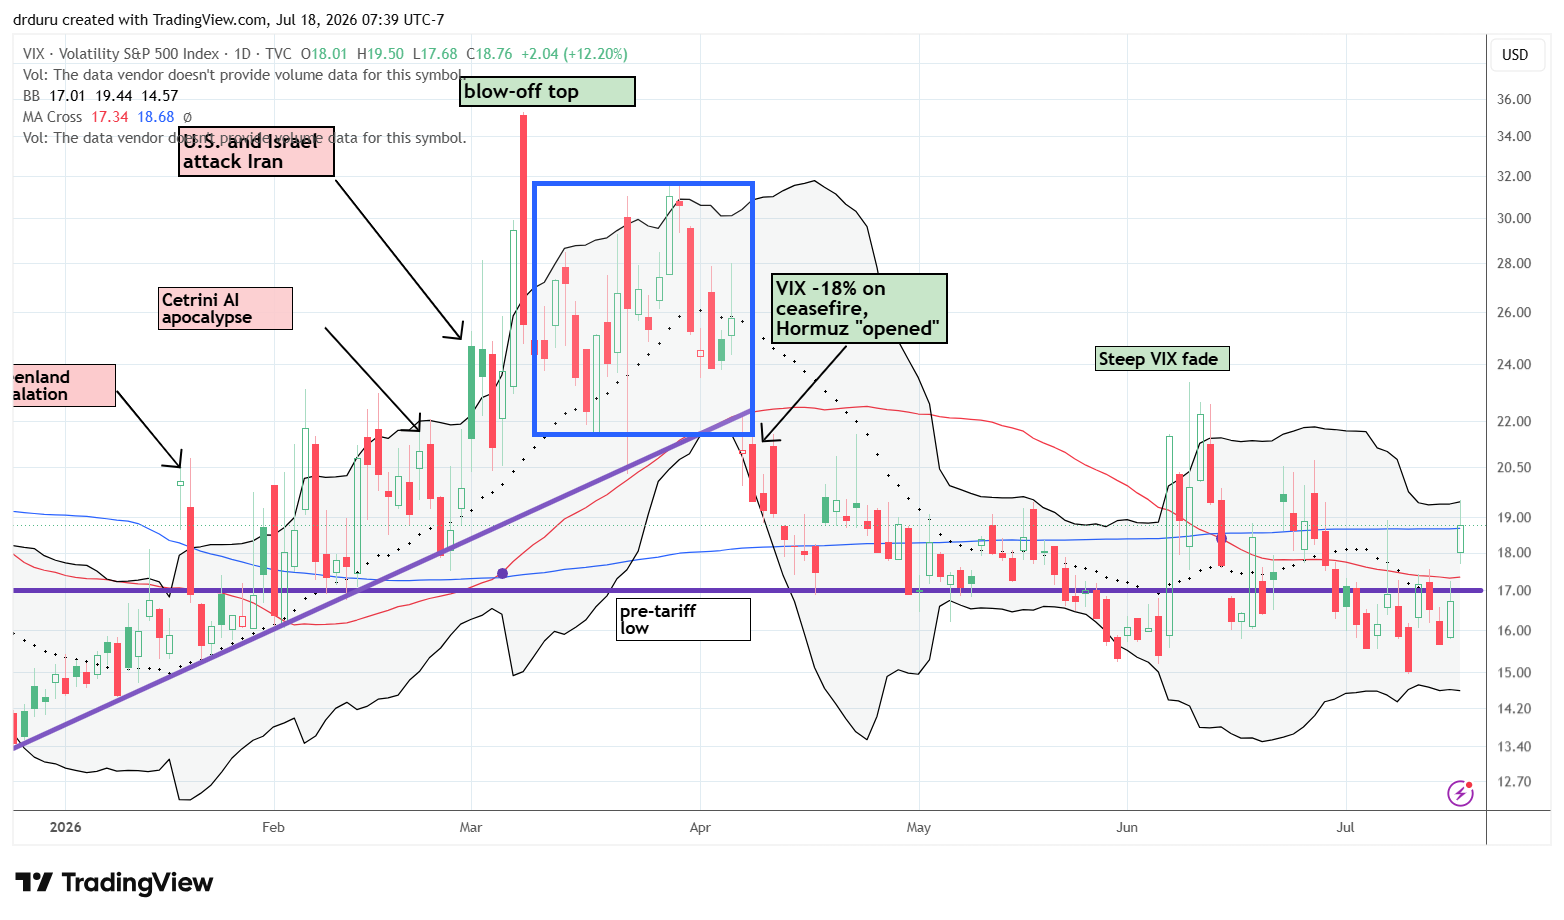
The volatility index (VIX) demonstrated how low levels can both confirm bullishness but also indicate fragility. As I noted in the last Market Breadth, “as soon as the market receives bad news that investors care about, the VIX will likely spike along with a sharp dislocation in the stock market.” On Thursday, the VIX warmed up with a 6.8% gain. On Friday, it gapped higher to a 12.2% gain and barely faded from its intraday highs. I will not try to guess where the VIX goes from here, but this current surge aligns with more short-term weakness for the stock market.
In case you missed it…
Last week I covered an epic one-day loss for International Business Machines (IBM) and explained why I continue to hold the stock. I also covered the growing weakness in semiconductor stocks. Using the VanEck Semiconductor ETF (SMH), I described the precarious positioning in the sector.
The Equities
Roundhill Memory ETF (DRAM)
Description: The Roundhill Memory ETF (DRAM) seeks to provide investment exposure to companies involved in the global memory semiconductor ecosystem, including manufacturers, equipment suppliers, and related businesses.
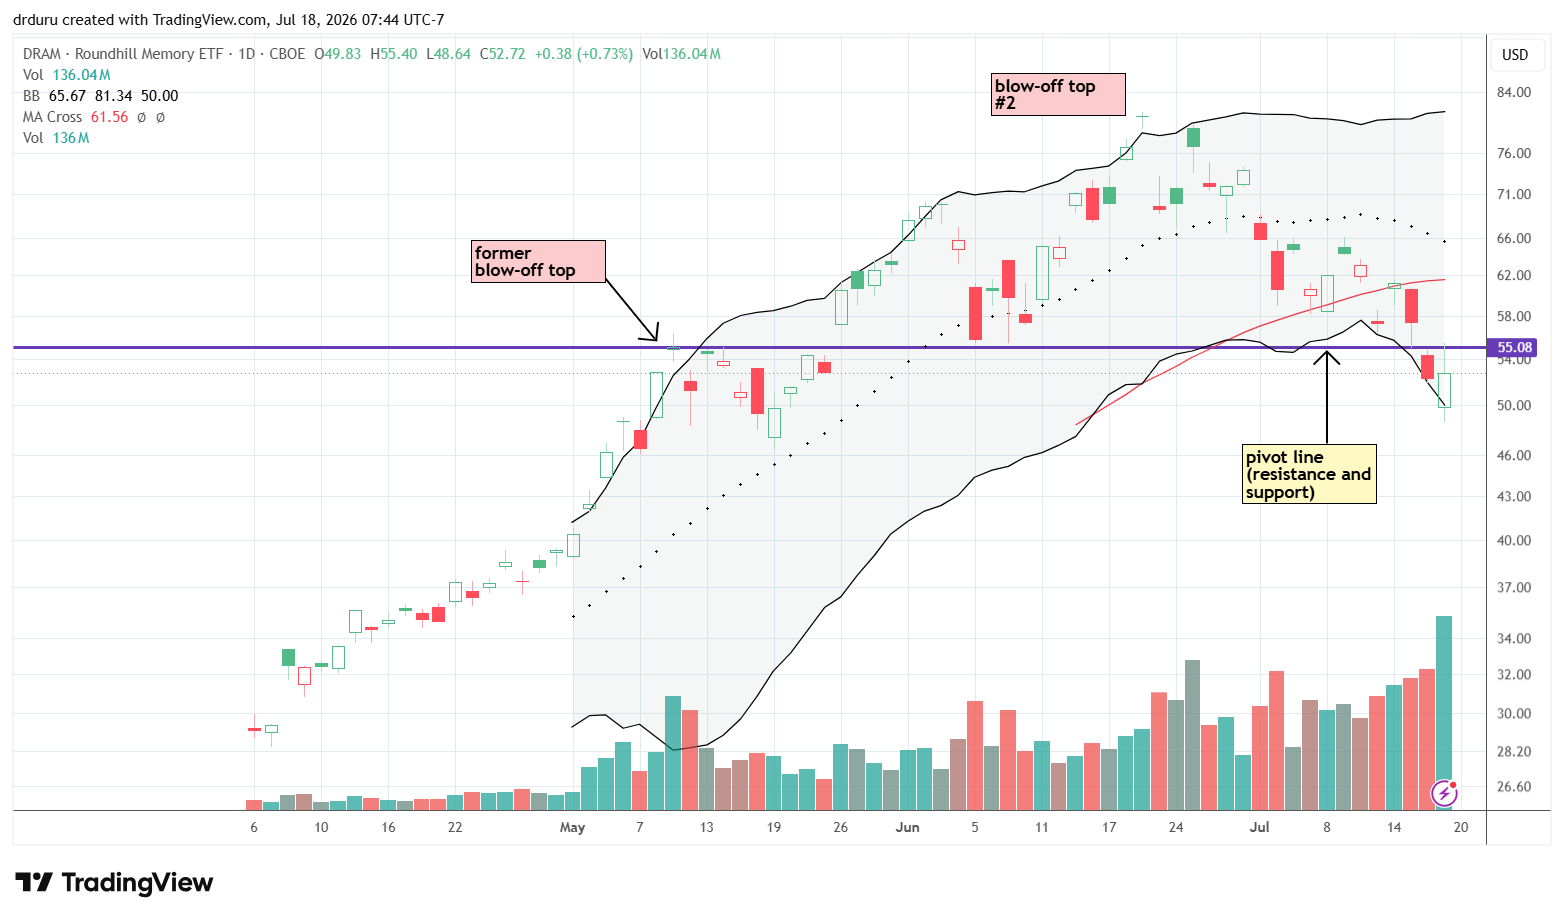
Technical status: Roundhill Memory ETF (DRAM) gapped lower before staging a strong intraday reversal. The rally stalled at resistance near the previous blow-off top around $55. DRAM failed to reclaim its 50DMA, and the breakdown remained intact. The ETF stayed in bearish territory.
Trade commentary: I thought a reversal had the potential to mark an important turning point for memory stocks, but DRAM came up short in two important ways. First, DRAM could not break above what has now become resistance from the level of the former (first) blow-off top. Second, the reversal did nothing to prevent the NASDAQ from confirming its bearish breakdown. That combination has me worried about spreading bearishness in tech.
I have been trading DRAM on very short-term setups. This latest trade has not worked out so far. I bought the bounce from support despite DRAM trading below its 50DMA, got caught in the breakdown, and fortunately held through Friday’s reversal. Even so, DRAM now appears to be breaking down. The second blow-off top from late June continues to define the chart with a downtrend in place since that point. Memory has become a precarious trade.
VanEck Semiconductor ETF (SMH)
Description: VanEck Semiconductor ETF (SMH) seeks to track the performance of companies involved in semiconductor production, equipment, and related technologies.
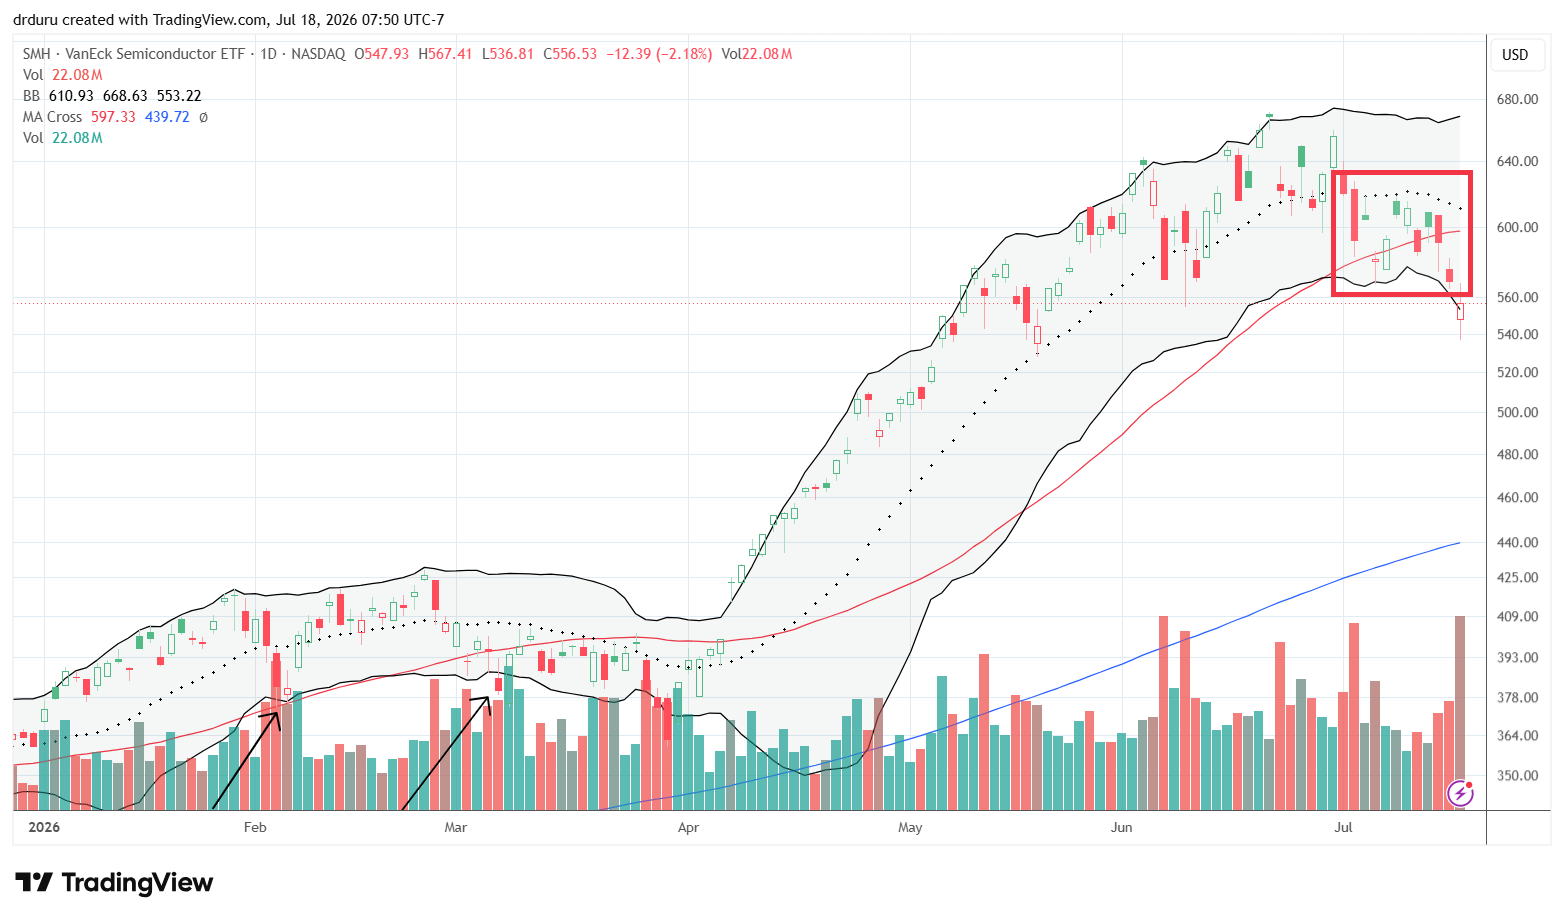
Technical status: The VanEck Semiconductor ETF (SMH) broke below the trading range I had been highlighting and further confirmed its breakdown beneath the 50DMA. Selling volume expanded significantly.
Trade commentary: Despite the breakdown, SMH has still enjoyed a blockbuster year. Unfortunately, strong advances often leave very little natural support underneath them. If this selloff gains momentum, I think SMH could quickly test its 200DMA (the blue line), somewhere around the 450–460 area. On Thursday, I even bought a $560/$550 put spread expiring on Friday as a partial hedge against this creeping bearishness. The semiconductor group continues to roll over, and I remain cautious especially given how the DRAM reversal fell short of saving the day for SMH.
The chart below posted by Ben Carlson shows what looks like an unsustainable transfer of wealth from hyperscalers to semiconductor companies. This dynamic alone screams out caution for SMH given the extreme nature of these financials.

Aehr Test Systems (AEHR)
Description: Aehr Test Systems develops testing solutions and equipment used in semiconductor manufacturing and related industries.
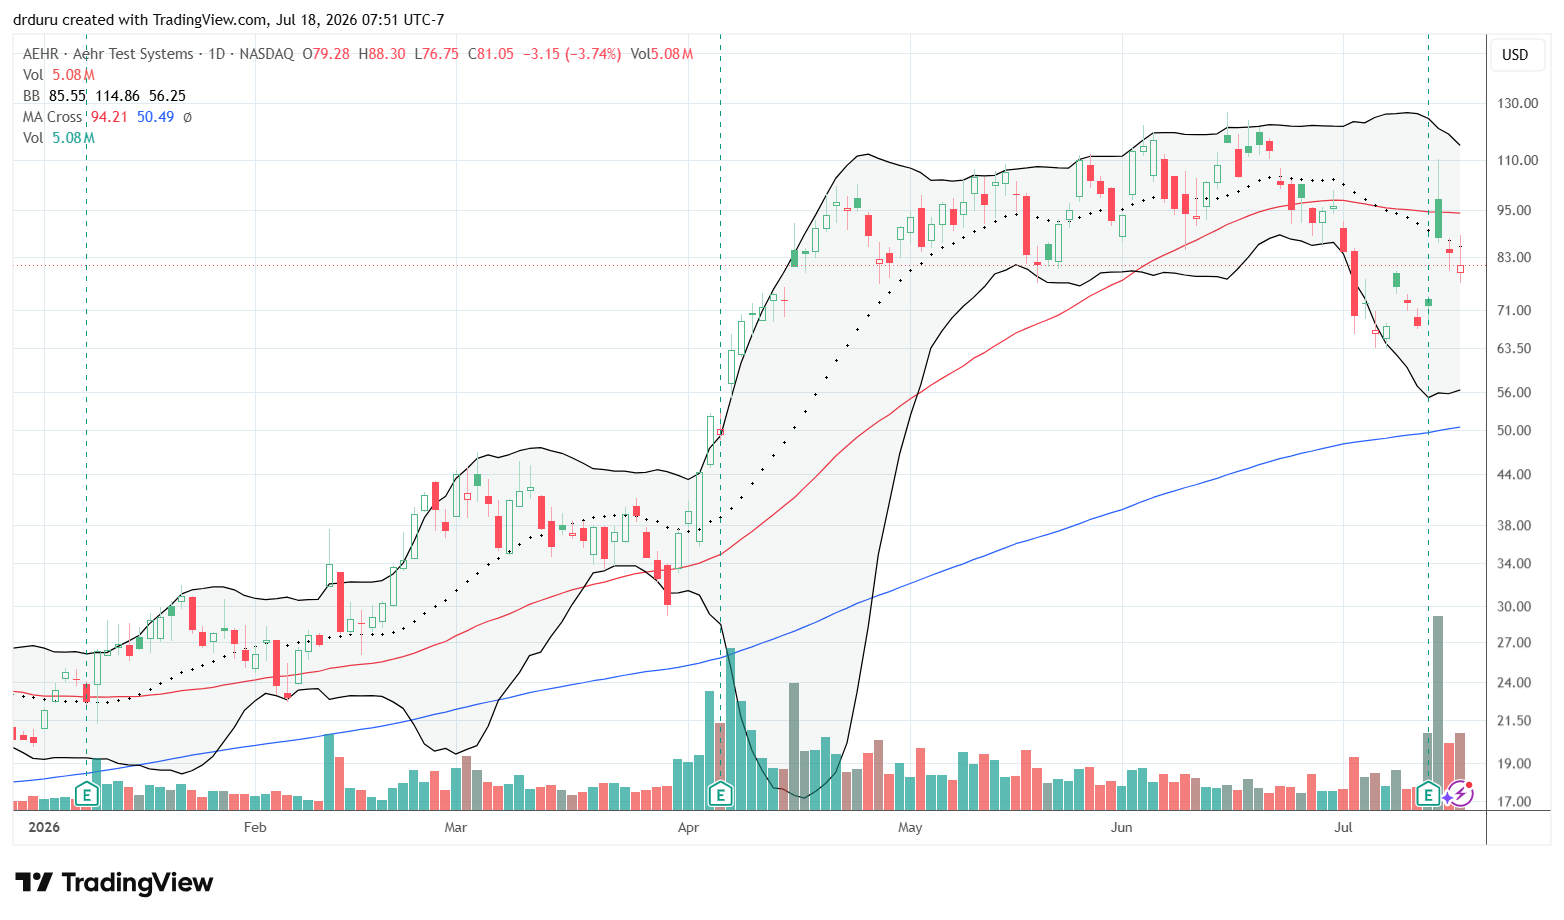
Technical status: Aehr Test Systems (AEHR) surged 21.9% after earnings and nearly returned to its previous all-time high before fading. The stock began filling its post-earnings gap higher.
Trade commentary: The DRAM reversal came up short for AEHR. Watching AEHR fade after such a strong post-earnings move added to my impression of growing weakness in semiconductor plays. The gap-fill is bearish trading action below the 50DMA. I am now watching to see whether the stock can recover its 50DMA breakout.
Applied Materials (AMAT)
Description: Applied Materials (AMAT) supplies manufacturing equipment, services, and software for the semiconductor, display, and related technology industries.
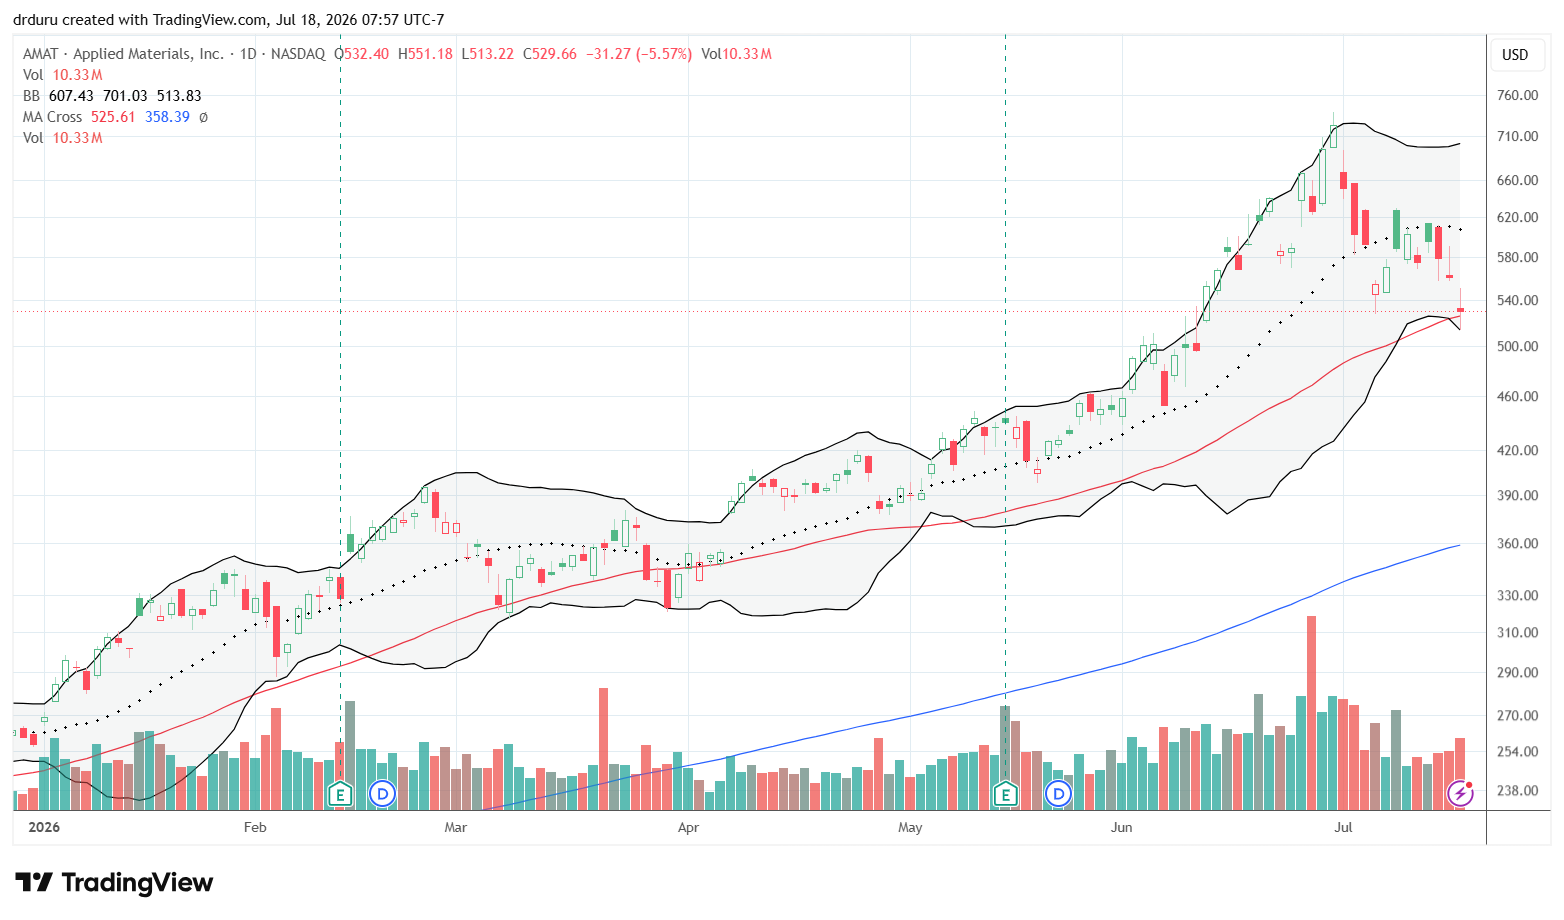
Technical status: Applied Materials (AMAT) tested its 50DMA and fell 5.6%. The stock bounced intraday but faded from its highs before the close.
Trade commentary: The DRAM reversal came up short for AMAT. I will be watching AMAT very closely during the coming week. I want to see whether buyers can defend its 50DMA with a meaningful bounce. Otherwise, AMAT is beginning to look as precarious as many of its semiconductor peers.
Arm Holdings (ARM)
Description: Arm Holdings plc (ARM) designs CPU architectures and semiconductor intellectual property licensed to chip manufacturers worldwide.
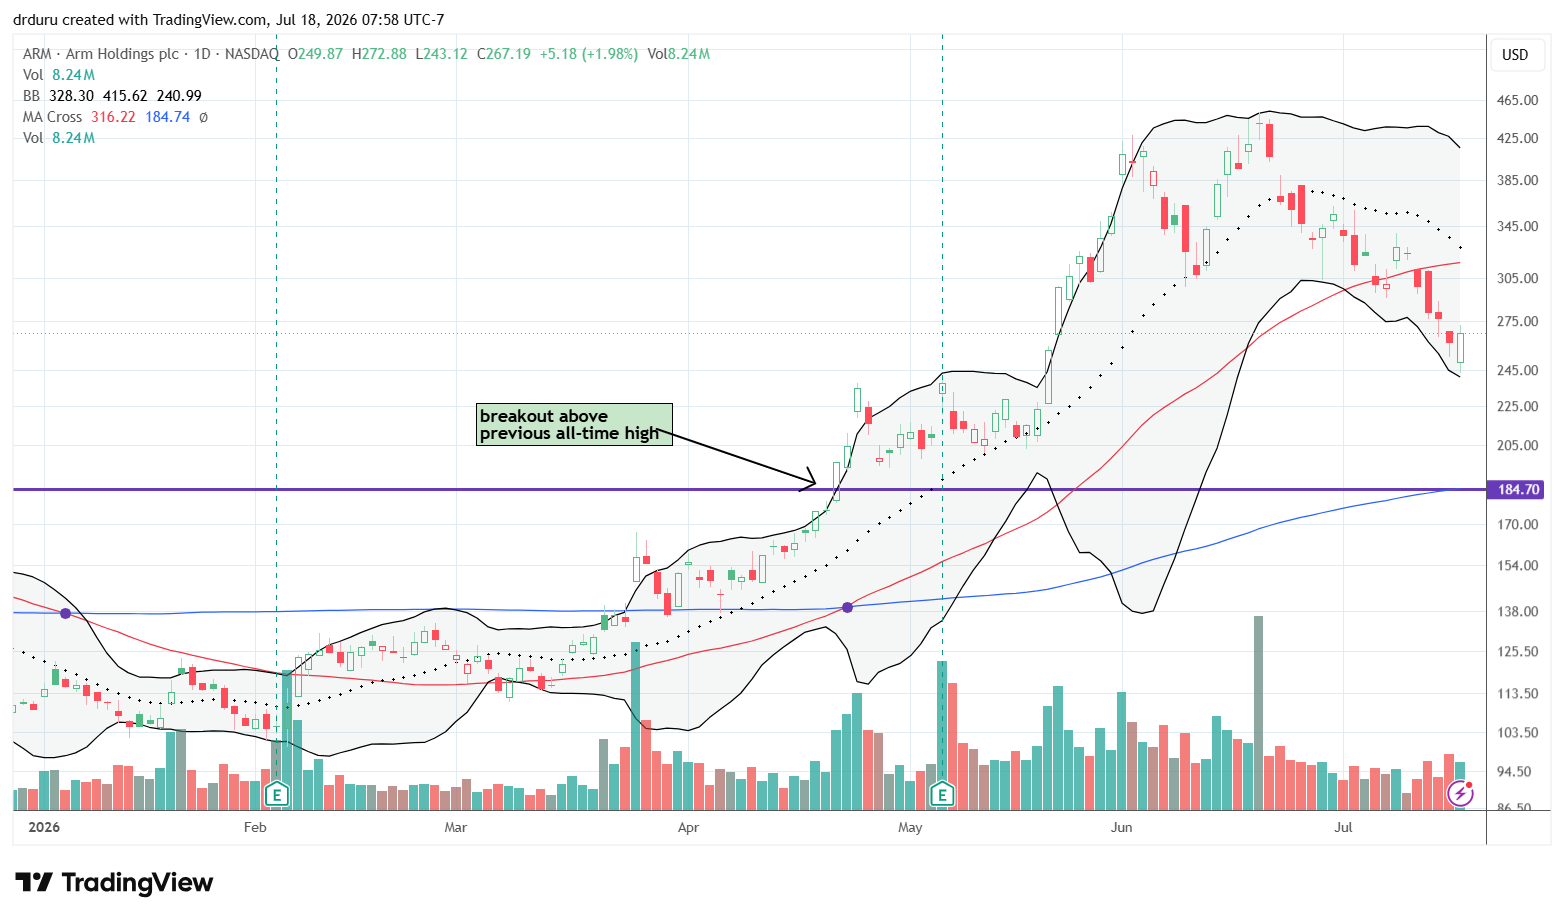
Technical status: Arm Holdings (ARM) remained in the downtrend that began after its June all-time high. ARM confirmed a 50DMA breakdown.
Trade commentary: The DRAM reversal worked intraday for ARM, but it did not repair ARM’s bearish technical position. The stock’s technical deterioration continues, and I do not see evidence yet that the downtrend has run its course. ARM is positioned for an eventual test of support at the converged 200DMA and major breakout point at $184.70.
Celestica (CLS)
Description: Celestica Inc. (CLS) provides electronics manufacturing services, hardware platform solutions, and supply chain services for technology companies.
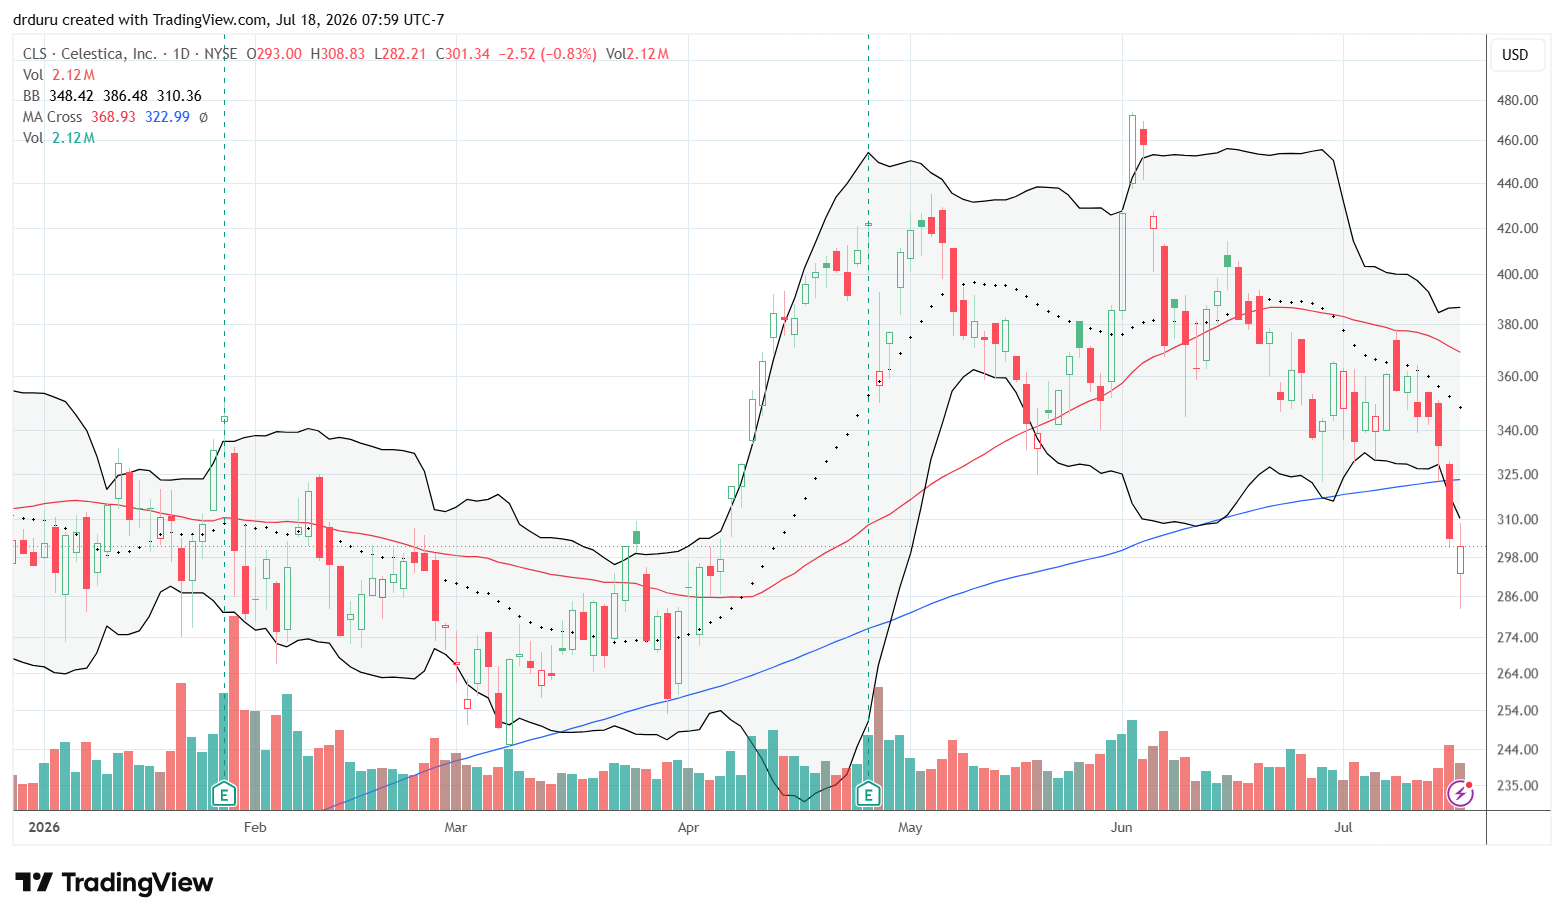
Technical status: Celestica (CLS) suffered a decisive breakdown below its 200DMA. The decline returned the stock to price levels last seen in March and left it roughly flat for the year.
Trade commentary: The DRAM reversal almost carried CLS with it, but the stock still finished with a confirmed 200DMA breakdown. CLS is yet another example of how the AI trade has started to unravel. The stock caught fire in 2023 as an important part of the AI hardware infrastructure supply chain. CLS achieved a new all-time high in late 2024 and increased about 40x from early 2023 to this year’s all-time high. Now, CLS is short-term bearish with a 36% loss from its all-time high and a confirmed 200DMA breakdown.
IonQ (IONQ)
Description: IonQ, Inc. (IONQ) develops and commercializes trapped-ion quantum computing hardware and cloud-accessible quantum computing systems.
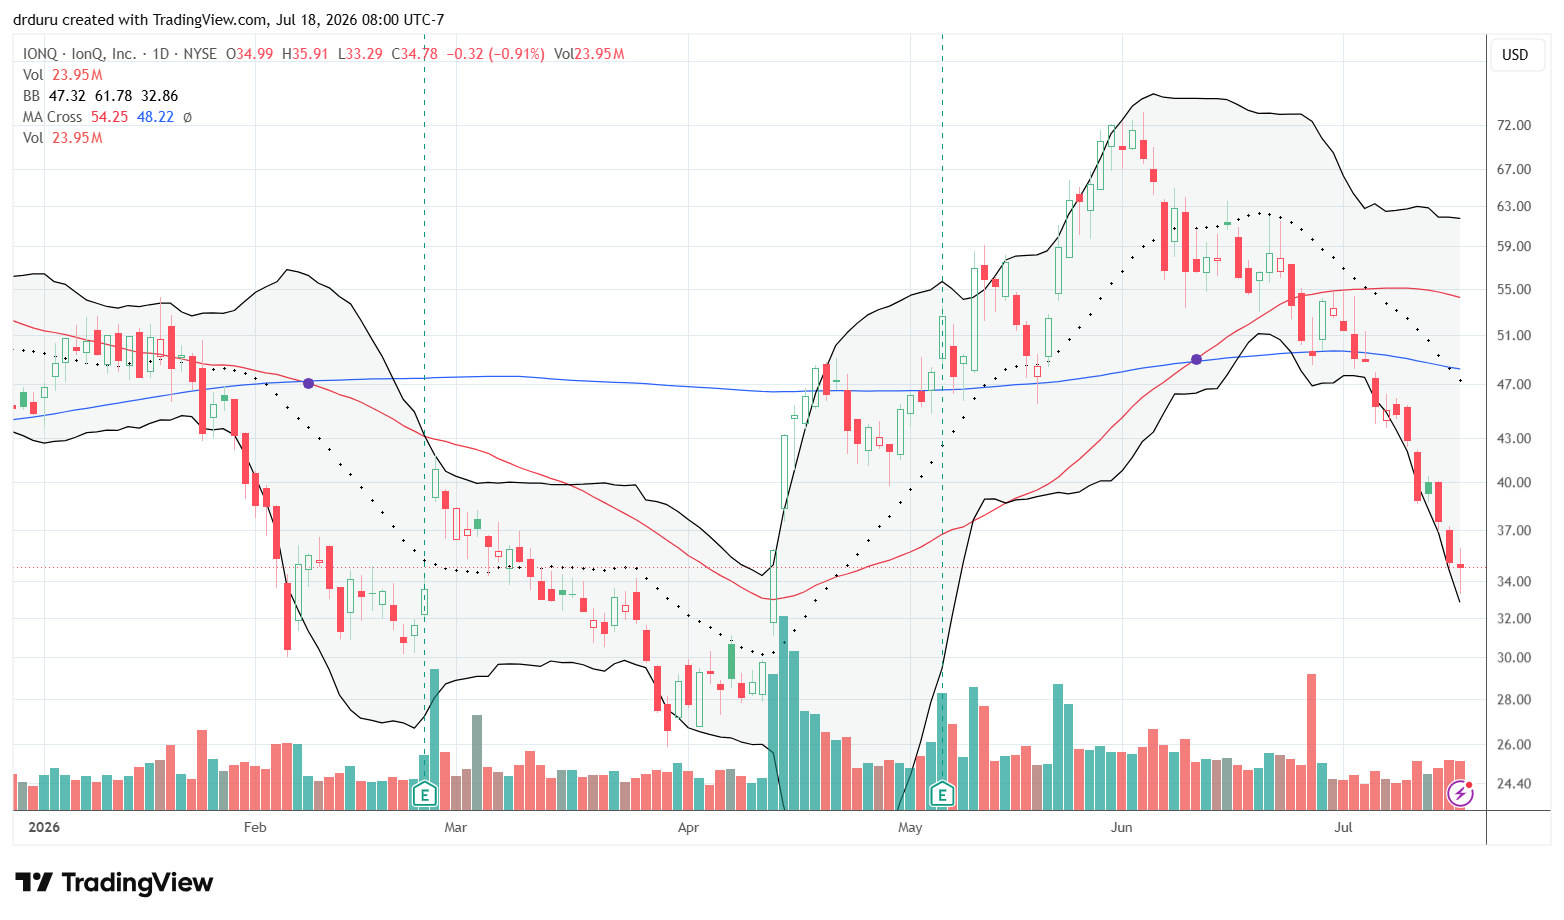
Technical status: IonQ (IONQ) remained in a developing topping pattern after last peaking near the beginning of June. The stock stayed well below its previous all-time high and experienced increasingly aggressive selling pressure.
Trade commentary: IONQ remains my favorite quantum computing play, but I am treating it strictly as a speculative trade. I noticed unusually heavy put activity in the August $20 strike. Since I find it hard to believe IONQ will fall so far, so fast, I hedged by buying those puts alongside an August $40/$50 call spread in case the options activity represented someone positioning for a sharp reversal. I will not buy shares in IONQ until it regains momentum above its 200DMA resistance.
Robinhood Ventures Fund (RVI)
Description: Robinhood Ventures Fund (RVI) is an investment fund that provides exposure to venture-backed private companies through a publicly traded vehicle.
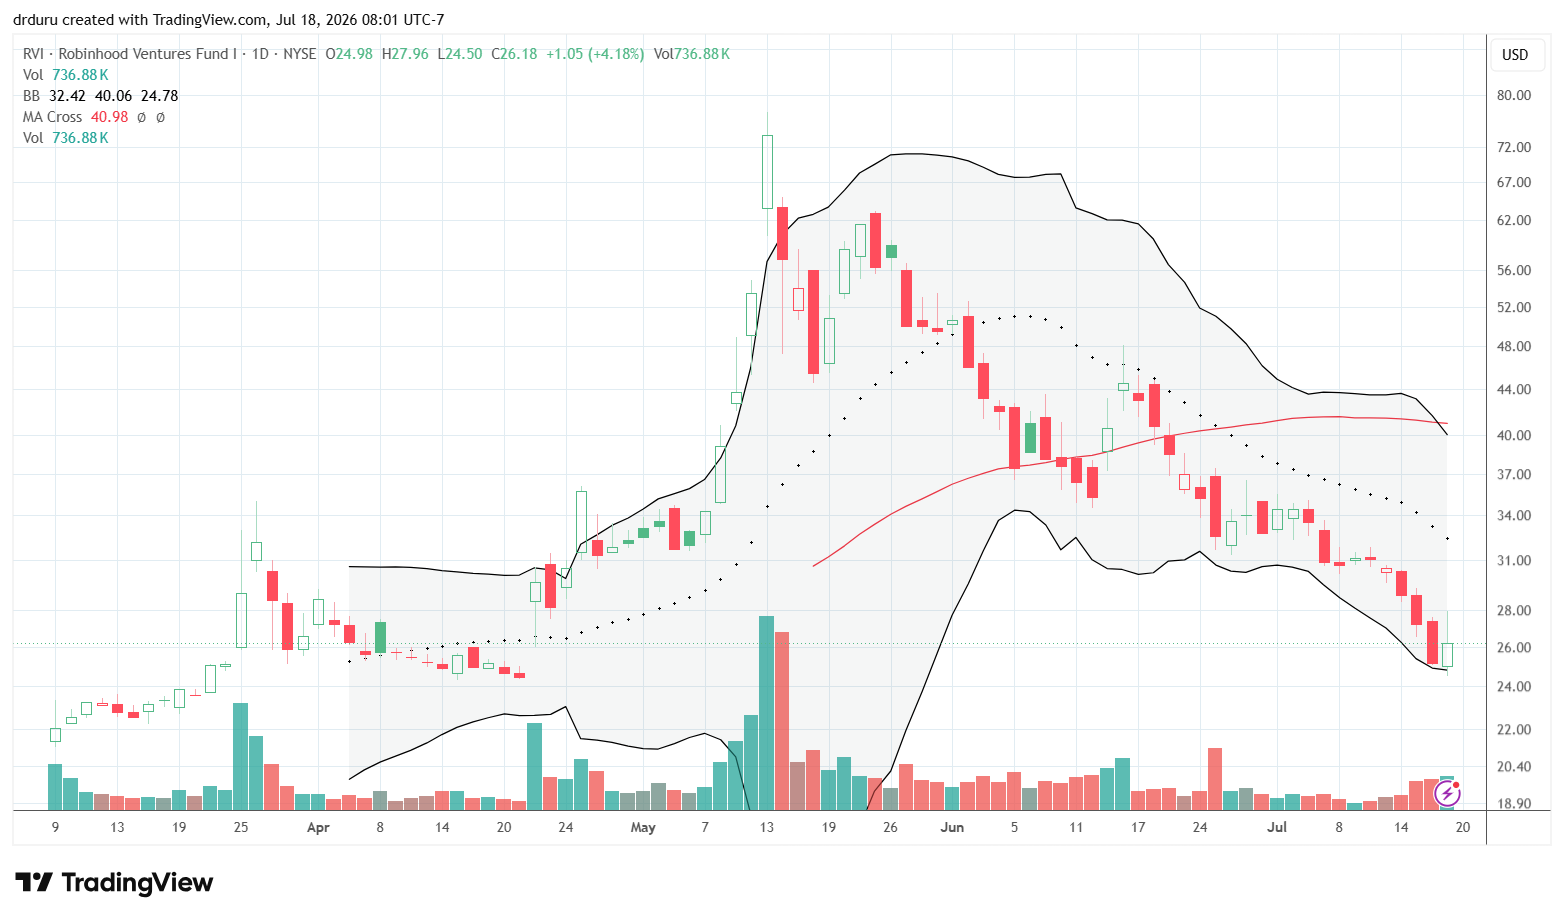
Technical status: Robinhood Ventures Fund (RVI) completed a full reversal from its May high. A breakout attempt above the previous day’s candle failed immediately after triggering my buy stop. The longer-term downtrend remained intact.
Trade commentary: I may have gotten caught on this third RVI trade. My first trade was a play on the return to the IPO price around $25. I sold just before the move became parabolic. The second trade happened after RVI recovered from a 50DMA breakdown; that trade lasted just a day, and I took profits just in time. Once RVI approached $25 on Thursday, I placed a buy stop above the intraday high ($27.61), expecting a sustained breakout. Instead, RVI jumped about 10%, triggered my buy order, and soon faded.
I am holding RVI for now given the proximity to the IPO price. However, the introduction of Kimi seemed to grease the skids for the stock. So I will need to consider an exit if RVI closes at an all-time low.
Financial Select Sector SPDR Fund (XLF)
Description: Financial Select Sector SPDR Fund (XLF) tracks companies in the financial sector of the S&P 500, including banks, insurers, capital markets firms, and consumer finance companies.
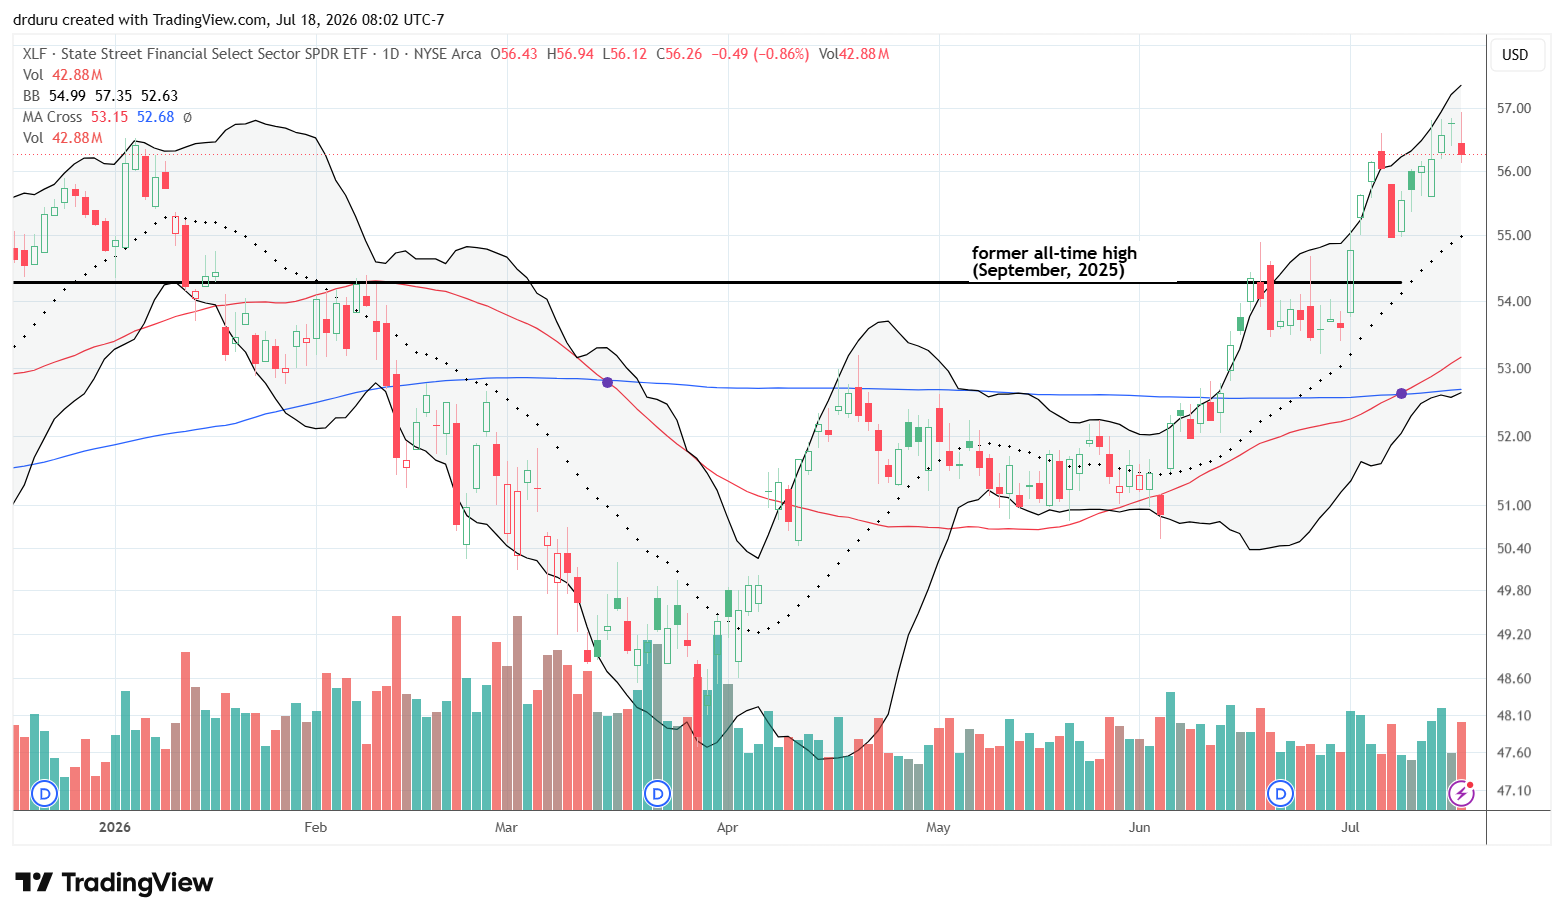
Technical status: The Financial Select Sector SPDR Fund (XLF) rallied through earnings season and briefly reached a fresh all-time high before pulling back 0.9% on Friday.
Trade commentary: One of the more interesting developments last week was the continued strength in financials. Even with Friday’s pullback, XLF seems to be benefiting from money rotating out of technology, artificial intelligence, and semiconductors. Financials continue to outperform.
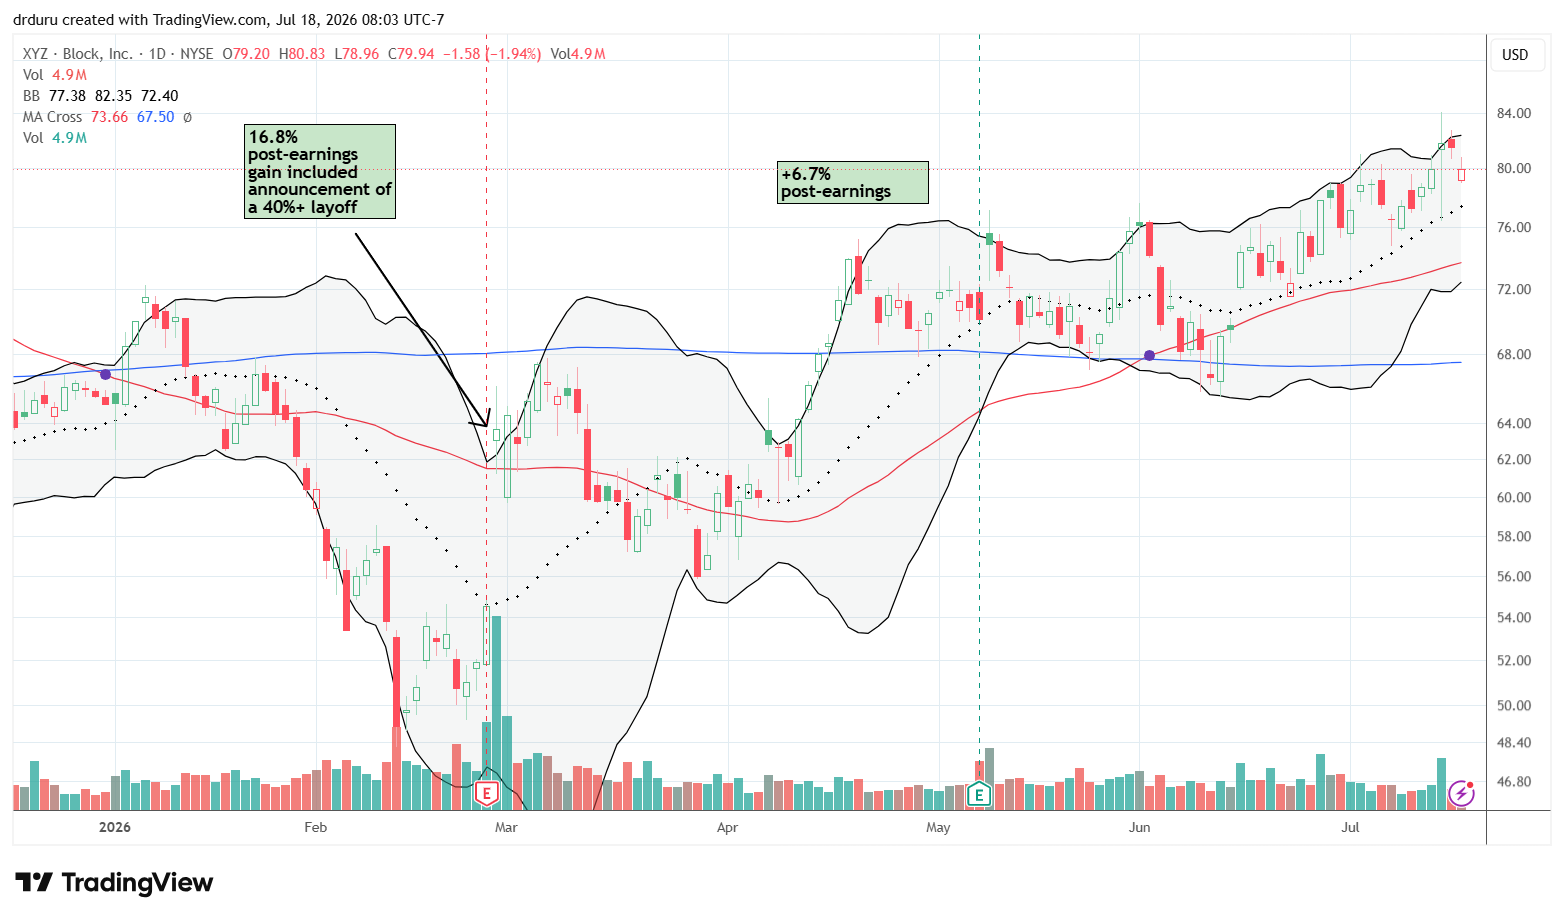
Block (XYZ)
Description: Block, Inc. (XYZ) develops financial technology products and services, including payment processing, consumer financial services, and business software.
Technical status: Block (XYZ) continued grinding higher and approached prior resistance without breaking out.
Trade commentary: I cannot maintain a bearish view on XYZ anymore given the positive technicals. The stock continues to grind higher and appears to be preparing for another breakout attempt. I have definitely stopped trying to fade the rally.
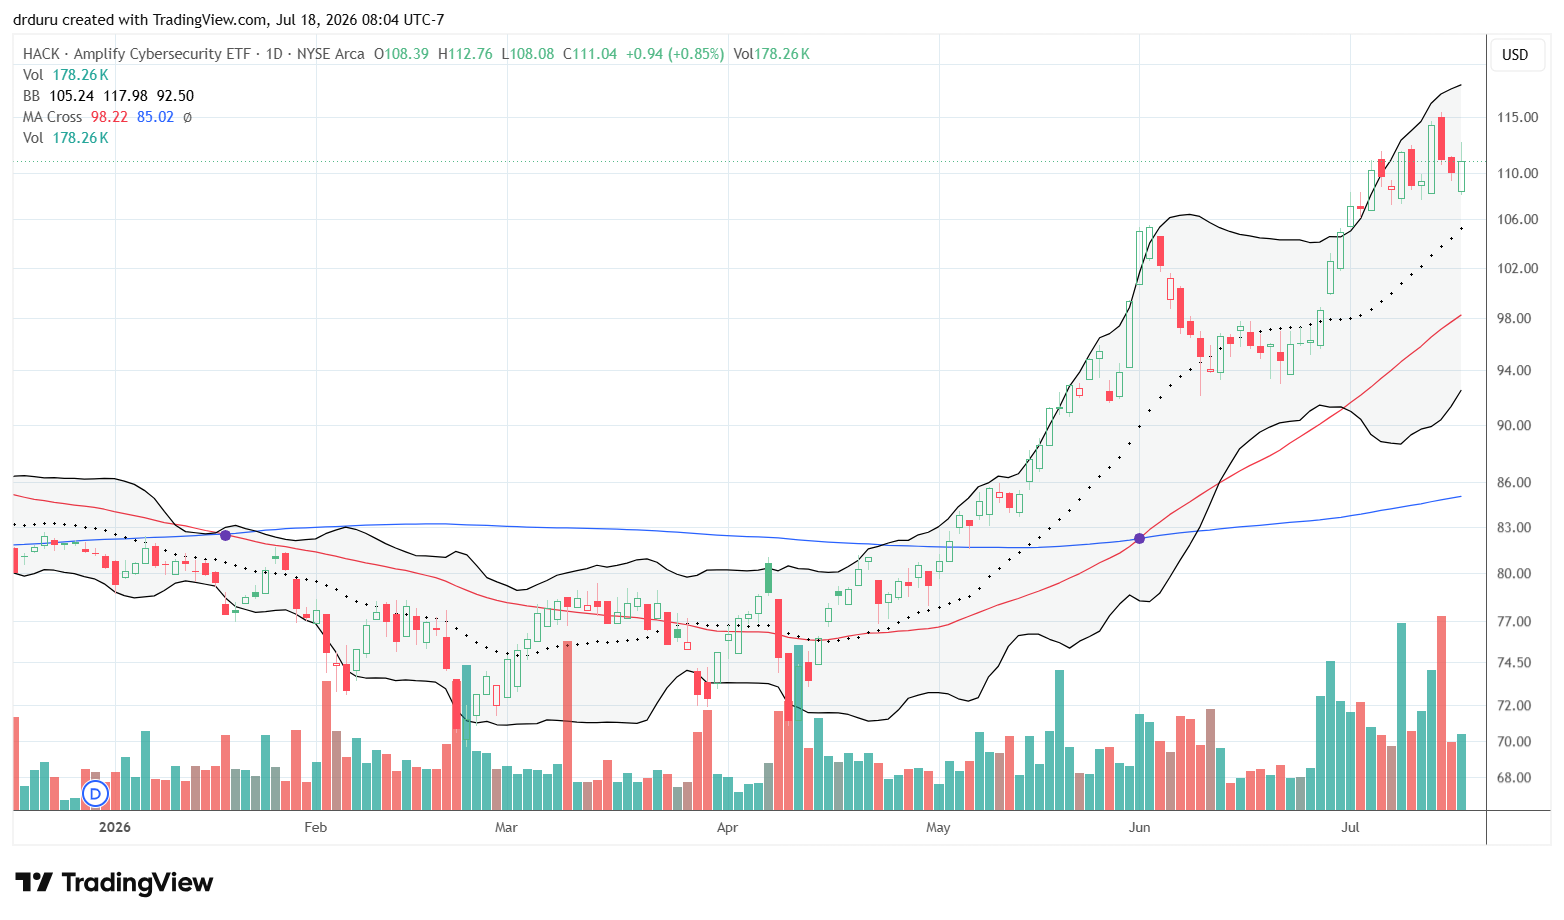
Amplify Cybersecurity ETF (HACK)
Description: Amplify Cybersecurity ETF (HACK) provides exposure to companies involved in cybersecurity hardware, software, and related services.
Technical status: Amplify Cybersecurity ETF (HACK) initially surged following IBM-related news before giving back most of the gains. Friday’s gap down completed the reversal while still producing a modest gain at the end of the day.
Trade commentary: The IBM-inspired rally in cybersecurity has quickly become a wash. Still, HACK remains in a strong uptrend and has avoided software and tech weakness.
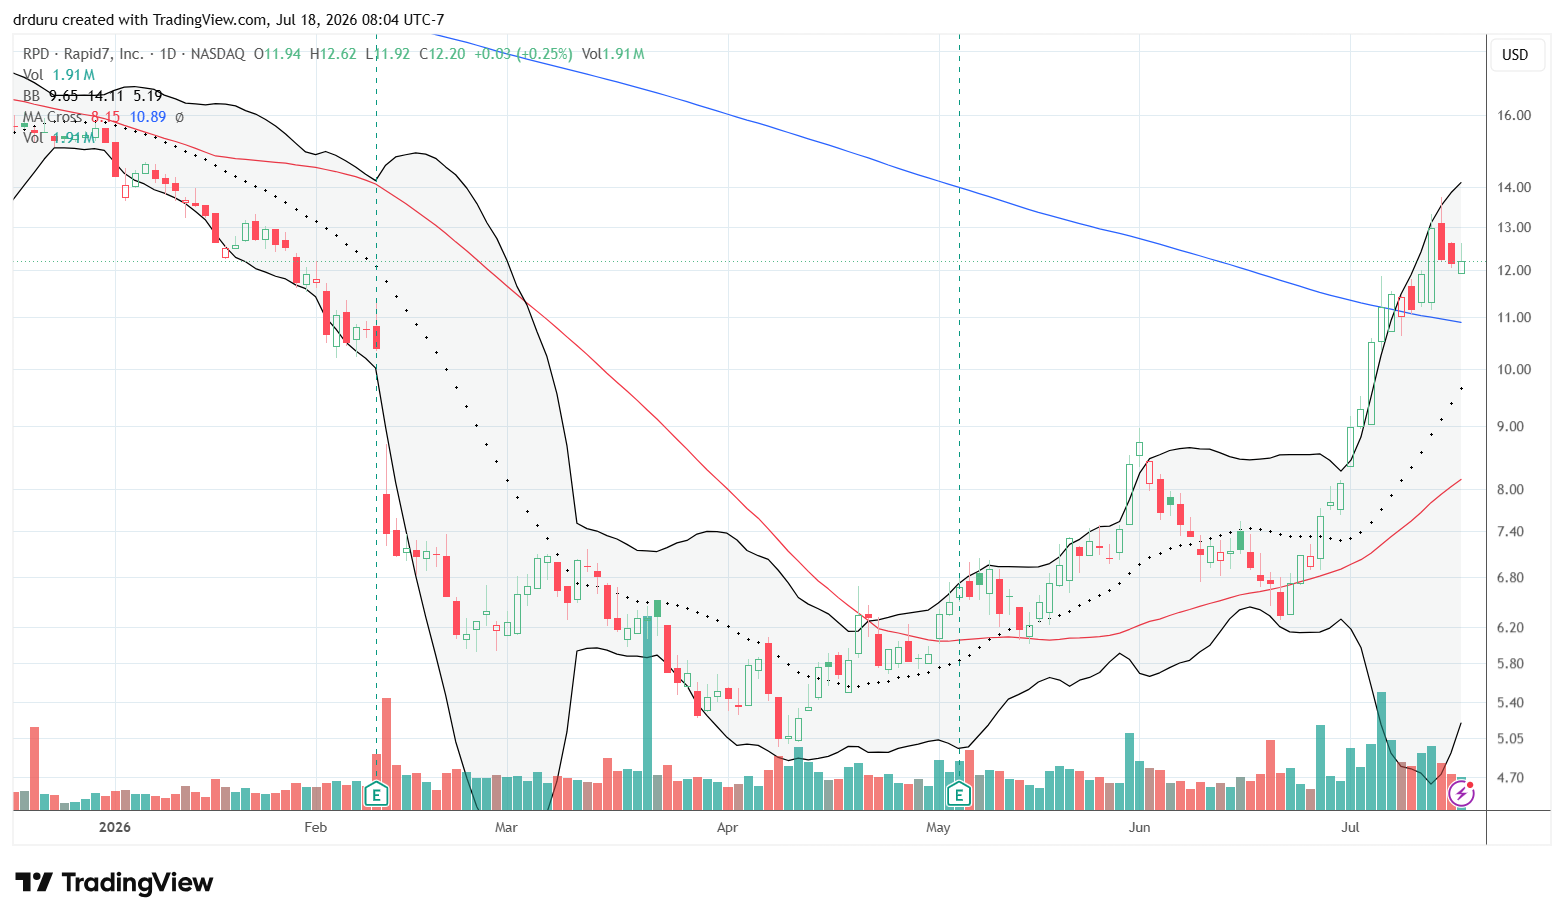
Rapid7 (RPD)
Description: Rapid7, Inc. (RPD) develops cybersecurity software focused on vulnerability management, cloud security, threat detection, and incident response.
Technical status: Rapid7 (RPD) broke above its 200DMA and continued holding that breakout. The longer-term chart showed signs of a bottoming process.
Trade commentary: I have wondered for a long time why RPD remained so weak after peaking in 2021. The recent breakout above its 200DMA now has my attention as a long-awaited bottom. Earnings are approaching, so I need to remain cautious, but I like what I am seeing technically.
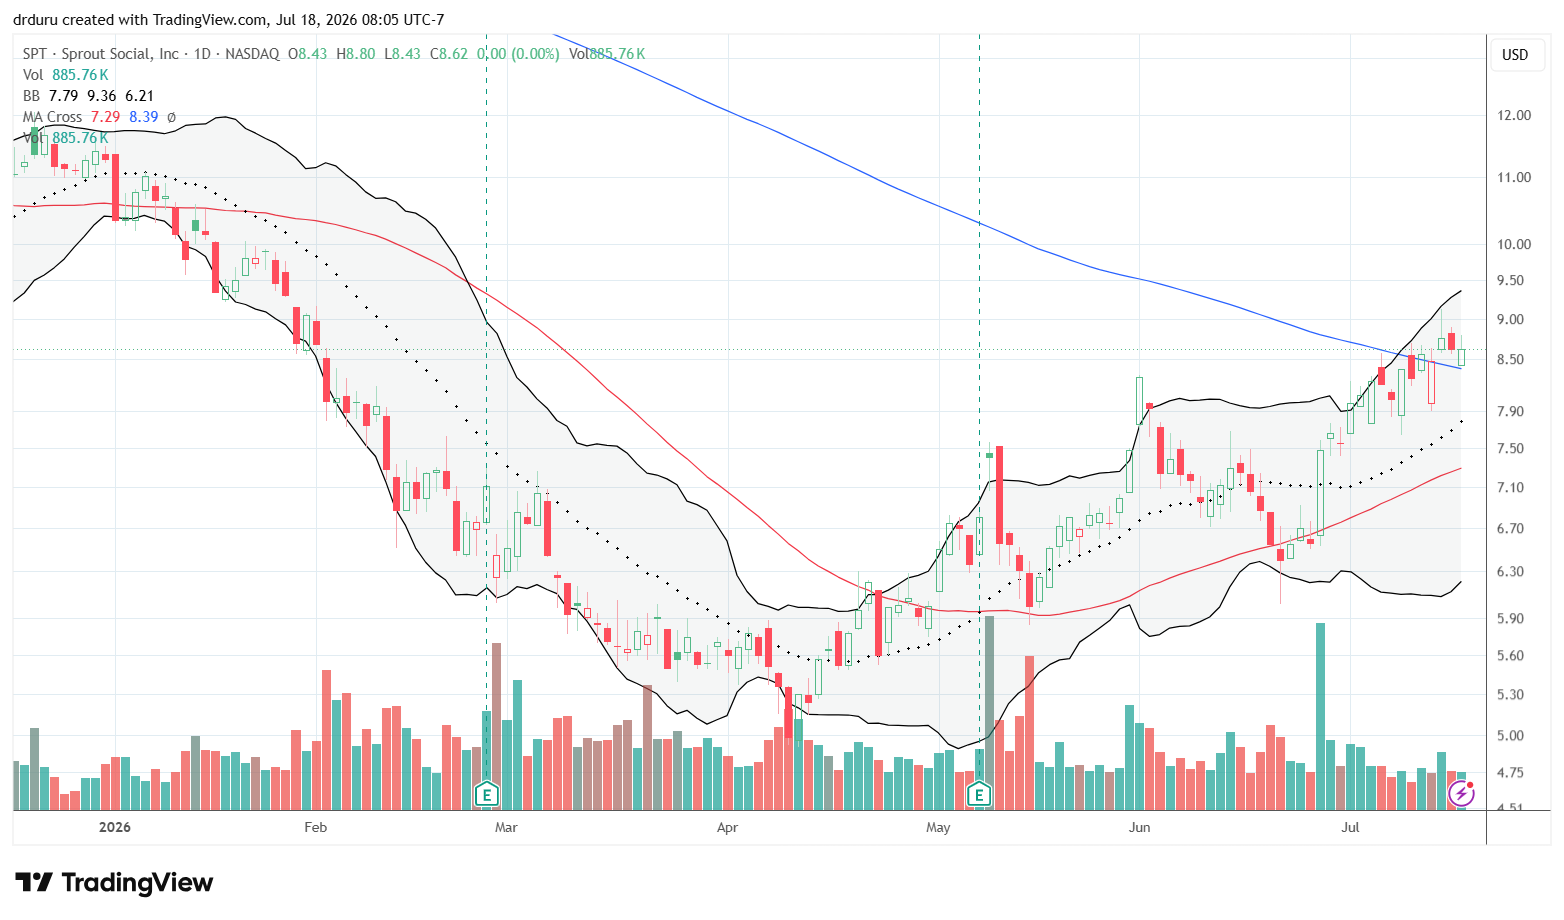
Sprout Social (SPT)
Description: Sprout Social, Inc. (SPT) provides cloud-based social media management, analytics, engagement, and customer care software.
Technical status: Sprout Social (SPT) finally broke above its 200DMA after several sessions of consolidation and managed to hold the breakout on Friday’s initial gap down.
Trade commentary: My trade in SPT worked out well. I took profits at 200DMA resistance because I did not like all the churn around the 200DMA. The breakout eventually arrived on Wednesday, and SPT has held on since then. I am not interested in chasing the stock higher (I still have plenty of software stocks), but I do want to continue watching it as software stocks recover.
Apple (AAPL)
Description: Apple Inc. (AAPL) designs, manufactures, and sells consumer electronics, software, and digital services.
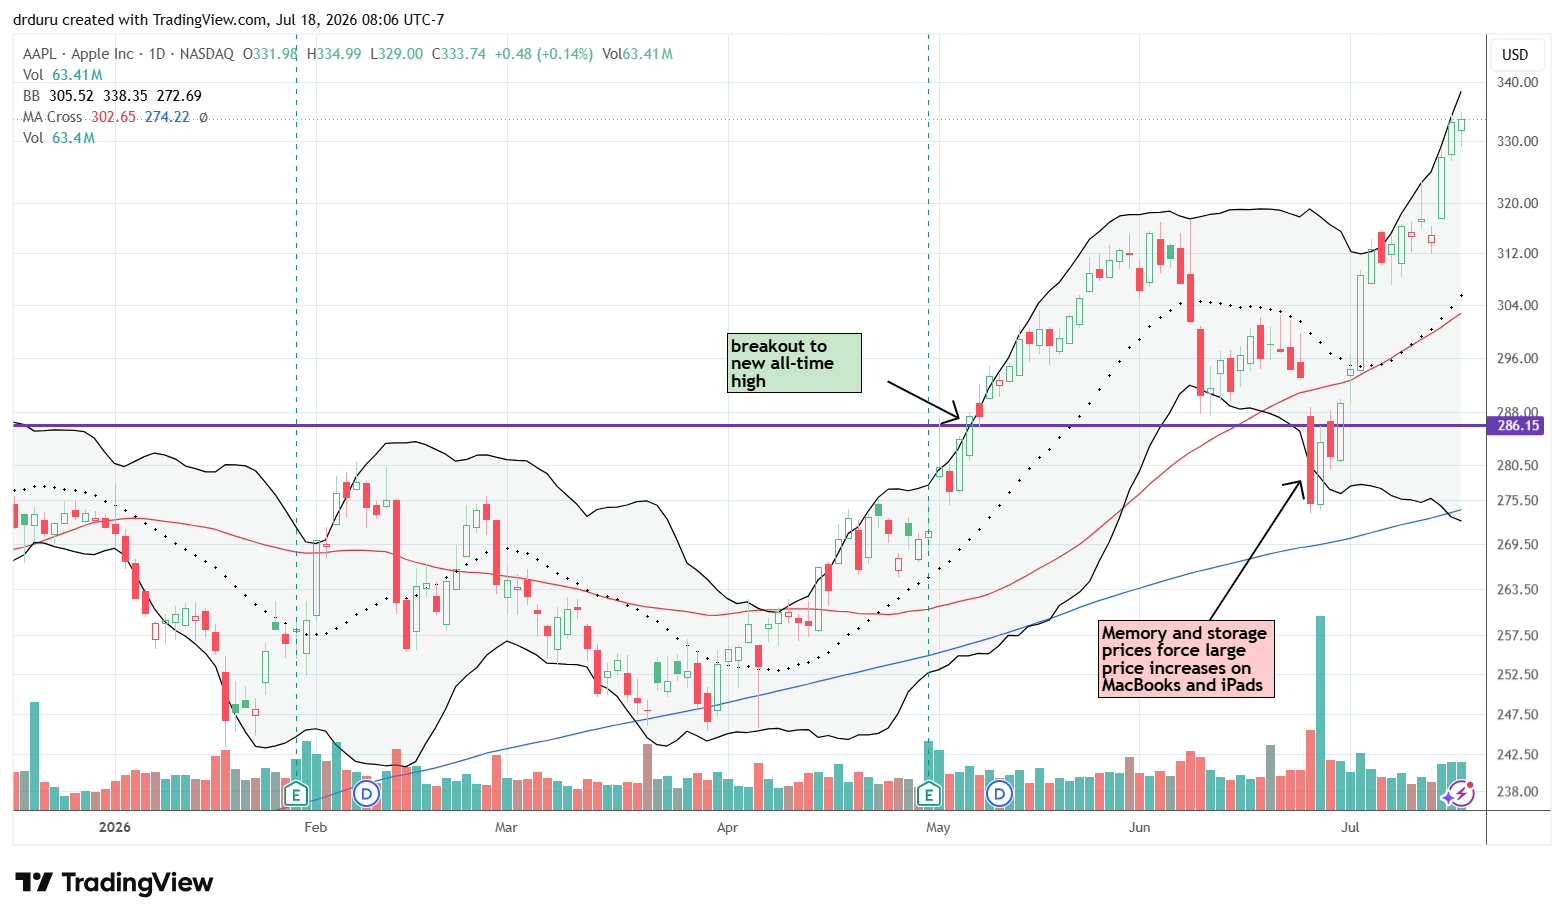
Technical status: Apple (AAPL) continued an exceptionally strong advance and reached fresh all-time highs after reversing sharply from an earlier selloff.
Trade commentary: It is remarkable how quickly sentiment reversed after the market initially reacted negatively to Apple’s memory and storage price increases. Buying pressure has been nearly relentless since that reversal. I am not interested in chasing AAPL at these levels because the stock has become expensive (for example, a PEG ratio of 3.3). However, it is worth noting that Apple has reclaimed leadership among the Magnificent Seven and briefly regained its position as the world’s largest publicly traded company.
Reddit (RDDT)
Description: Reddit, Inc. (RDDT) operates an online platform built around user-generated communities, discussions, advertising, and data licensing.
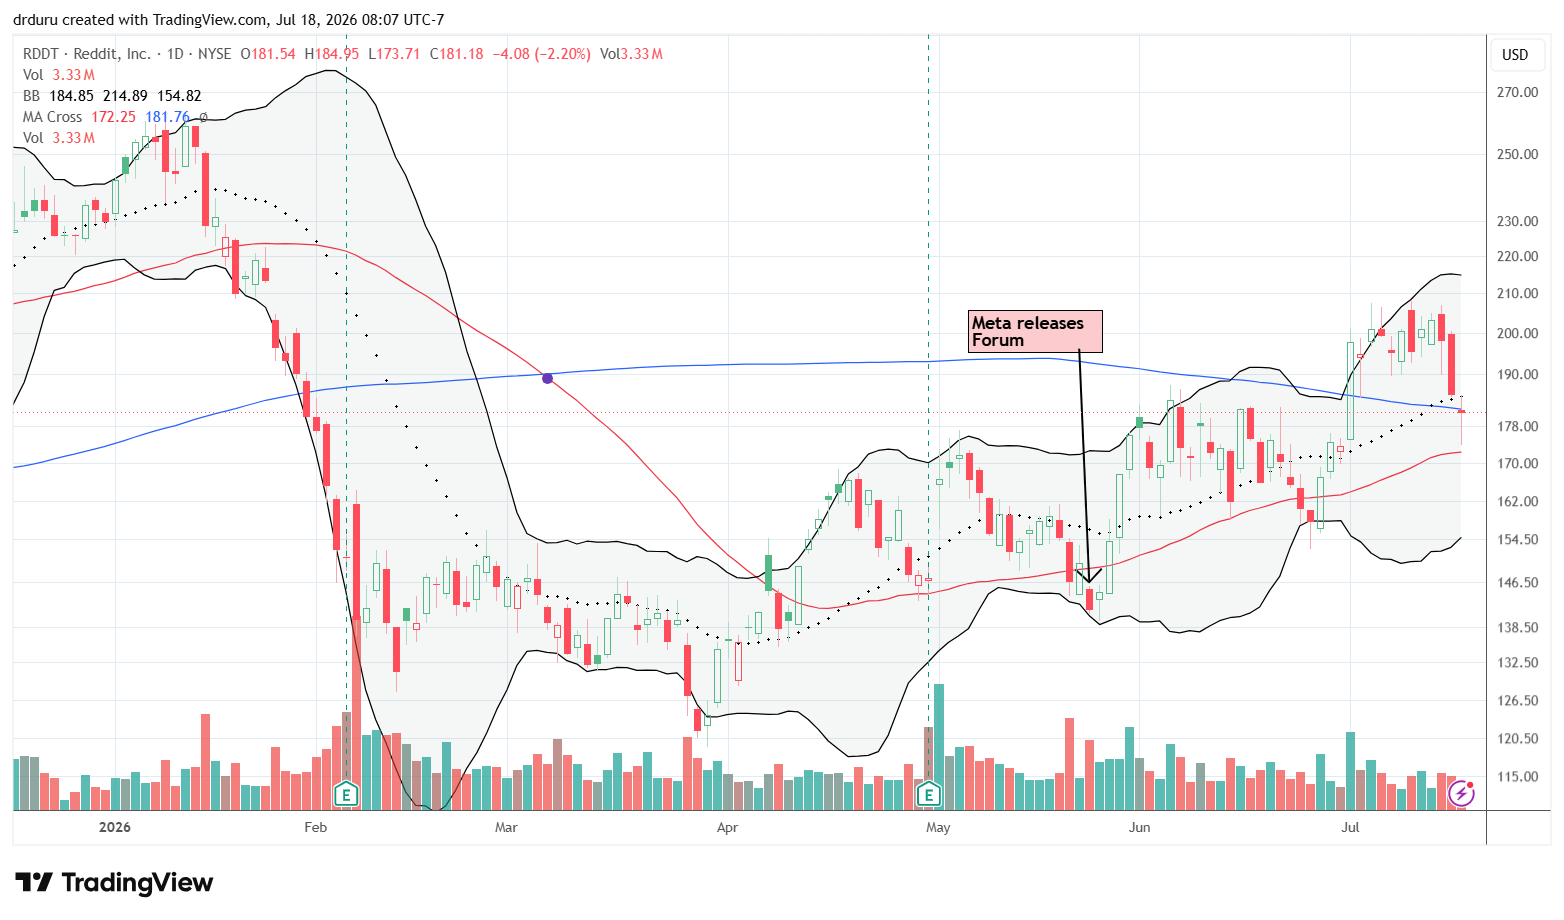
Technical status: Reddit (RDDT) tested its 200DMA as support while remaining above its 50DMA ahead of earnings.
Trade commentary: I am watching RDDT closely ahead of earnings. If the stock continues holding both major moving averages, I may speculate with a small share position because I believe another positive earnings reaction has a better-than-50/50 chance.
Thomson Reuters (TRI)
Description: Thomson Reuters Corporation (TRI) provides news, legal, tax, accounting, risk, compliance, and technology solutions for professionals.
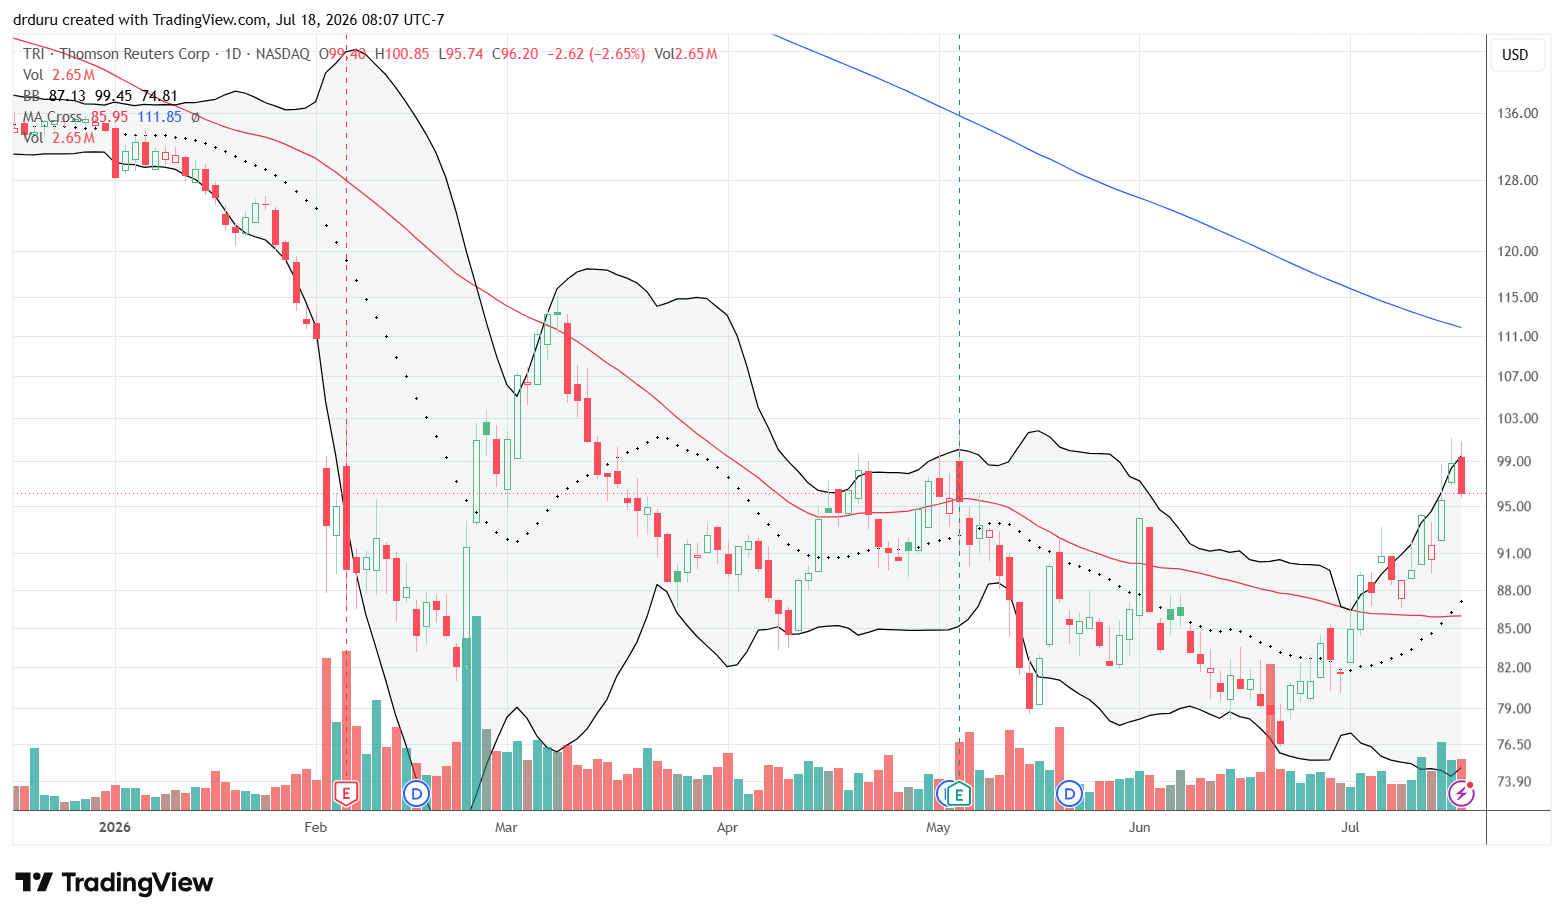
Technical status: Thomson Reuters (TRI) began stabilizing after a prolonged decline and broke above a smaller consolidation range while remaining inside a broader trading range.
Trade commentary: TRI recently appeared on my radar. I like the way the stock is beginning to bottom. If the stock moves above last week’s intraday high ($101.10), I plan to begin accumulating shares.
Caterpillar (CAT)
Description: Caterpillar Inc. (CAT) manufactures construction and mining equipment, diesel and natural gas engines, industrial turbines, and locomotives.
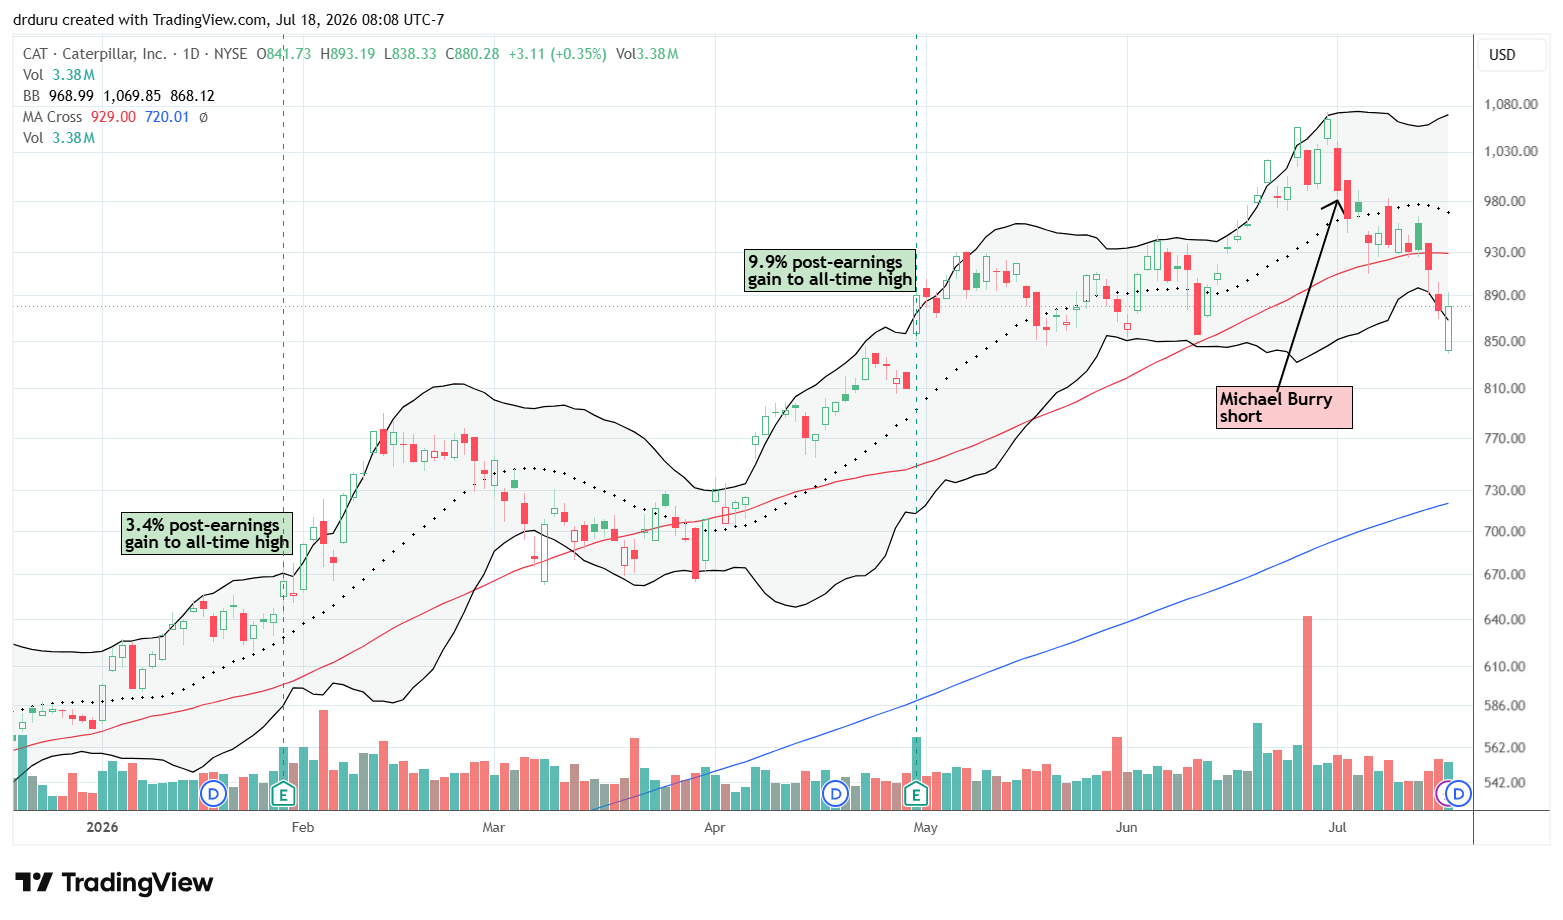
Technical status: Caterpillar (CAT) broke below its 50DMA and confirmed the breakdown with a large downside gap. CAT shifted into bearish territory.
Trade commentary: CAT has been a major disappointment. I tried fading Michael Burry’s short position when CAT tested its 50DMA because the technical picture appeared constructive at the time. Instead, the stock soon broke down decisively and now looks like it is joining many other AI-related names that are rolling over. Recall that CAT became an AI-related play given the need for heavy machinery for data center construction and power generators for quick and easy-to-access power.
C.H. Robinson Worldwide (CHRW)
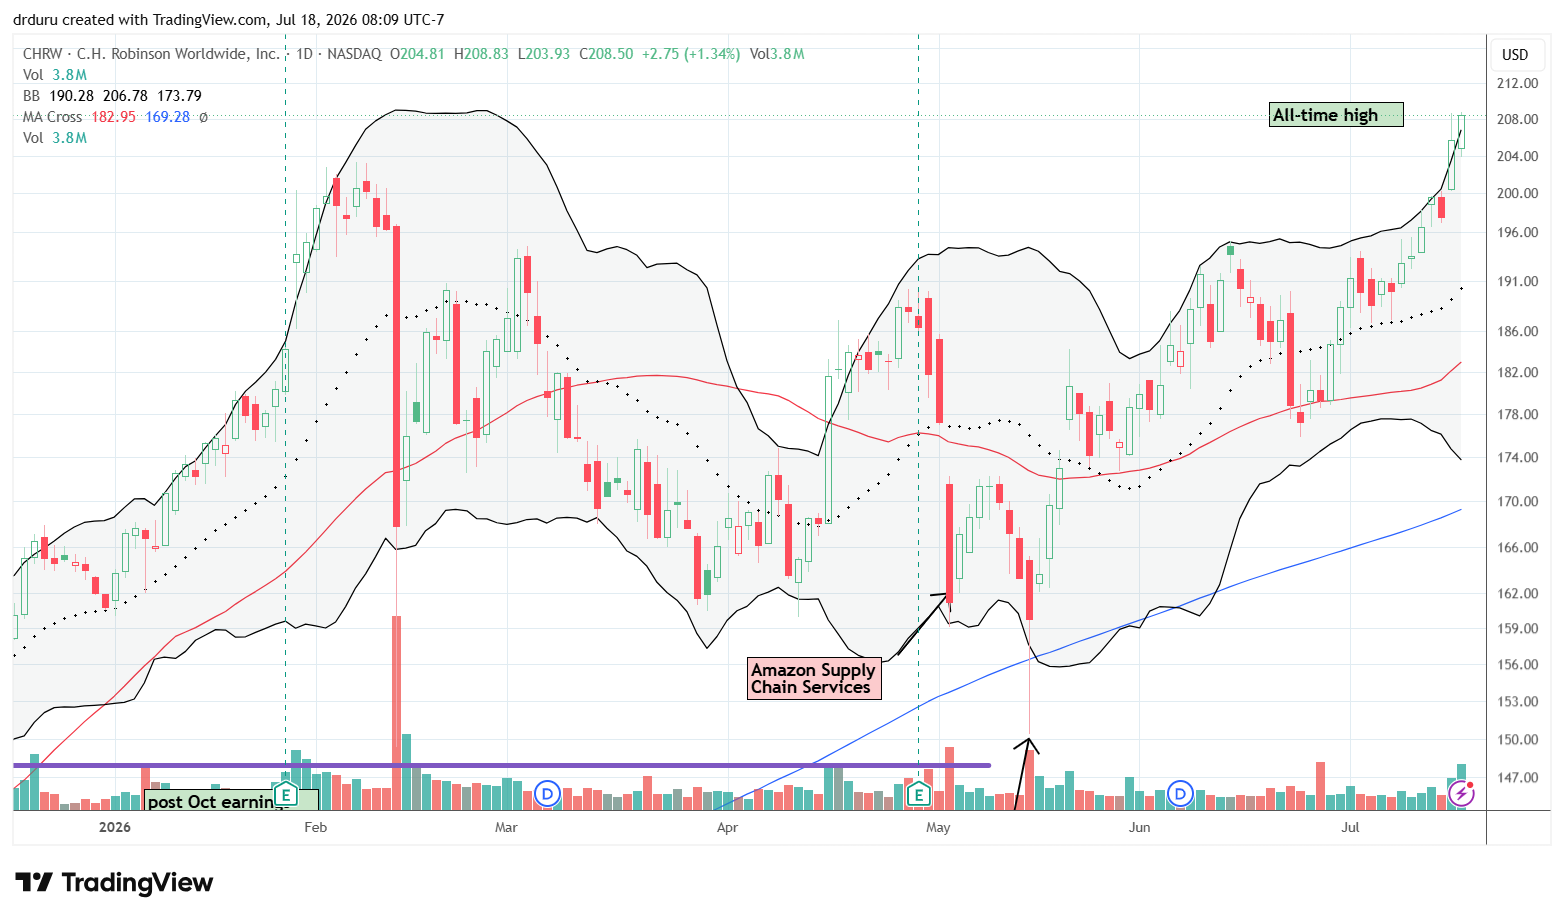
Description: C.H. Robinson Worldwide, Inc. (CHRW) provides freight transportation, logistics, and supply chain management services.
Technical status: C.H. Robinson Worldwide (CHRW) recovered from multiple panic-driven selloffs and reached a fresh all-time high.
Trade commentary: CHRW continues to remind me how panic can create buying opportunities. The AI-related panic, competitive concerns about Amazon’s logistics business, and even the Supreme Court-related selloff each marked a buying opportunity. Unfortunately, I never held the stock long enough to enjoy the full move. It is another reminder of the downsides of panic-selling a stock.
Cintas (CTAS)
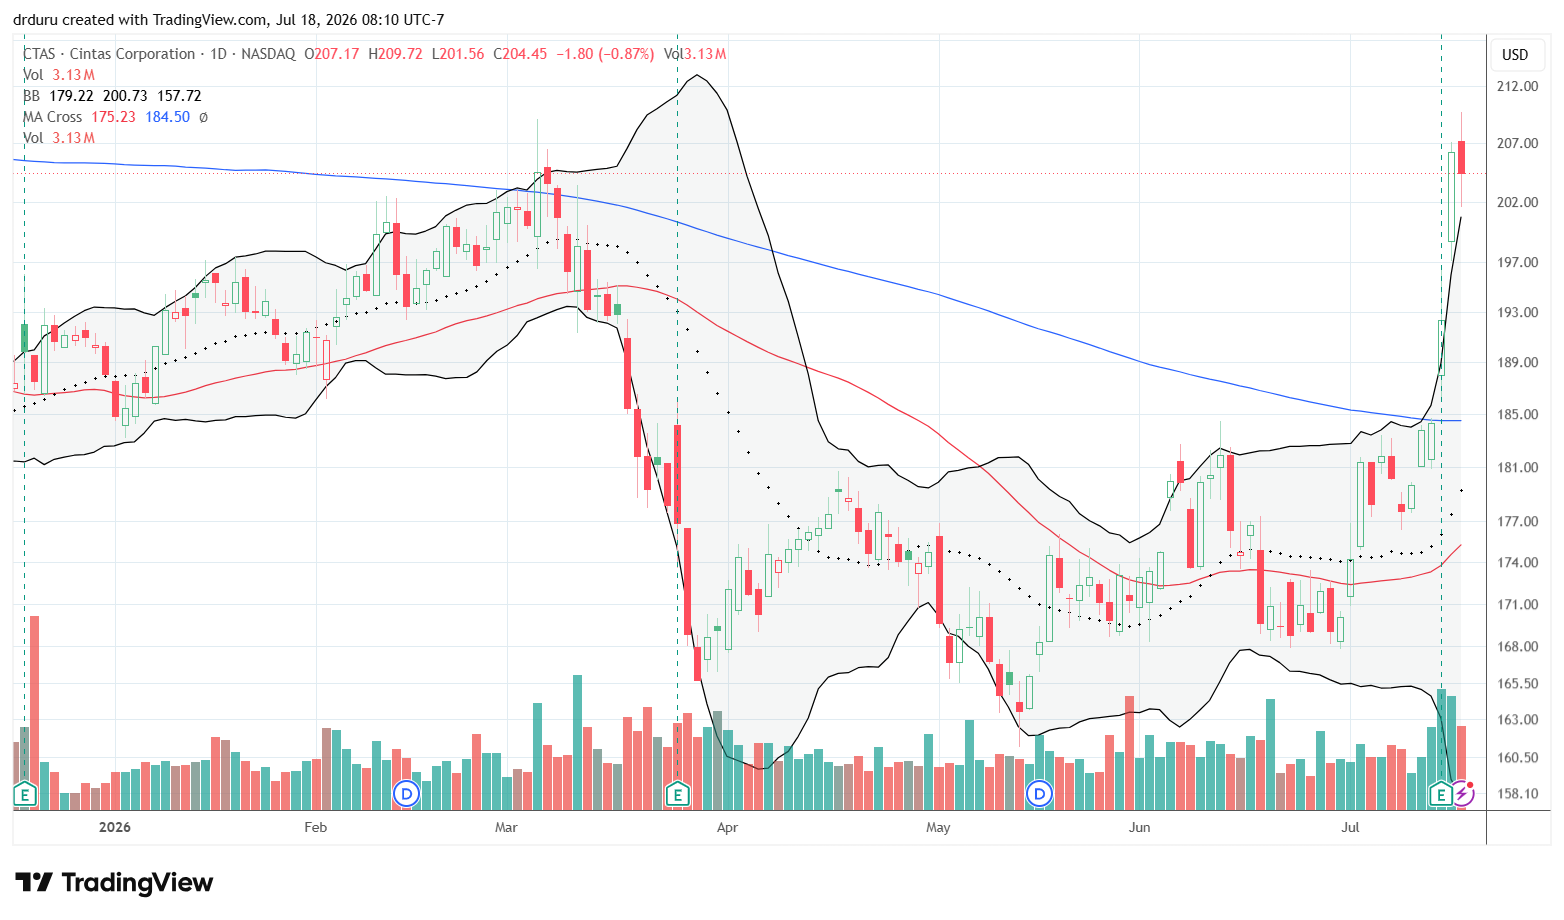
Description: Cintas Corporation (CTAS) provides uniforms, workplace safety products, facility services, and related business services.
Technical status: Cintas (CTAS) gapped above its 200DMA following earnings and continued climbing to new highs.
Trade commentary: I completely missed this buying opportunity. The stock’s steep post-earnings sell-off turned out to be the beginning of a bottom for CTAS. Now I need the stock to cool off from its parabolic post-earnings run-up
CarMax (KMX)
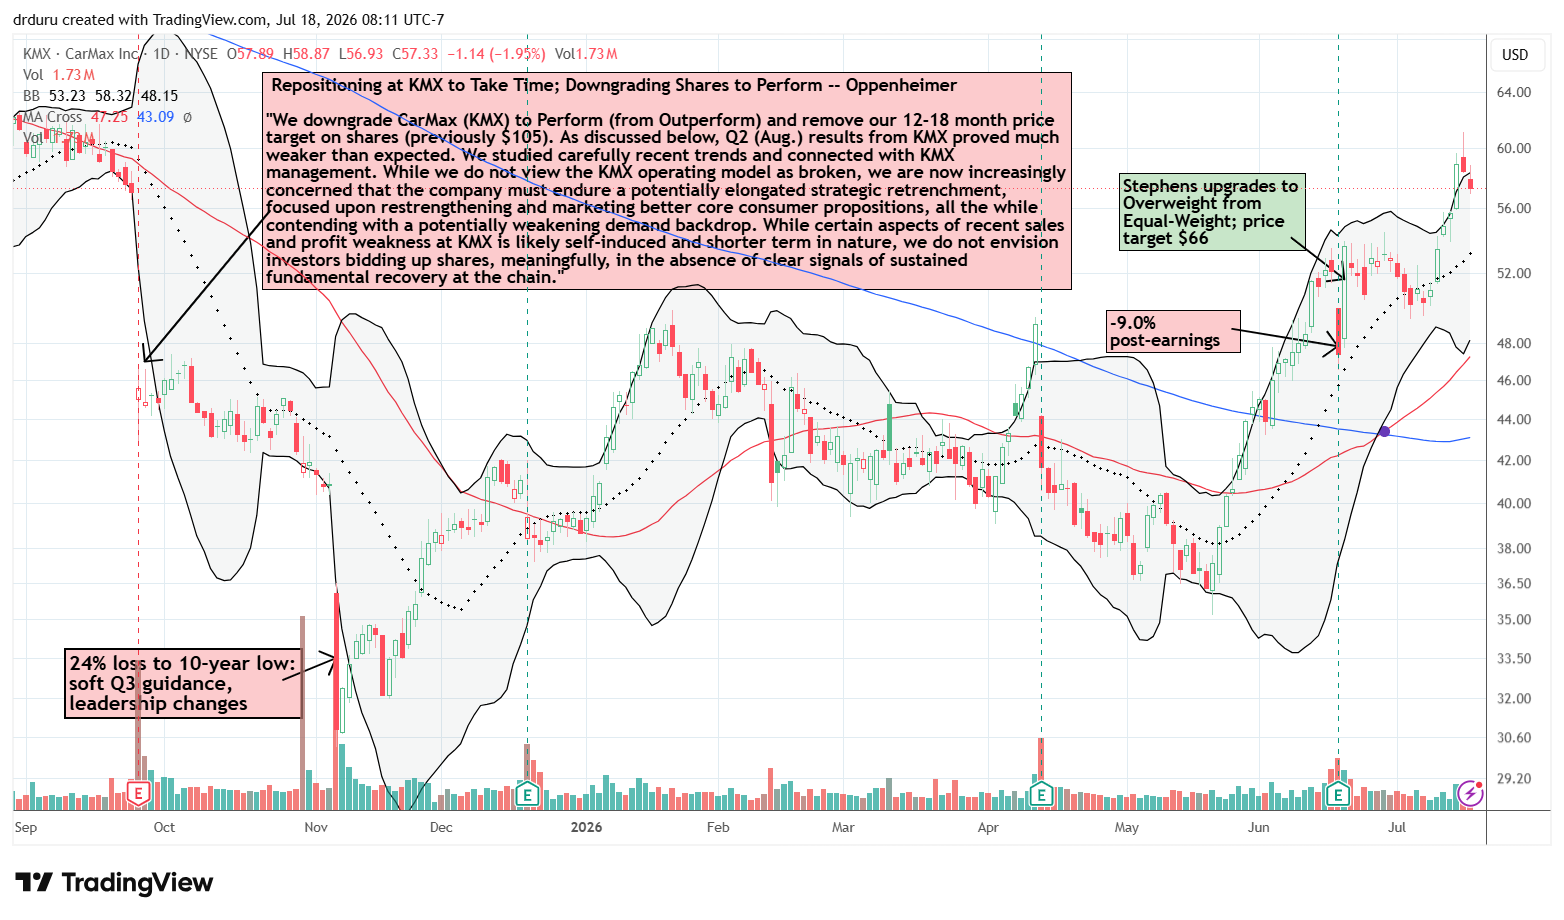
Description: CarMax, Inc. (KMX) operates a nationwide network of used vehicle dealerships and related financing services.
Technical status: CarMax (KMX) completed a full recovery from last year’s earnings decline and confirmed another bullish breakout.
Trade commentary: My hedge trade worked well, but I had to start buying shares higher than I hoped. The options position produced a solid profit, and I added a small share position as a breakout developed. The bullish case continues improving, and KMX has now completed a full reversal of last year’s earnings-driven decline.
Lucid Group (LCID)
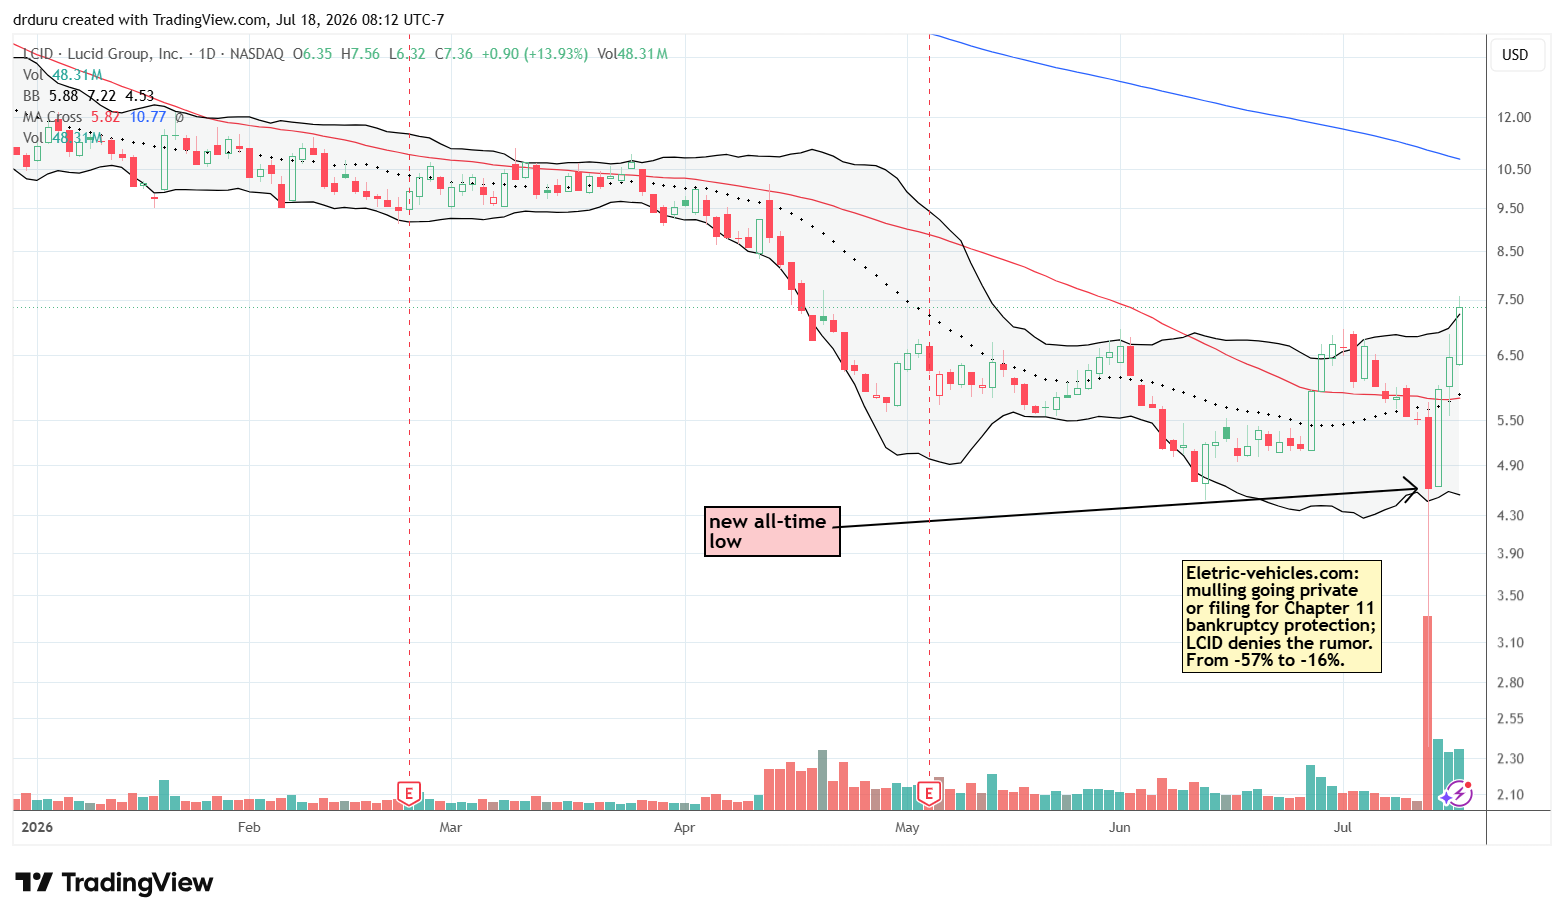
Description: Lucid Group, Inc. (LCID) designs, manufactures, and sells luxury electric vehicles and related technologies.
Technical status: Lucid (LCID) experienced an extraordinary volatility event on bankruptcy rumors before producing multiple consecutive strong advances on exceptionally heavy volume. The stock established a higher high for the first time in a long while.
Trade commentary: LCID produced the wildest move of the week. After electric-vehicles.com suggested the company was considering going private or filing for bankruptcy, the stock collapsed over 50%. Management denied the report the same day, and buyers immediately stepped in and limited the day’s loss to 16.2%. The following sessions produced what looked like an enormous short squeeze. I still do not have confidence in the company’s business operations, particularly after the reverse split and subsequent decline, but the technical picture has improved enough that I may be willing to trade the stock if the setup continues strengthening.
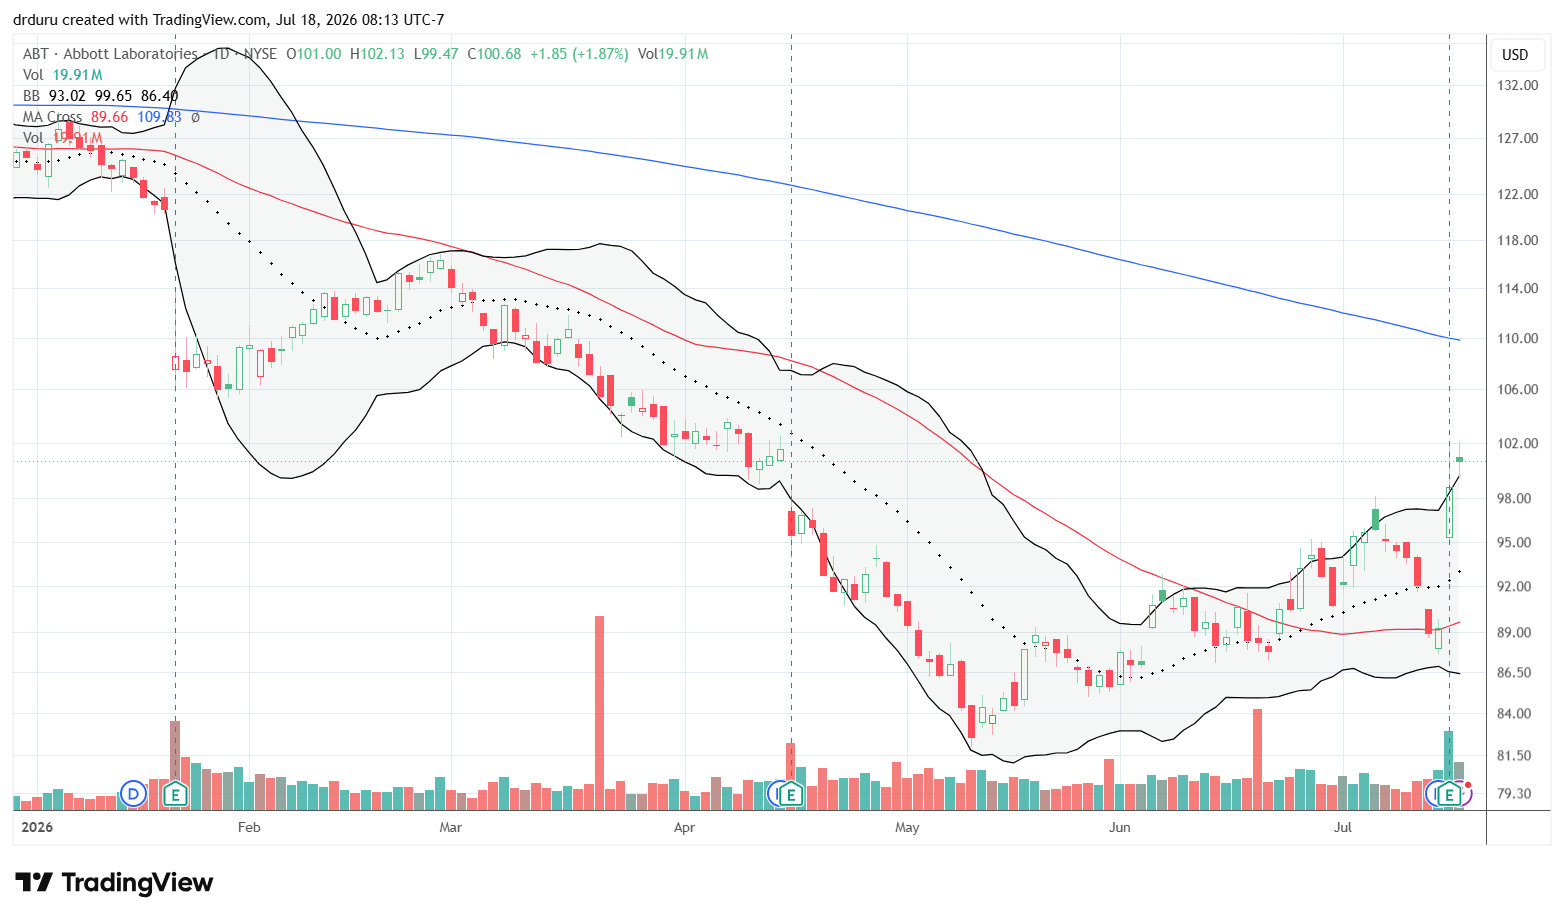
Abbott Laboratories (ABT)
Description: Abbott Laboratories (ABT) develops and manufactures medical devices, diagnostics, nutrition products, and branded generic pharmaceuticals.
Technical status: Abbott Laboratories (ABT) rallied strongly after earnings and extended the move into Friday, although the longer-term chart remained in a broad base.
Trade commentary: ABT has spent several years going essentially nowhere, so the earnings rally alone does not convince me the longer-term picture has changed. Even so, it appears a recovery process has finally begun. I will look for a pullback before beginning to accumulate shares.
iShares MSCI Brazil ETF (EWZ)
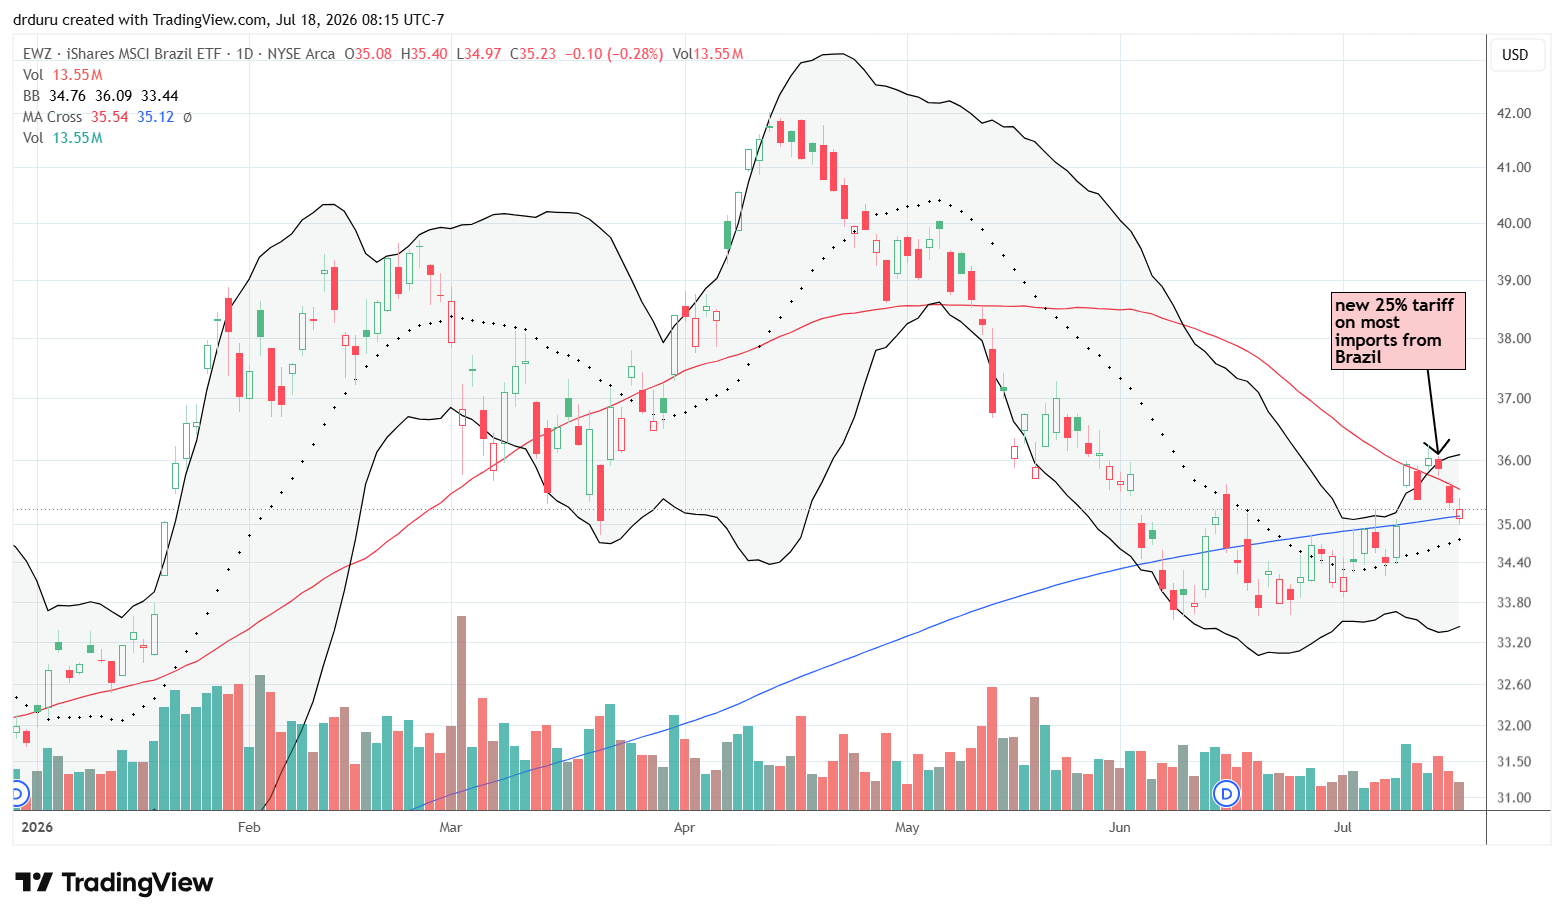
Description: iShares MSCI Brazil ETF (EWZ) seeks to track the investment results of an index composed primarily of large- and mid-cap Brazilian equities.
Technical status: EWZ broke above its 50DMA before pulling back modestly. The ETF remained in a developing recovery.
Trade commentary: I follow a simple 20% rule for EWZ. Whenever the ETF declines roughly 20% from its previous peak, I buy. I somehow missed the most recent signal until EWZ appeared as a CNBC Fast Money buy recommendation. Once I reviewed the chart, I realized I should have acted sooner. I started buying on the 50DMA breakout and plan to add more shares if the opportunity presents itself. Brazilian stocks may experience extended weakness given that the U.S. issued a punitive 25% tariff against the country’s exports to the U.S. on July 15.
Footnotes
Subscribe for free to get email notifications of future posts!
“Above the 50” (AT50) uses the percentage of stocks trading above their respective 50-day moving averages (DMAs) to measure breadth in the stock market. Breadth defines the distribution of participation in a rally or sell-off. As a result, AT50 identifies extremes in market sentiment that are likely to reverse. Above the 50 is my alternative name for “MMFI” which is a symbol TradingView.com and other chart vendors use for this breadth indicator. Learn more about AT50 on my Market Breadth Resource Page. AT200, or MMTH, measures the percentage of stocks trading above their respective 200DMAs.
Active AT50 (MMFI) periods: Day #247 over 20%, Day #74 over 30%, Day #70 over 40%, Day #25 over 50% (overperiod), Day #47 under 60%, Day #220 under 75%
Source for charts unless otherwise noted: TradingView.com
Full disclosure: long IWM calls, long EWZ, long DRAM, long SMH put spread, long RVI, long IONQ puts and calls, long KMX
FOLLOW Dr. Duru’s commentary on financial markets via StockTwits, BlueSky, and even Instagram!
*Charting notes: Stock prices are not adjusted for dividends. Candlestick charts use hollow bodies: open candles indicate a close higher than the open, filled candles indicate an open higher than the close.
* Blog notes: this blog was partially written based on the heavily edited transcript of the following video that includes a live review of the stock charts featured in this post. I used ChatGPT to process the transcript.