

The Market Breadth Summary
- Post-oversold trading conditions supported a buy dips approach after major indices rebounded above key moving averages.
- The S&P 500 and NASDAQ reversed much of their war-related damage, while the Russell 2000 remained technically stronger.
- Market breadth improved sharply, confirming a constructive shift in sentiment even as consolidation remained likely.
- Elevated oil prices, geopolitical risk, and earnings uncertainty limit near-term upside.
- Semiconductors and select cyclicals showed leadership positioned well for buying dips, while travel and software names displayed more fragile price action.
Stock Market Commentary
A week ago, I made the case that a bottom was finally forming after five weeks of selling. The ceasefire announcement that was supposed to reopen the Strait of Hormuz let buyers run free and confirm that bottom. Wednesday’s resulting gap up created post-oversold trading conditions that tell traders to buy dips from here. The psychology of the post-oversold period represents an assumption that the conditions that took the market down in the last cycle will not be the same catalyst that breaks those lows. The market will need to see news even worse than before to push through the previous lows. I am even assuming for now that critical support at 200-day moving averages (DMAs) will hold firm.
Going forward, I am also assuming further upside is limited until more positive catalysts arrive. Earnings week could deliver relief for individual stocks, but general macro conditions need to improve. For example, oil prices remain elevated. At the time of typing, peace talks in Pakistan have fallen apart, and the U.S. is threatening to blockade the Strait of Hormuz (in a strange double whammy for the global economy with Iran threatening destruction for most ships, and now the U.S. preventing the rest of ships from getting through). In the meantime, I fully expect small pullbacks and price consolidation.
The month of May also looms over the trading action. Several times, I have dismissed this adage as antiquated. Not only has May delivered substantial gains in recent years, but also the subsequent summer trading tends to deliver buyable sell-offs. With a post-oversold backdrop, traders who buy dips have better than usual risk/reward opportunities.
The Stock Market Indices
S&P 500 (SPY)
The S&P 500 (SPY) delivered a powerful move. On Wednesday, the index jumped 2.5% and cleared both 200DMA resistance (blue line) and 50DMA resistance (red line) in one impressive and bullish surge. The S&P 500 finished the week with a minor 0.1% pullback, a negligible move given the incline of the recovery. At this point, the S&P 500 has almost completely reversed its war-related losses, a quantifiable sign that the market has just about put the war in the rearview mirror.
Note carefully that the S&P 500 returned to the middle of its former trading range. The old rounded-top is invalidated, but the S&P 500 is likely to churn unless and until it makes a new all-time high. Even at that point, the breakout will likely be marginal and lead to another phase of price churn. Still, this market is a “buy dips” environment. I expect the 50DMA to hold as support on pullbacks. Even if the 50DMA fails, I still expect the 200DMA to hold. My bullish case breaks if the S&P 500 loses that 200DMA support.
")
NASDAQ (COMPQ)
The NASDAQ told the same broad story as the S&P 500 but looked even better. The tech laden index cleared both major resistance levels after stalling at 20DMA resistance, and it followed through with a 0.4% gain on Friday. Like the S&P 500, the NASDAQ has not quite reversed all of its war-related losses.
Note that the double top remains in place. Even so, the NASDAQ is no longer bearish. The downtrend that stretched from the double-top came to a definitive end with last week’s breakout. Just as with the S&P 500, I still expect a lot of price consolidation and back-and-forth action, but the trading psychology has changed with the post-oversold period. The NASDAQ is bullish until proven otherwise with a fresh 200DMA breakdown. Until then, I plan to buy dips.
")
iShares Russell 2000 ETF (IWM)
IWM was already in better technical condition than the other major indices because it had held 200DMA support during the March war period. The ETF of small caps next broke out above its 50DMA last week, which made the chart even more bullish.
I still expect IWM to churn like the other indices. I think there will be pullbacks, rebounds, and ongoing push-and-pull between bulls and bears. Note well that IWM is more extended than the other two indices since it closed at or above its upper Bollinger Band (BB) (the black line defining 95% of price volatility around the 20DMA – the dashed line).
Unfortunately, I did not have IWM calls in place ahead of the 3.0% gain and breakout. However, I did finally decide to take profits on my large core IWM position. Since I expect a sustained period of churn, I prefer to use those profits to buy dips in IWM down to 50DMA support and 200DMA support if the market gifts me such an opportunity. My new, full IWM strategy is still in development.
")
The Short-Term Trading Call With Buy Dips
- AT50 (MMFI) = 50.1% of stocks are trading above their respective 50-day moving averages
- AT200 (MMTH) = 52.6% of stocks are trading above their respective 200-day moving averages
- Short-term Trading Call: cautiously bullish
AT50 (MMFI), the percentage of stocks trading above their respective 50DMAs, closed the week at 50.1%. Wednesday’s expansion of market breadth that took AT50 from 38.5% to 49.8% validated my expectation that market breadth had made a bottom without dropping into the technical oversold territory below 20%. While the simultaneous breakouts across the indices are very bullish, I am leaving my short-term trading call at “cautiously bullish”. I will upgrade to bullish after the S&P 500 successfully tests support, whether at its 50DMA or 200DMA.
In the meantime, I expect AT50 to meander around 50% as the indices consolidate and whip around from additional news volatility, including news from earnings.
")
AT200, the percentage of stocks trading above their 200DMAs, cleared a major churn zone and closed at 52.6%. The move was constructive for long-term market breadth; I do not want to see AT200 fall back into that churn box. Unfortunately, AT200 ended the week with a bearish engulfing pattern where it gapped above the previous day’s candle only to close below the previous day’s candle. Thus, further upside is likely limited for the time being. A stall for AT200 would be consistent with my expectations for prices to consolidate.
Note how AT200 stalled below the previous support level from the S&P 500’s previous all-time high.
")
The volatility index (VIX) provided its own confirmation of a freshly bullish stock market. The VIX plunged on Wednesday by 18.3% and ended the week before the threshold of 20 that defines an elevated level. The VIX even finished reversing all its gains from the war against Iran. This reversal reinforces the psychology of post-oversold trading that is putting the war in the rearview mirror unless something materially worse happens. Again, this technical milestone does not mean the stock market just keeps rallying from here. Instead, it means that the recent bottom received a strong confirmation signal that tells traders to buy dips from here.
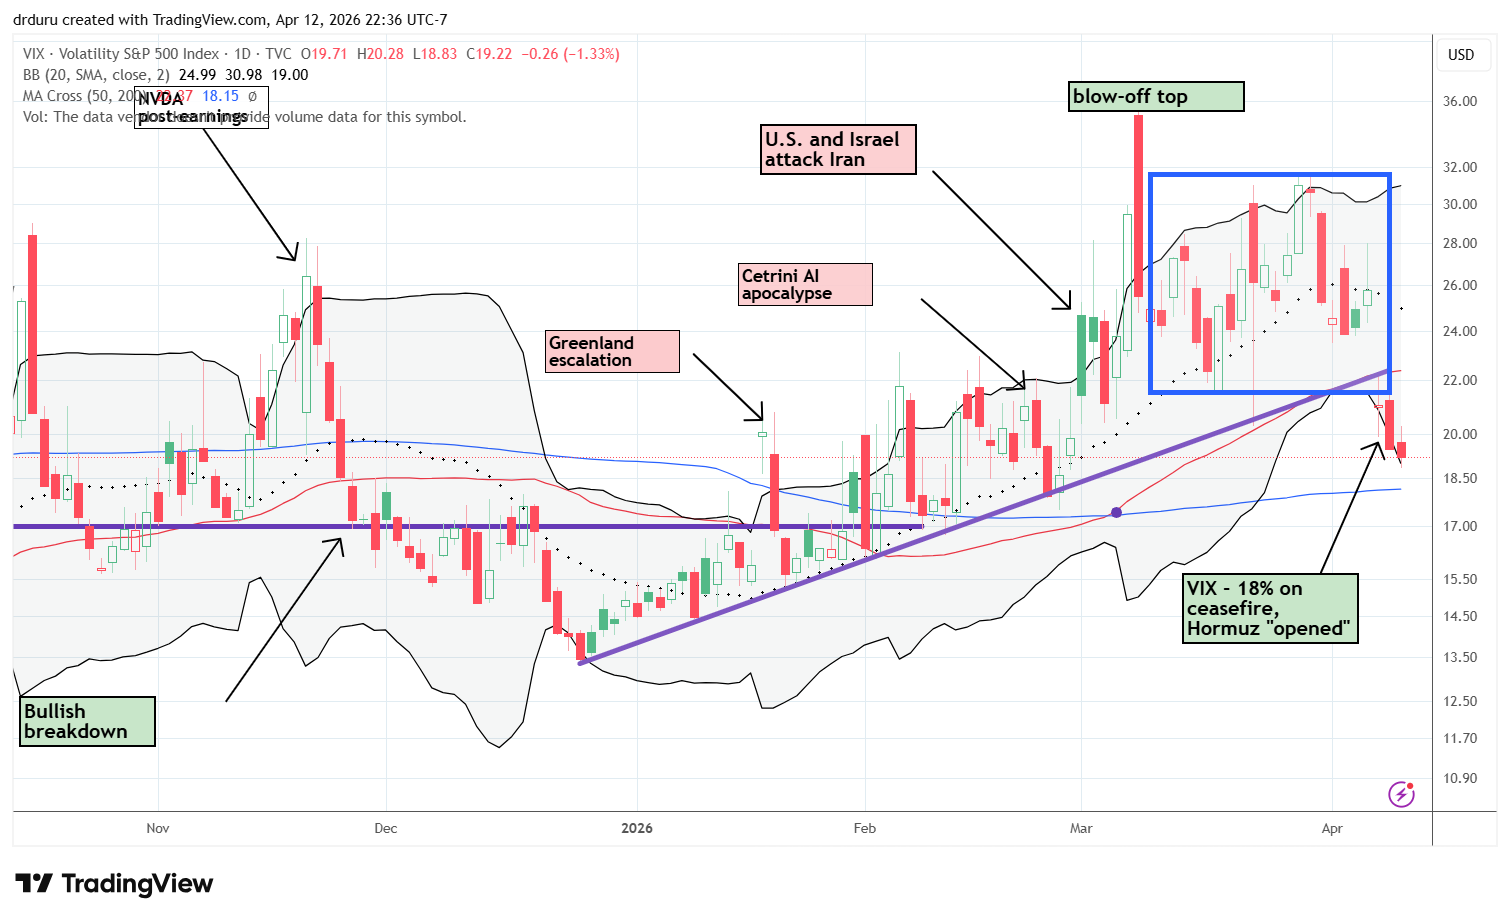
Also note how the blow-off top from March 9th held as the intraday high even as the VIX made a new closing high on March 27th.
In case you missed it…
I focused on the VIX to explain how it confirmed a market bottom. I also introduced the launch of PAIROS (Panic AI Research On Software) which I will formally use to analyze the impact of the latest AI news on software stocks. My first example worked with a very short shelf life, and I will do additional runs to refine the model and to better understand the news surrounding Anthropic’s cybersecurity breakthrough with Project Glasswing and Mythos.
The Stocks and ETFs
United States Oil Fund (USO)
Description: The United States Oil Fund, LP is an exchange-traded security designed to track the daily price movements of light, sweet crude oil.
Technical status: United States Oil Fund (USO) dropped almost 10% on the ceasefire news, falling away from its 6 year high and dropping down to its 20DMA.
Trade commentary: USO provided a clear sign that the market is ready to move on. Oil prices stayed elevated, and yet stocks stayed elevated too. While USO rallied intraday and gained the following day, stocks held their ground. Note, however, that USO successfully defended support at its 20DMA uptrend.
")
VanEck Semiconductor ETF (SMH)
Description: VanEck Semiconductor ETF seeks to replicate as closely as possible, before fees and expenses, the price and yield performance of the MVIS US Listed Semiconductor 25 Index, which is intended to track the overall performance of companies involved in semiconductor production and equipment.
Technical status: The VanEck Semiconductor ETF (SMH) jumped 11.4% in the week, breaking out above its 50DMA and reaching a new all-time high.
Trade commentary: Semiconductors were the biggest beneficiaries of the breakout and recovery. SMH gained 11% for the week including Wednesday’s 5.8% surge and subsequent all-time high. This strength puts SMH and many of its components right in the middle of a buy dips post-oversold trading strategy. Note that I promptly took profits in SMH after the mid-week breakout.
")
Intel (INTC)
Description: Intel Corporation designs and produces central processing units (CPUs) for computers. The company provides products and services in computing, cloud networking, and AI technologies for business and consumer markets.
Technical status: Intel Corp (INTC) broke out above its 50DMA, reaching a 4-year high and moving along its upper Bollinger Band.
Trade commentary: INTC was my biggest miss of the week. While INTC was on my shopping list for 2026, a stumble in January and a subsequent near 3-month trading range lulled me to sleep. I did not have price alerts in place when INTC bounced off 20DMA support and next confirmed a 50DMA breakout. Even with the stock at its upper Bollinger Band, I should have started buying. Now, INTC is over-extended with seven straight days closing at or above its upper Bollinger Band. Now I must wait patiently for an opportunity to buy dips.
")
Micron Technology (MU)
Description: Micron Technology designs and manufactures semiconductor memory and storage products, including DRAM, NAND flash memory, and solid-state storage solutions for consumer, industrial, automotive, and data center markets.
Technical status: Micron Technology Inc (MU) jumped back above its 50DMA, confirming another breakout. While no longer bearish, MU’s double top still remains in place.
Trade commentary: Despite the bullish breakout for SMH, MU still has overhead resistance from its double top (pictured below). Still, MU is bullish by virtue of its confirmed 50DMA breakout and is on track to reverse the post-earnings loss that confirmed the double top.
")
Industrial Select Sector SPDR Fund (XLI)
Description: The Industrial Select Sector SPDR ETF seeks to provide investment results that, before expenses, correspond generally to the price and yield performance of the Industrial Select Sector Index.
Technical status: The State Street Industrial Select Sector SPDR ETF (XLI) rebounded cleanly off 200DMA support, rising and confirming a 50DMA breakout.
Trade commentary: I am also watching industrials as part of this buy dips phase. I am in the red on a small XLI position and neglected to add to my holdings on the picture-perfect test of 200DMA support. I will buy dips going forward.
")
Expedia Group (EXPE)
Description: Expedia Group is an online travel technology company that operates a portfolio of travel brands and platforms offering lodging reservations, air travel bookings, vacation rentals, car rentals, cruises, travel packages, and related services for consumers and business partners worldwide.
Technical status: Expedia Group Inc (EXPE) jumped 5.6% after the ceasefire but faded hard from its intraday high, falling back below its converged 50DMA and 200DMA.
Trade commentary: EXPE is the kind of stock I should want to buy on good geopolitical news, but the stock faded sharply after Wednesday’s initial gap higher. EXPE even closed the week marginally below its converged moving averages. If EXPE breaks down further, I will become freshly wary of consumer facing names, especially those directly sensitive to oil prices. On the other hand, I want to buy a bounce from current levels.
")
U.S. Global Jets ETF (JETS)
Description: The U.S. Global Jets ETF provides investors access to the global airline industry, including airline operators and manufacturers from all over the world.
Technical status: The US Global Jets ETF (JETS) gapped higher on Wednesday, faded sharply, and eventually closed below 200DMA support.
Trade commentary: JETS confirmed the behavior in EXPE. The resilience during the oil price spike was impressive, but the fade after the ceasefire greatly reduced the luster. If JETS breaks below the consolidation area around $25.80, then travel-related stocks, especially airlines and anything heavily exposed to oil, drop from my list. There is no reason to fight those signals when so many other parts of the market, especially semiconductors, look stronger. Note well, JETS faded from 50DMA resistance, a bearish sign.
")
Brinker International (EAT)
Description: Brinker International is a casual dining restaurant company that owns, operates, develops, and franchises restaurant brands, primarily Chili’s Grill & Bar and Maggiano’s Little Italy, serving customers through company-owned locations, franchised restaurants, and digital ordering channels.
Technical status: Brinker International Inc (EAT) broke out above both its 200DMA and 50DMA, remaining in a bullish area.
Trade commentary: I am using EAT as a gauge for both speculation and consumer sentiment. Unlike the travel names, EAT actually did clear resistance and hold it. Still, the stock does not get an all clear for buying until it can hurdle the prior peak around $171.
")
Abercrombie & Fitch Co. (ANF)
Description: Abercrombie & Fitch Co. is a specialty apparel retailer that sells casualwear, accessories, personal care products, and related merchandise through its brands Abercrombie & Fitch, abercrombie kids, Hollister, and Gilly Hicks through stores and e-commerce channels worldwide.
Technical status: Abercrombie & Fitch Co (ANF) broke out above its 50DMA and confirmed that breakout even before the ceasefire news, rising to the February high.
Trade commentary: ANF is not a representative apparel stock, but I continue to track it ever since my last trade. The stock’s early breakout ahead of the ceasefire news puts ANF in an exceptionally bullish position. While Friday’s 4.9% pullback represents a serious setback to the bullish case, the stock will redeem itself on a successful bounce from converging support at its 20, 50, and 200DMAs. I will be a buyer on such a test of support.
")
UnitedHealth Group (UNH)
Description: UnitedHealth Group is a diversified healthcare company that provides health benefit plans, care delivery, pharmacy services, data analytics, and technology-enabled healthcare solutions through its UnitedHealthcare and Optum businesses, serving individuals, employers, governments, and healthcare providers.
Technical status: UnitedHealth Group Inc (UNH) surged 9% on reimbursement-related news, approaching its 200DMA.
Trade commentary: Healthcare surprisingly sold off in March along the rest of the market. UNH jumped a day before the ceasefire and may have sealed a recovery narrative for healthcare stocks. Note how the stock stalled perfectly under 200DMA resistance. So, I expect it to test support around $296 (see the purple line below) where I play to start buying. Even if that support breaks, converged and uptrending 20DMA and 50DMA support look ready to catch a further fall in UNH.
")
StoneX Group Inc. (SNEX)
Description: StoneX Group Inc. is an institutional-grade financial services franchise offering advanced digital platforms, end-to-end clearing and execution services, and global market expertise to clients worldwide.
Technical status: StoneX Group Inc (SNEX) broke out above its 50DMA and rose along its upper Bollinger Band, reaching a new all-time high.
Trade commentary: SNEX appeared on a bullish scan using Swingtradebot on February 9th. I held despite the war-related sell-off and added more shares when the stock seemed to stop short of 200DMA resistance. The stock bottomed ahead of the market and has shot nearly straight up since then. At a fresh all-time high, SNEX demonstrated the power of buying and sticking by stocks showing strength relative to the overall market. I plan to continue holding this stock unless it breaks down below the previous all-time high around $87. I fully expect the stock to cool off soon.
")
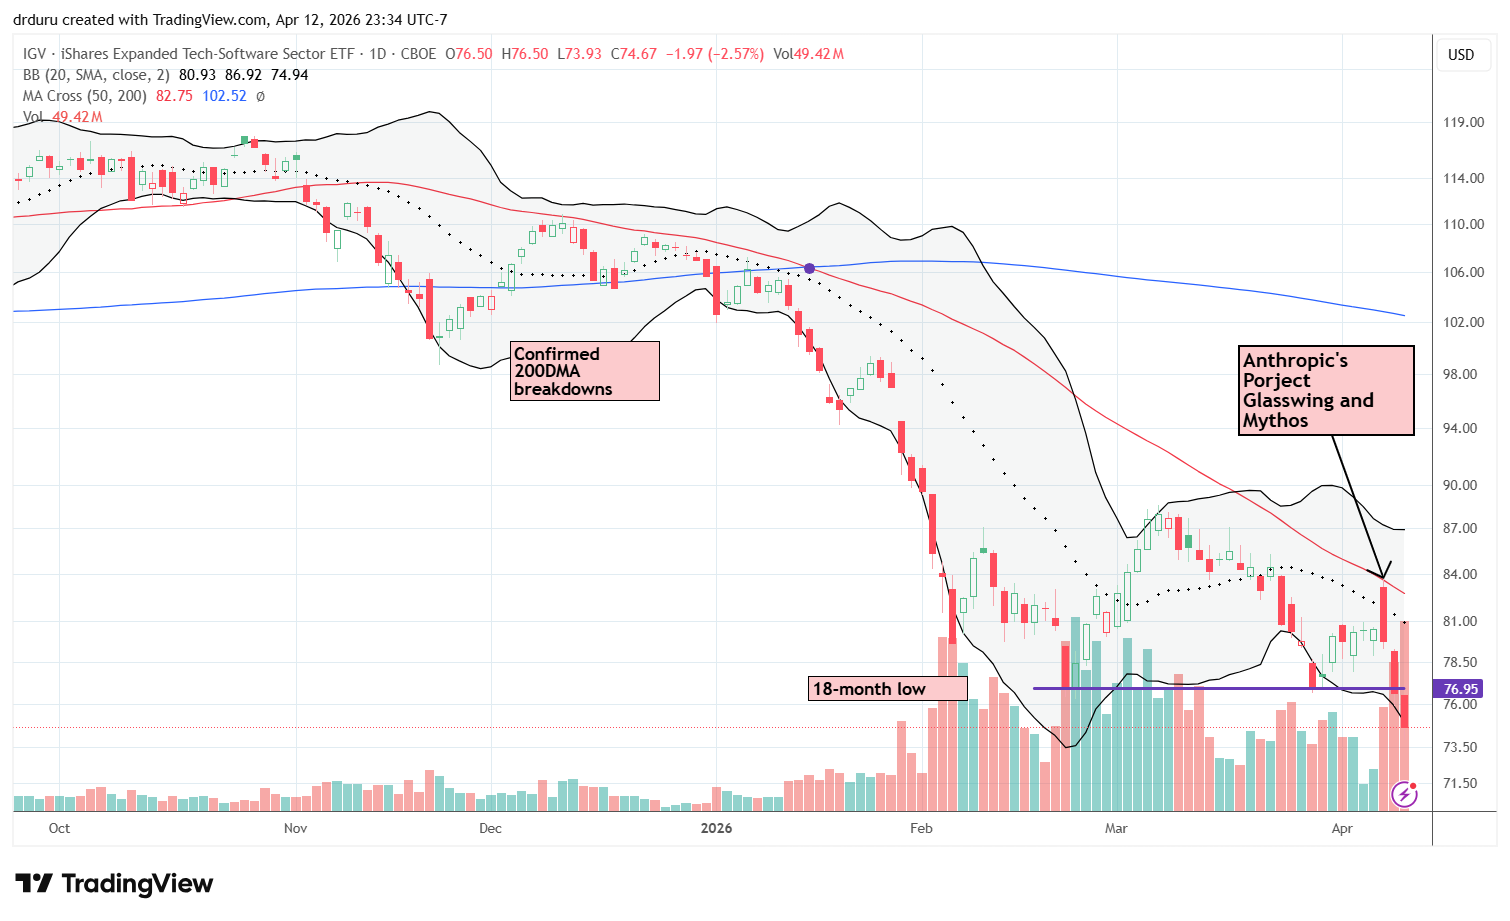
iShares Expanded Tech-Software Sector ETF (IGV)
Description: The iShares Expanded Tech-Software Sector ETF seeks to track the investment results of an index composed of North American equities in the software industry and select interactive media and services companies.
Technical status: The iShares Expanded Tech-Software Sector ETF (IGV) faded sharply from 50DMA resistance despite the ceasefire as Anthropic ignited a fresh AI Panic.
Trade commentary: My initial read of Anthropic’s Project Glasswing (Mythos) was a positive for cybersecurity stocks. The news was a perfect first test for my research model PAIROS. However, another day passed before I realized the tremendous negative for software stocks given a fresh specter looming over the industry. Now, unknown cybersecurity vulnerabilities are lurking to take down any of these businesses at any time until someone uses Mythos to both identify previously unknown vulnerabilities and fix them.
In the meantime, IGV failed spectacularly from downtrending 50DMA resistance and sold straight down to a near a near 2½-year low. IGV broke support that held in March at the 18-month low. Next approximate support is at the bottom of a trading range from 2023 around $66.
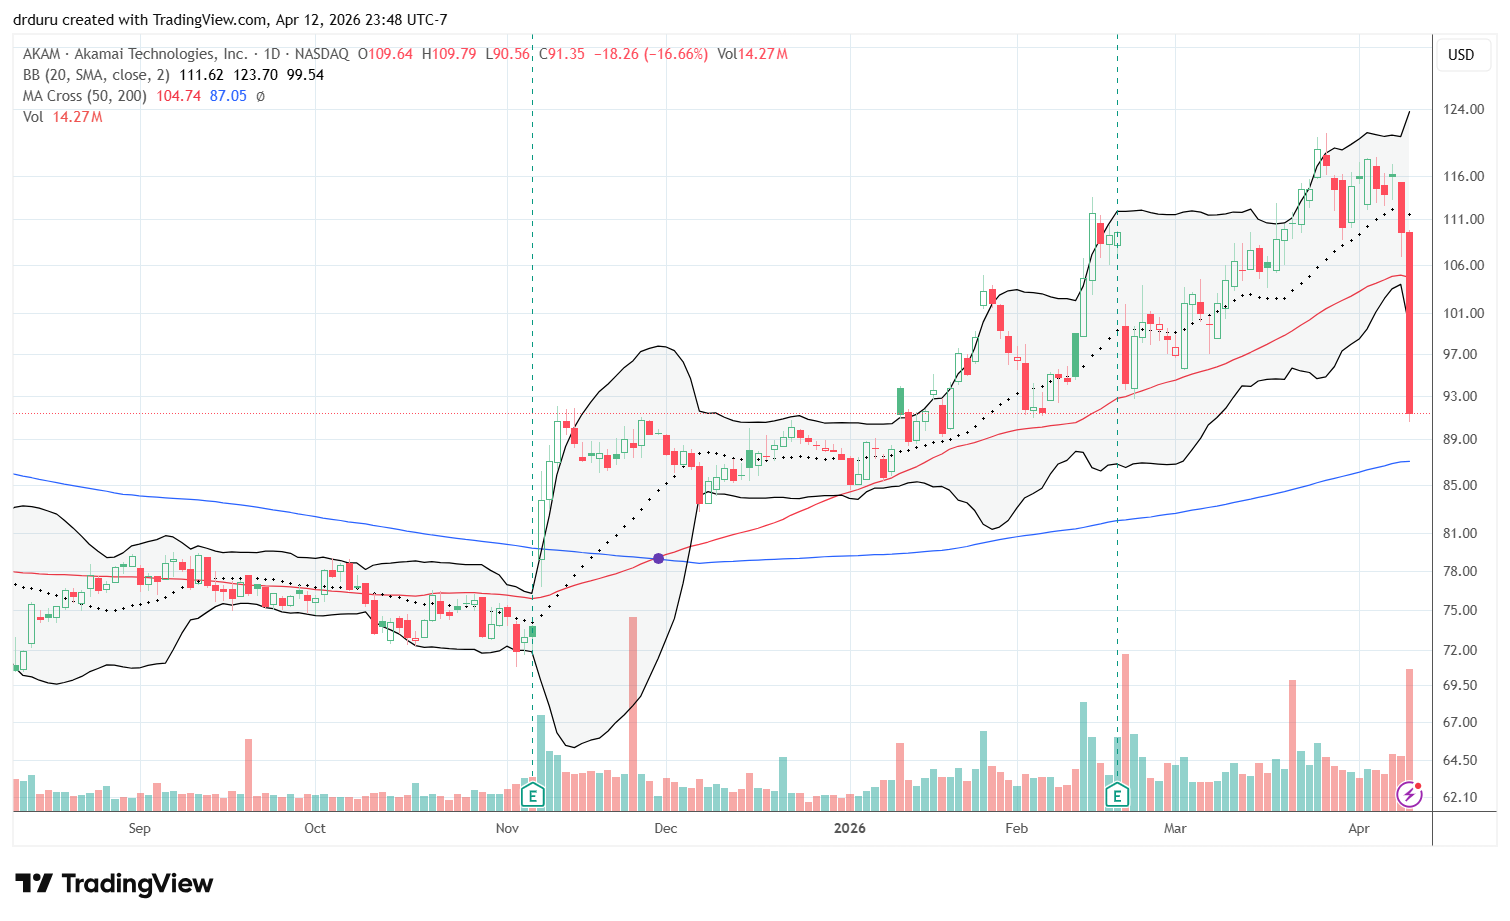
Akamai Technologies, Inc (AKAM)
Description: Akamai Technologies is a technology company that provides cloud computing, content delivery network (CDN), cybersecurity, and edge computing services that help enterprises deliver, secure, and optimize digital experiences and applications globally.
Technical status: AKAM accelerated into a 16.7% loss on Friday as the full weight of Mythos pressed down on the stock.
Trade commentary: AKAM is one of many stocks whose post-Mythos sell-off surprised me, especially in this case when the selling picked up momentum over a few days from the original press release. It seems many traders and investors needed time to fully panic about the latest AI-related developments. In the case of the CDNs, I can only assume the market is worried the cybersecurity vulnerabilities put at risk some of the core business models of the internet.
I last wrote about AKAM over a year ago as I lamented a 22% post-earnings plunge. Even after the CEO loaded up on shares, AKAM drifted downward for over 7 months. Now AKAM trades in that large post-earnings gap down.
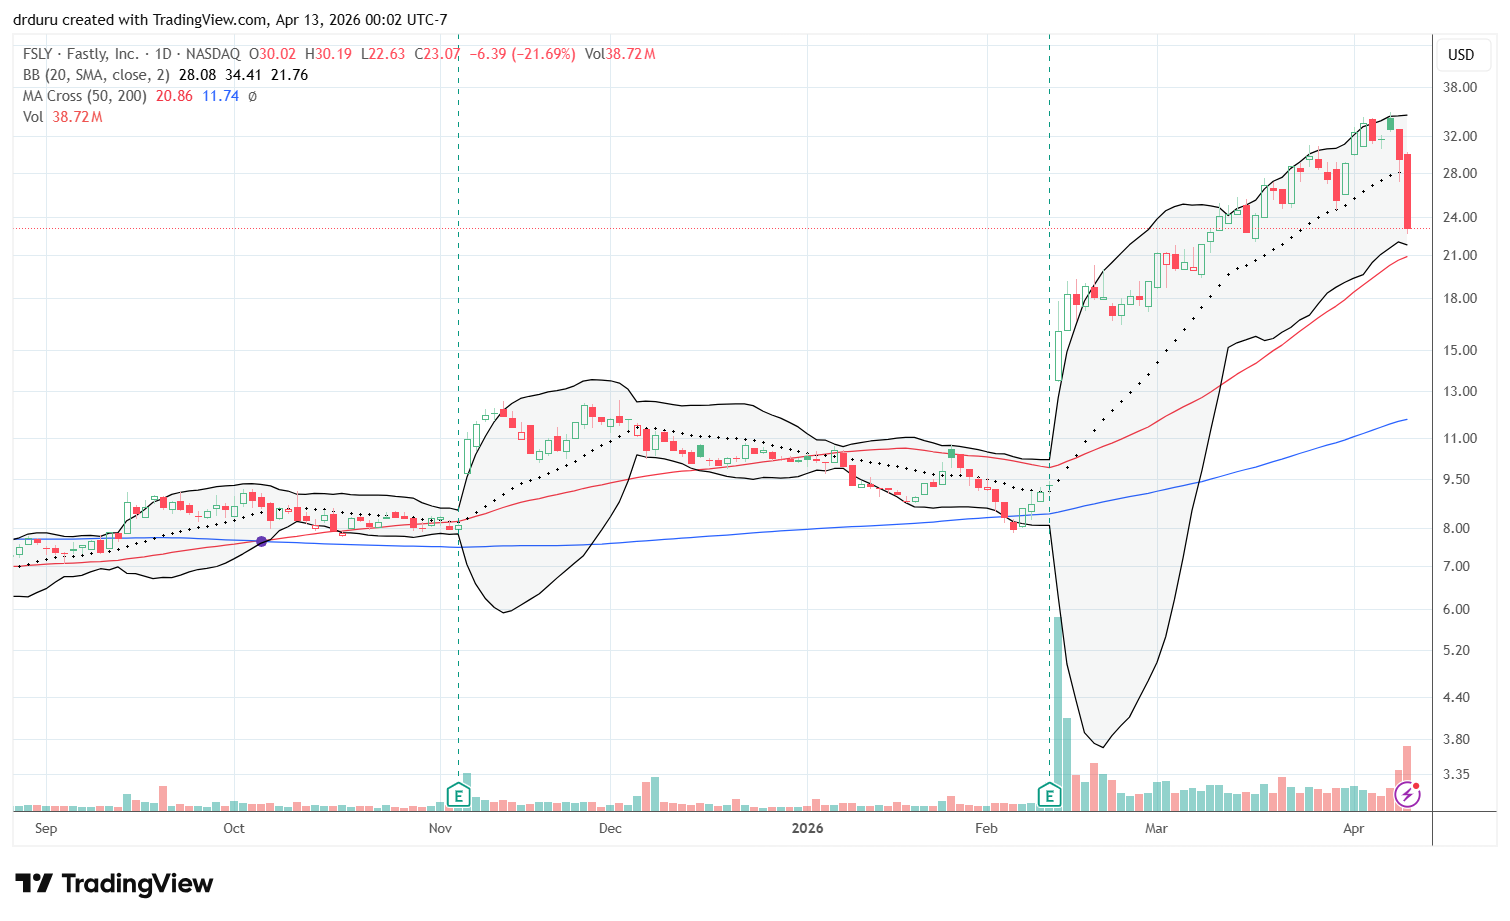
Fastly, Inc (FSLY)
Description: Fastly is a cloud platform company that provides edge computing, content delivery network (CDN), security, and observability services that help developers and enterprises deliver, secure, and optimize websites, applications, and digital experiences globally.
Technical status: Fastly, Inc (FSLY) crashed 21.7% in the wake of another AI Panic sparked by Anthropic.
Trade commentary: FSLY caught fire with investors and traders since a 72.3% post-earnings gain on February 12th. The stock continued to rally from there and more than doubled. FSLY has been so strong that Friday’s crash did not even bring the stock down to 50DMA support. I am watching closely to see how the stock fares on such a test.
Be careful out there!
Footnotes
Subscribe for free to get email notifications of future posts!
“Above the 50” (AT50) uses the percentage of stocks trading above their respective 50-day moving averages (DMAs) to measure breadth in the stock market. Breadth defines the distribution of participation in a rally or sell-off. As a result, AT50 identifies extremes in market sentiment that are likely to reverse. Above the 50 is my alternative name for “MMFI” which is a symbol TradingView.com and other chart vendors use for this breadth indicator. Learn more about AT50 on my Market Breadth Resource Page. AT200, or MMTH, measures the percentage of stocks trading above their respective 200DMAs.
Active AT50 (MMFI) periods: Day #180 over 20%, Day #7 over 30%, Day #3 over 40%, Day #2 over 50%, Day #27 under 60%, Day #153 under 70%
Source for charts unless otherwise noted: TradingView.com
Full disclosure: long SPY put spread, long SNEX, long USO puts, long XLI
FOLLOW Dr. Duru’s commentary on financial markets via StockTwits, BlueSky, and even Instagram!
*Charting notes: Stock prices are not adjusted for dividends. Candlestick charts use hollow bodies: open candles indicate a close higher than the open, filled candles indicate an open higher than the close.
* Blog notes: this blog was partially written based on the heavily edited transcript of the following video that includes a live review of the stock charts featured in this post. I used ChatGPT to process the transcript.