

The Market Breadth Summary
|
Stock Market Commentary
This week’s edition of The Market Breadth captures a market caught between momentum and hesitation. Small cap stocks led a strong market breadth breakout. Yet, market breadth faded just short of the overbought threshold. That reversal made for a week that was both encouraging and concerning. The year has started fast, and the pace is accelerating as headlines swirl and risks stack up. For those actively watching the markets, staying on top of positioning, trade selection, and overnight exposure has become essential amid growing headline risk.
We began last week grappling with geopolitical fallout from the U.S. invasion of Venezuela, the capture of the country’s president, and all the war-like rhetoric that followed. Meanwhile, the Consumer Electronics Show (CES) in Las Vegas put renewed focus on semiconductor stocks as drivers of AI-driven robots. Friday’s jobs report for December delivered mixed signals but appeared to have little market impact, while homebuilders stood out with a banner week. Looking ahead, earnings season ramps up with financials and airlines, December CPI will offer a fresh read on inflation, and multiple Federal Reserve speakers are on deck. Adding to the uncertainty, the Supreme Court delayed its ruling on tariffs, now expected midweek. Despite all of this swirl, small caps and the S&P 500 closed the first full trading week of the year at all-time highs.
The Stock Market Indices
S&P 500 (SPY)
The S&P 500 (SPY) gained 0.7% on Friday and closed at an all-time high. The index has consistently churned its way higher. The move is not like the melt-up from before October, but the index has been a lock to bounce back quickly from pullbacks. Since November’s bearish breakdown below its 50-day moving average (DMA) (red line), the index has steadied and used its 20DMA (the dashed line) as support. This positioning is a freshly bullish signal. I bought SPY call options on Friday after realizing that my trading portfolio had too may bearish positions after I took profits on most of my bullish positions (my short-term trading call remains neutral – see below).
")
NASDAQ (COMPQ)
The NASDAQ has also calmed down since the bearish November 50DMA breakdown, but the tech-laden index has yet to print a new all-time high. In fact, the NASDAQ is struggling to overcome its prior two highs. In other words, the NASDAQ has been flattening out within an overall uptrend.
")
iShares Russell 2000 ETF (IWM)
The iShares Russell 2000 ETF (IWM) was the big index of the week for me. IWM was the primary driver of the breakout of market breadth. The ETF of small caps neatly held 50DMA support in the prior week. The day following the 50DMA test, I took profits on my last tranche of IWM call options. However, I failed to jump back in as last week opened bullishly. Thus, I had an unusual week with no IWM calls in play. Of course, I am always good with a strong week for IWM given my large core position of shares.
")
The Short-Term Trading Call Despite Market Breadth Fades
- AT50 (MMFI) = 66.0% of stocks are trading above their respective 50-day moving averages
- AT200 (MMTH) = 62.6% of stocks are trading above their respective 200-day moving averages
- Short-term Trading Call: neutral
AT50 (MMFI), the percentage of stocks trading above their respective 50DMAs, closed the week at 66.0%. My favorite technical indicator started the week breaking out above the primary downtrend that bothered me for months. A pullback on Wednesday slowed the momentum briefly, but buyers pushed AT50 as high as 67.6% before fading. An earlier chart of AT50 showed a stronger fade than the final chart. So while the AT50 trading rules flag a bearish warning from this fade below the overbought threshold at 70%, I have to wait for more compelling evidence before flipping bearish. In the meantime, the market conditions look bullish otherwise. If technology stocks break out in the coming week, I fully expect a stronger test of overbought conditions. I am keeping the short-term trading call at neutral in anticipation of needing to downgrade in coming weeks.
I took profits on most of my trading positions, so I am positionally and mentally prepared to hold two truths at the same time: ongoing bullish momentum in the short-term and the expectation that a pullback is somewhere around the corner.
The percentage of stocks trading above their respective 200DMAs, AT200, experienced a very clean breakout. This longer-term indicator of the health of market breadth supports the bullish case. AT200 got to a 13-month high at one point.
The Equities: Fade
United States Oil Fund (USO)
Description: United States Oil Fund (USO) is an exchange-traded fund designed to track movements in oil prices through futures and related instruments.
Technical status: United States Oil Fund LP (USO) churned heavily through the week, eventually breaking out above its 50DMA but fading from 200DMA resistance.
Trade commentary: Venezuela was the big headline impacting oil prices, but the net impact so far has been minimal. USO’s breakout on Friday quickly faded. I am not interested in trading USO with looming headline risks. The oil market is so heavily manipulated that only a strong thesis is worth a trade, and I do not see a strong case from the technicals or fundamentals.
")
VanEck Semiconductor ETF (SMH)
Description: VanEck Semiconductor ETF (SMH) is an exchange-traded fund that holds a portfolio of semiconductor and semiconductor equipment companies.
Technical status: VanEck Semiconductor ETF (SMH) rose above the 20DMA, starting the year off strong with a new all-time high.
Trade commentary: The Consumer Electronics Show (CES) in Las Vegas put semiconductors in big focus. Chips are helping drive electronics full of AI-driven wonders. The trading during CES was not smooth but ended strongly. SMH started the week with a nice 1.1% breakout to a new all-time high, churned a lot from there, and then broke out to a new all-time high on Friday with a 2.7% gain. The close at the all-time high kept SMH solidly locked in as the core epicenter play for the AI runup.
")
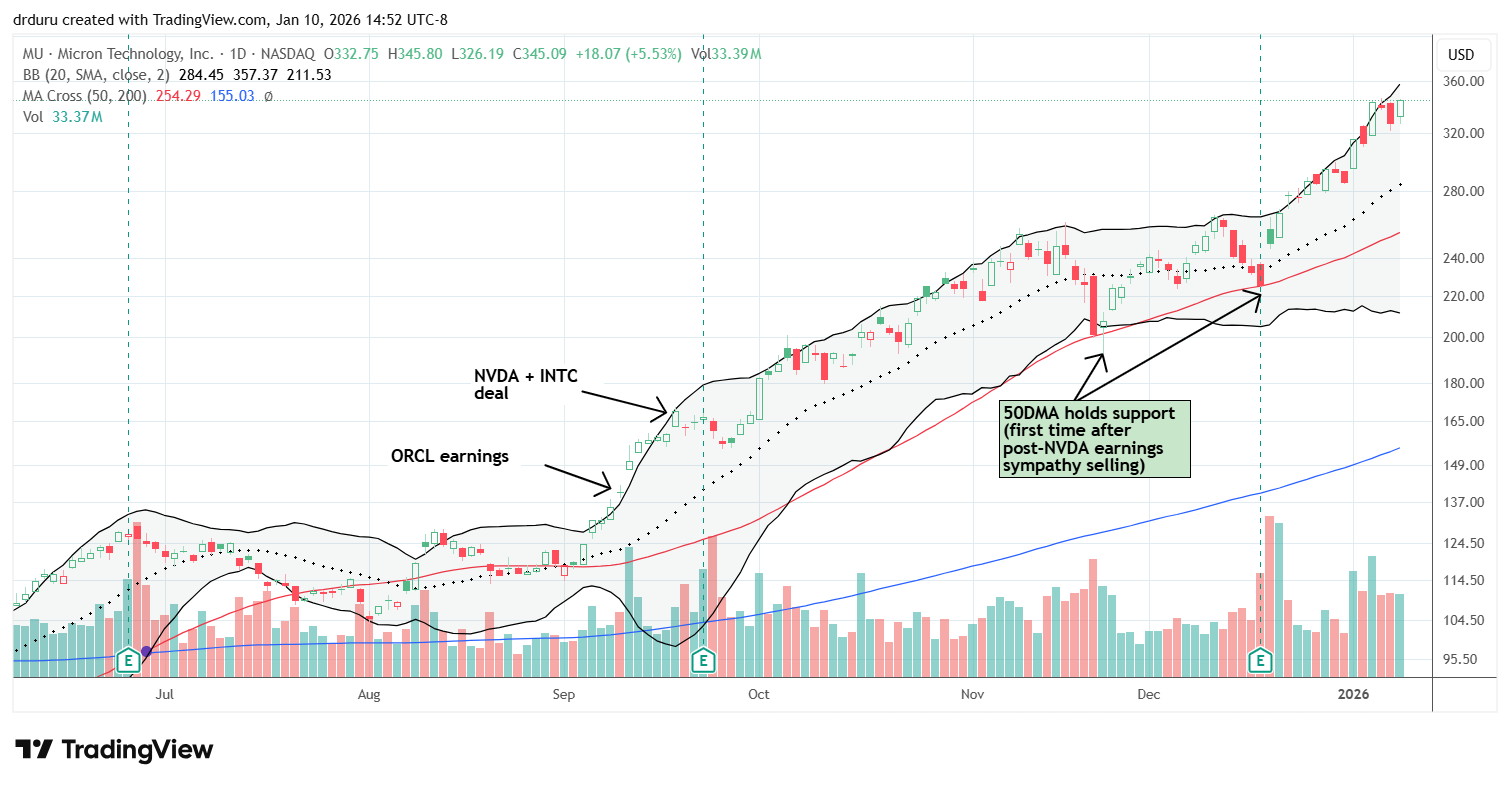
Micron Technology (MU)
Description: Micron Technology (MU) designs and manufactures memory and storage products including DRAM and NAND solutions.
Technical status: Micron Technology (MU) surged sharply to start the year, stayed technically overstretched, and rode along the upper Bollinger Band after holding prior 50DMA support.
Trade commentary: MU sits in the epicenter of SMH’s strength. The stock has soared out the gate this year with a 20.9% year-to-date gain. MU is not on a parabolic run, but the move still looks extended with the ongoing touches at the upper Bollinger Band (BB). I earned nice gains with two separate call spreads late last year, and I am itching to buy into the next dip to support at the 20DMA and/or the 50DMA. The 50DMA served as near picture-perfect support over the last two months.
Intel (INTC)
Description: Intel (INTC) designs and manufactures semiconductor products and related computing technologies.
Technical status: Intel (INTC) rallied sharply after a 50DMA breakout and surged almost 11% on Friday, returning to levels last seen in March 2024.
Trade commentary: INTC is on my list for what I want to buy in 2026. Like so much of my shopping list, INTC triggered on the first day of the year. I bought call options and soon added shares. I took profits on Wednesday as INTC soared into its previous high with a 6.5% gain on a positive reaction to Intel’s announcement of a core processor powering a humanoid robot. I am holding shares as long as I can. So far, so good with the stock soaring another 11% on Friday in the wake of news that the President talked to Intel’s CEO. The news did not explain the topics of conversation. The market liked the news anyway.
INTC is now right back to where it traded in March of 2024, a steep and impressive recovery mission. I do not think INTC can get much higher than 50 in the short term, but we will see…
")
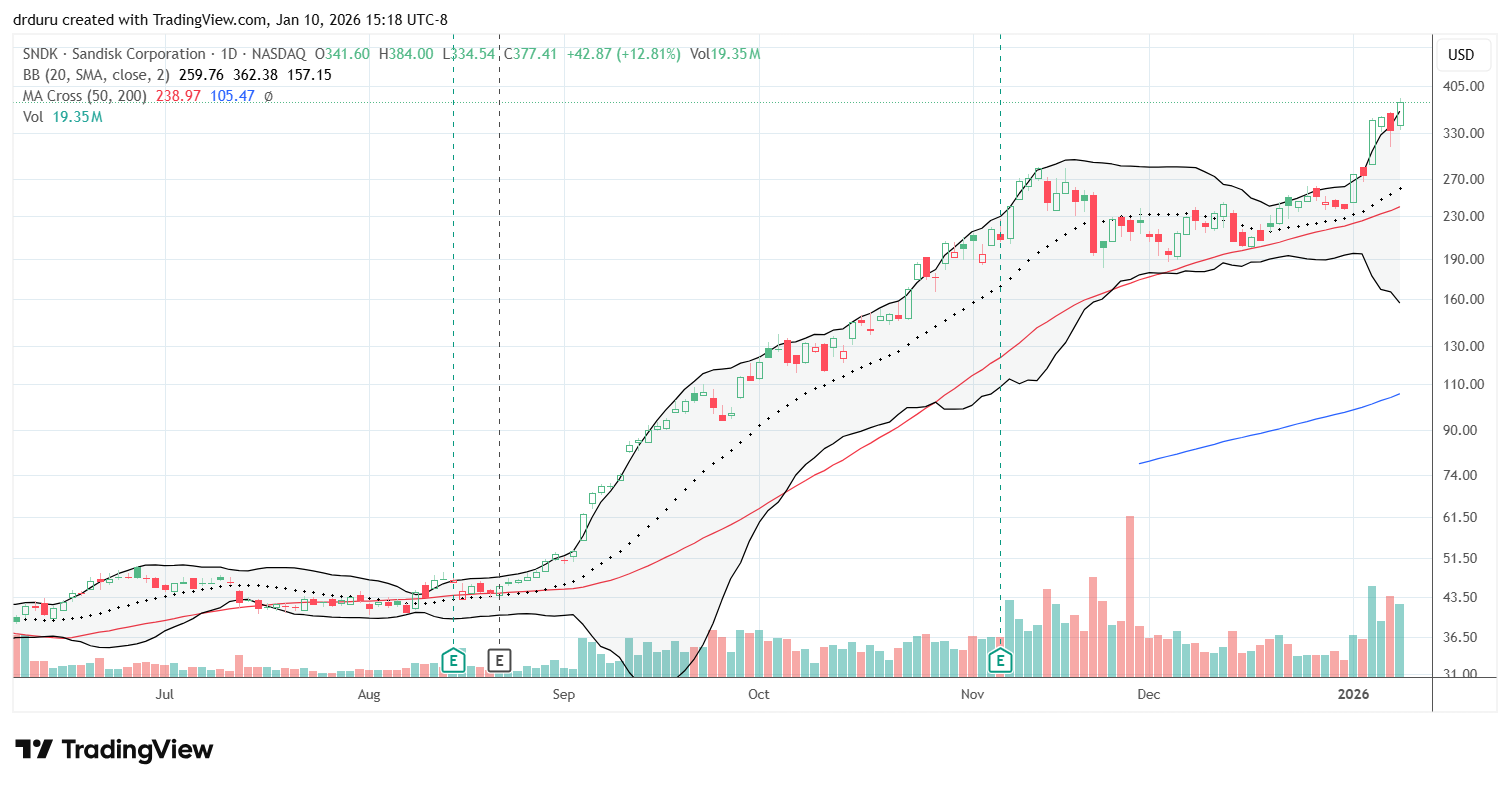
SanDisk (SNDK)
Description: SanDisk (SNDK) develops and sells data storage products and solutions.
Technical status: SanDisk (SNDK) skyrocketed to start the year in a continuation move after a strong multi-month run.
Trade commentary: SNDK has a similar trading profile to MU. The stock’s skyrocket to start the year has delivered an astounding 59.0% year-to-date gain. SNDK has not been on my radar this entire time. Rather than chase the stock, I will stay focused on MU….unless of course SNDK delivers an irresistible setup like the tests of 50DMA support in December.
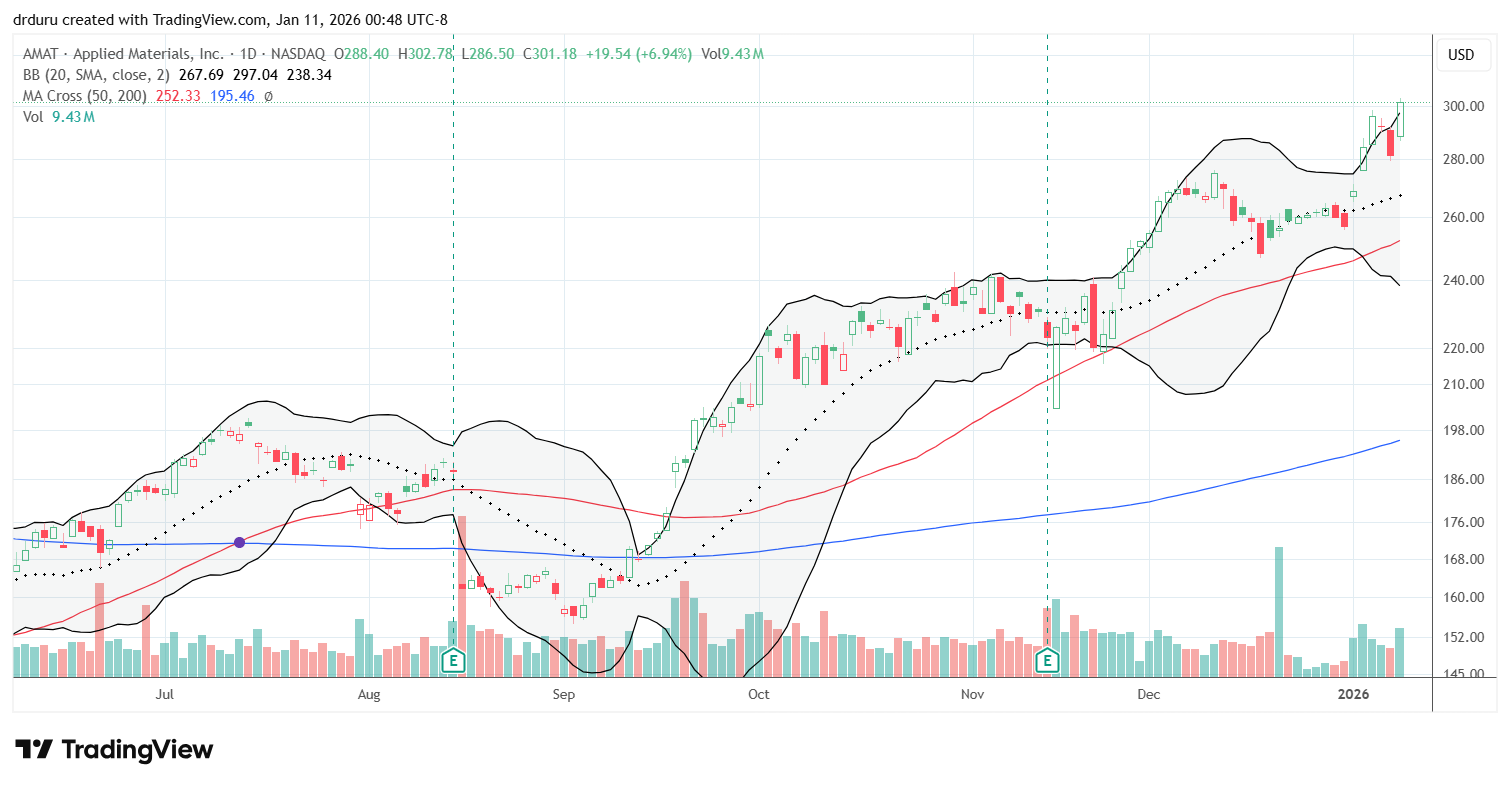
Applied Materials (AMAT)
Description: Applied Materials (AMAT) provides equipment, services, and software used to manufacture semiconductor chips and display technologies.
Technical status: Applied Materials (AMAT) broke out to an all-time high and held its 20DMA uptrend with a 12.0% gain on the week.
Trade commentary: Even the semiconductor equipment makers have been benefiting. AMAT has been one of the biggest beneficiaries. AMAT had a very nice breakout and held that 20DMA trend, and that was very impressive for AMAT.
iShares U.S. Home Construction ETF (ITB)
Description: iShares U.S. Home Construction ETF (ITB) is an exchange-traded fund that holds companies tied to homebuilding and housing-related industries.
Technical status: The iShares US Home Construction ETF (ITB) surged back above its bear market line with a powerful 2-day rally driven by news of a $200B purchase of mortgage-backed bonds by the Federal government.
Trade commentary: Homebuilders were big last week with a fresh affordability push by the administration. The big move was a timely reminder of why I stay consistent with the seasonal trade on home builders. One day after sinking 2.4% on news that the President threatened to ban institutional buyers from buying single family homes, ITB surged 4.2% on no apparent news. After Thursday’s close, news dropped that the President will use cash on hand at Fannie Mae and Freddie Mac to buy $200 billion in mortgage backed bonds in order to drive mortgage rates lower. ITB responded on Friday by popping 6.3% well above its bear market line. I responded by taking profits on some of my seasonal trade positions and selling call options against another. There should be more headline-driven moves ahead given the President announced he will present a comprehensive housing market plan at Davos later this month.
")
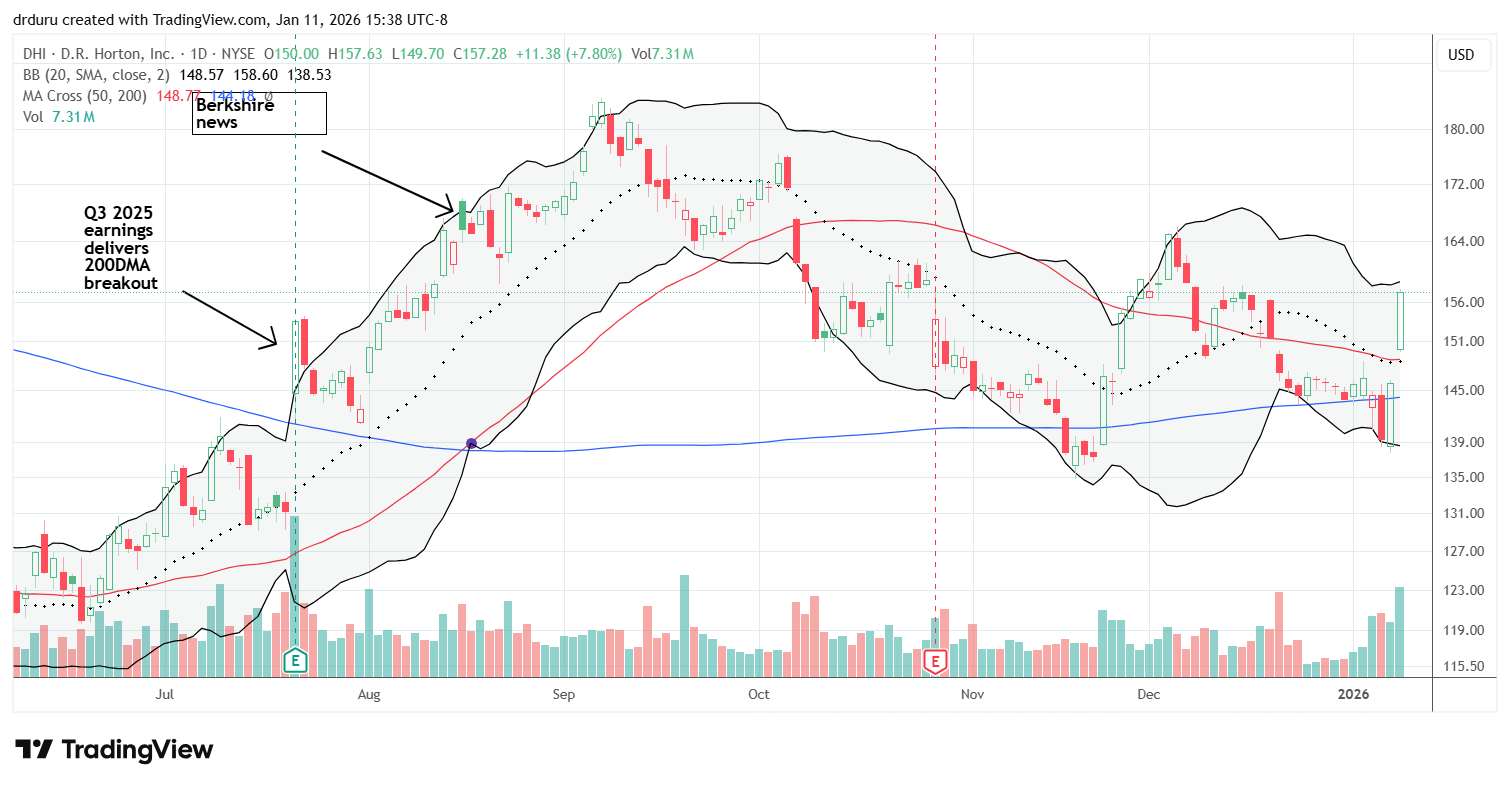
D.R. Horton (DHI)
Description: D.R. Horton (DHI) builds and sells residential homes across multiple U.S. markets.
Technical status: D.R. Horton (DHI) surged strongly with a recovery from a 50DMA breakdown but still remained below levels seen when Berkshire’s position became public in 2024.
Trade commentary: I like DHI as the tip of the spear of my home builder trades because Berkshire announced major purchase of shares back in August. Even with the two-day surge, Thursday 4.7% and Friday 7.8%, DHI is still not back to where it traded on the Berkshire news. There remains plenty of upside in the home builders, but the seasonal trade is not about chasing surges. The trade involves buying dips and selling rallies. I took profits on half of my DHI call option position.
Financial Select Sector SPDR Fund (XLF)
Description: Financial Select Sector SPDR Fund (XLF) is an exchange-traded fund that tracks large U.S. financial sector companies.
Technical status: The State Street Financial Select Sector SPDR ETF (XLF) tried to hold its all-time high, remaining choppy but bullish into earnings season.
Trade commentary: Financials will be the big story with earnings in the coming week. Financials have behaved slightly more bullishly than the S&P 500. Back on December 11, XLF broke out above the former all-time high. XLF has been choppy, but its 20DMA is holding as support. Financials soared 2.2% to start the week to another all-time high and churned from there. I am back to watching XLF closely because it is hard to be bearish when financials are bullish.
")
Goldman Sachs (GS)
Description: Goldman Sachs (GS) provides investment banking, securities, asset management, and other financial services.
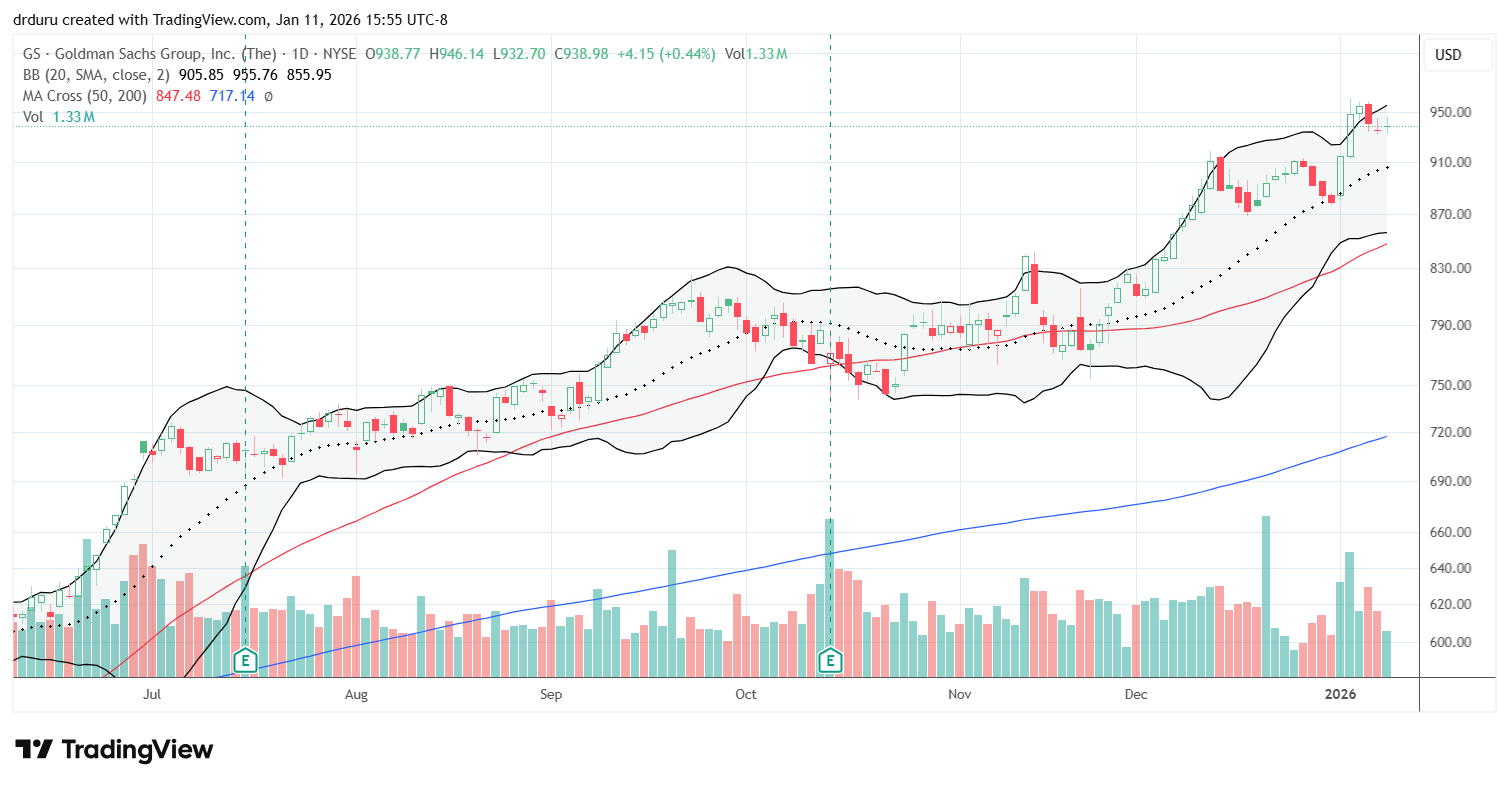
Technical status: Goldman Sachs (GS) started the week with a surge to an all-time high. The stock has sustained a long-running uptrend after its 2023 bottom despite tariff-related volatility.
Trade commentary: GS has helped XLF soar. GS has been on a tear since the bottom and consolidation in 2023. This stock was a big miss for me because I check in on GS periodically. I could have and should have bought anywhere along the line. I chose to get a little too cute with trades on XLF. While GS is not on my 2026 shopping list, I will be more focused on trading GS from tests of support.
iShares Silver Trust (SLV)
Description: iShares Silver Trust (SLV) is an exchange-traded trust designed to reflect the price of silver bullion.
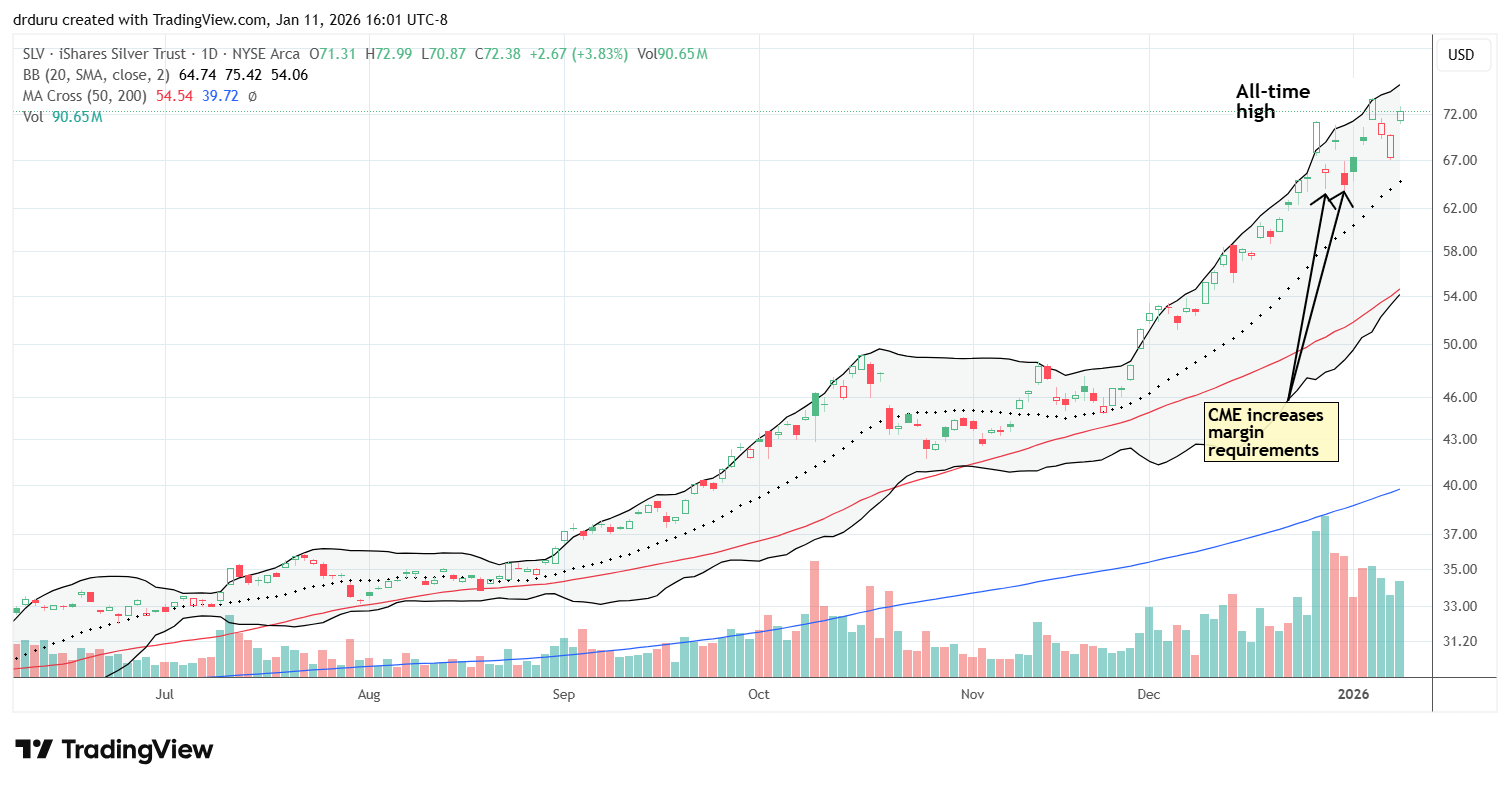
Technical status: iShares Silver Trust (SLV) surged to start the week, lost all those gains, and then surged 3.8% on Friday, supporting the momentum of a sustained move through volatility.
Trade commentary: Precious metals are still signaling a lot of distrust in the financial markets about the health of the dollar, about inflation, and/or about the high debt loads across major economies. The CME increased margin requirements at the end of last year and caused huge churn in silver. Trading volume in SLV has been huge ever since. I want to buy dips in SLV but remain patient for another test of uptrending 20DMA support. A dip to 50DMA support would be a gift.
SPDR Gold Shares (GLD)
Description: SPDR Gold Shares (GLD) is an exchange-traded fund designed to track the price of gold bullion.
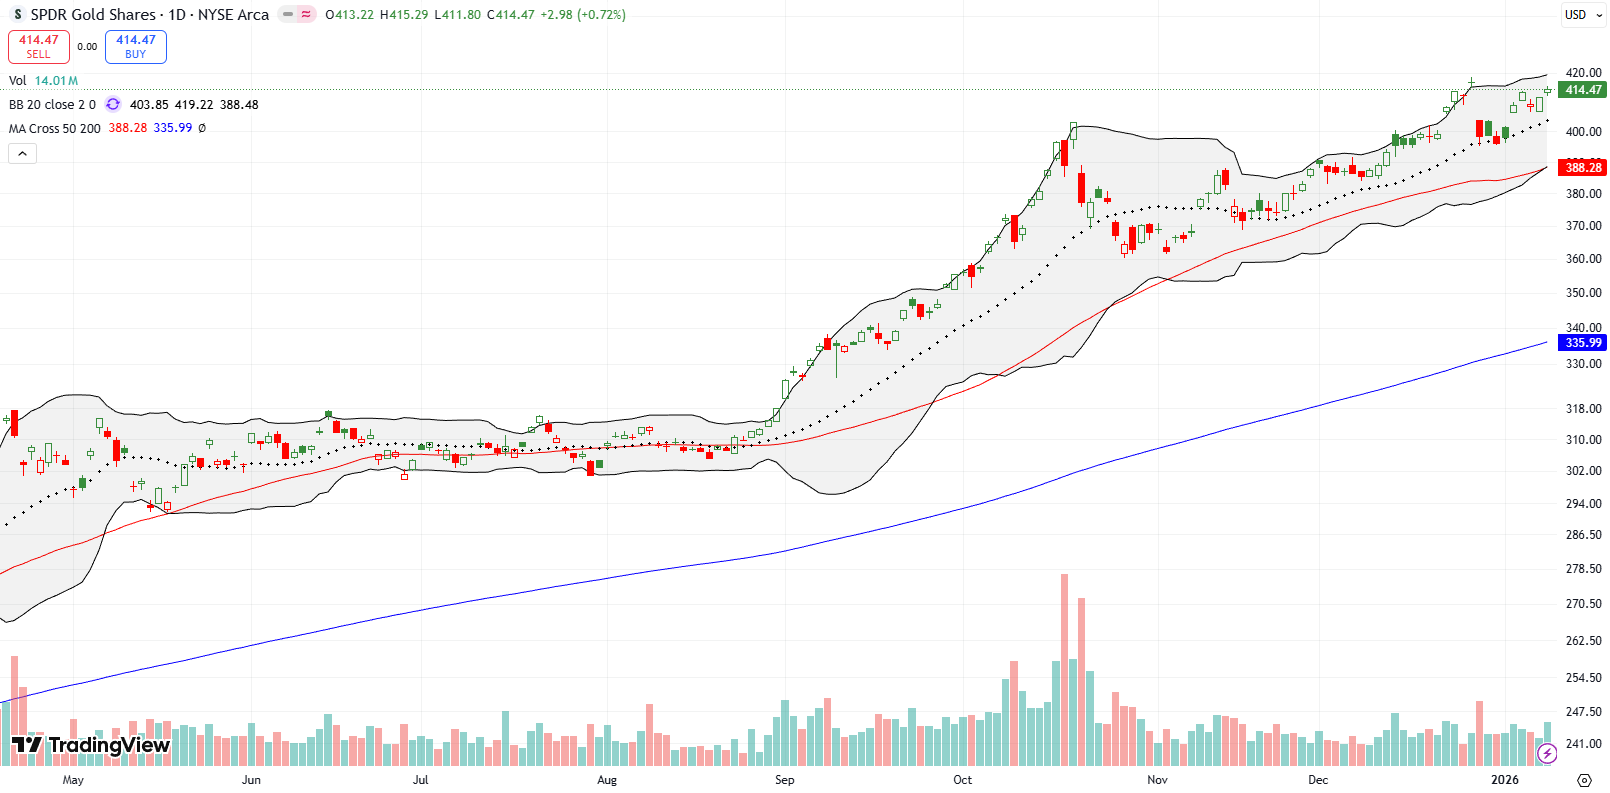
Technical status: SPDR Gold Shares (GLD) delivered a viable pullback at its 20DMA. The rebound from there stalled under its all-time high.
Trade commentary: GLD has provided some viable pullbacks, and the last one was to the 20DMA. After the rebound, I took profits on the call spread I bought at support. I still have a lingering call at the 450 level that was part of a much earlier calendar call spread. I am holding out for a surge in the coming week.
SPDR S&P Retail ETF (XRT)
Description: SPDR S&P Retail ETF (XRT) is an exchange-traded fund that tracks a basket of U.S. retail companies.
Technical status: SPDR S&P Retail ETF (XRT) broke out to a 4-year high in a strong week for consumer-related price action.
Trade commentary: I do not think of a direct correlation between the jobs numbers and how XRT performed, but I am quite intrigued with the strength of XRT at a time there are so many worries about the economy and jobs. As with XLF, I find it hard to get when XRT is performing this well. Still, there are very mixed narratives underneath consumer-facing stocks.
")
Best Buy (BBY)
Description: Best Buy (BBY) sells consumer electronics and related products and services through retail stores and digital channels.
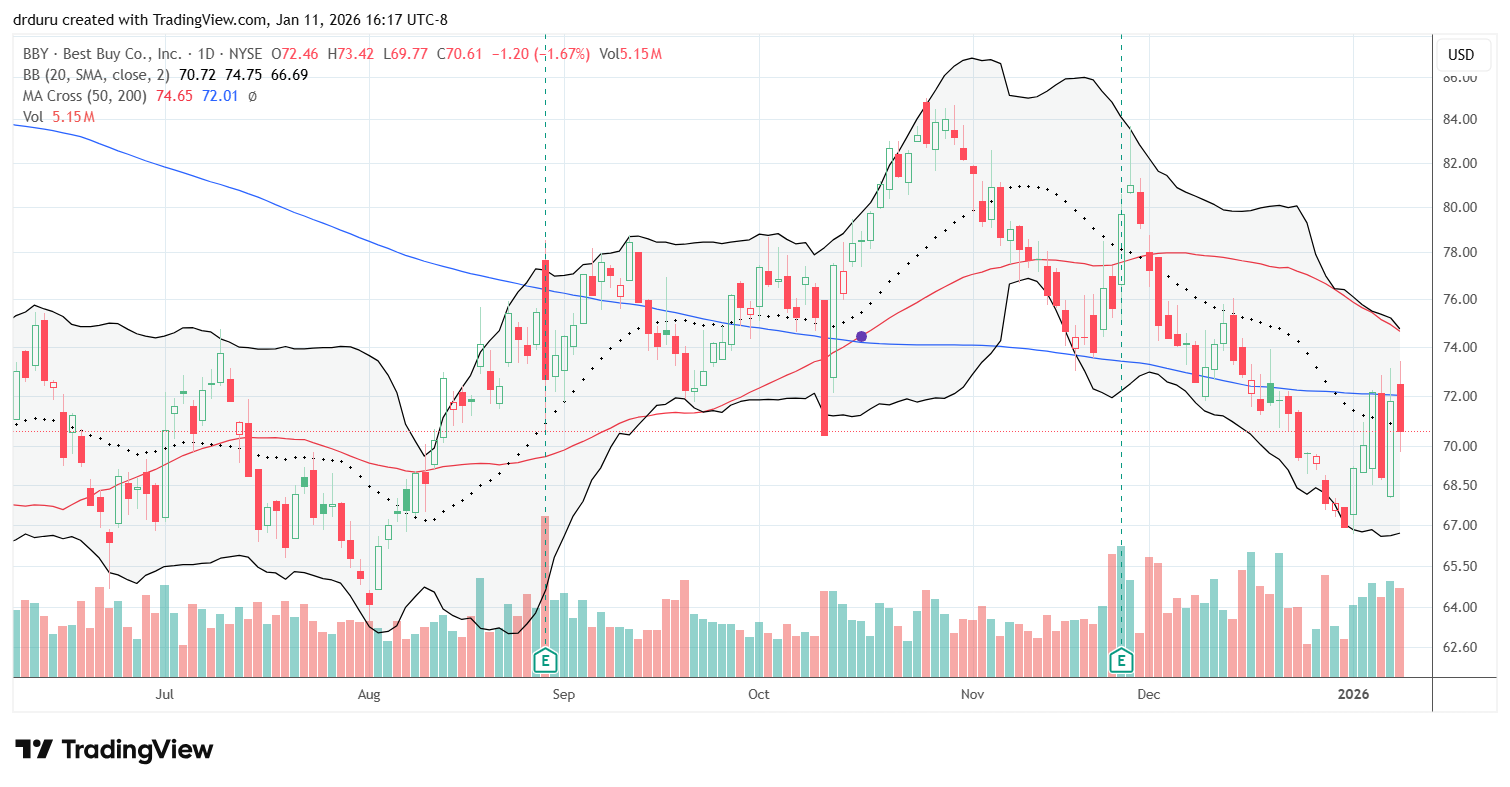
Technical status: Best Buy (BBY) stayed bearish below its 200DMA resistance during a wild week of volatile trading and heavy churn.
Trade commentary: BBY is a retail stock but it has significantly lagged XRT. The stock is technically still bearish below its 200DMA and churned heavily last week, including a 3% up day, a 4.6% down day, a 4.3% up day, and then failing again at 200DMA resistance. I assume part of the wild trading comes from attempts to game the outcome of the Supreme Court decision on tariffs. Retailers like BBY have taken on big hits from tariffs. I am not interested in participating in this speculation.
Target (TGT)
Description: Target (TGT) operates general merchandise and food retail stores and digital commerce platforms.
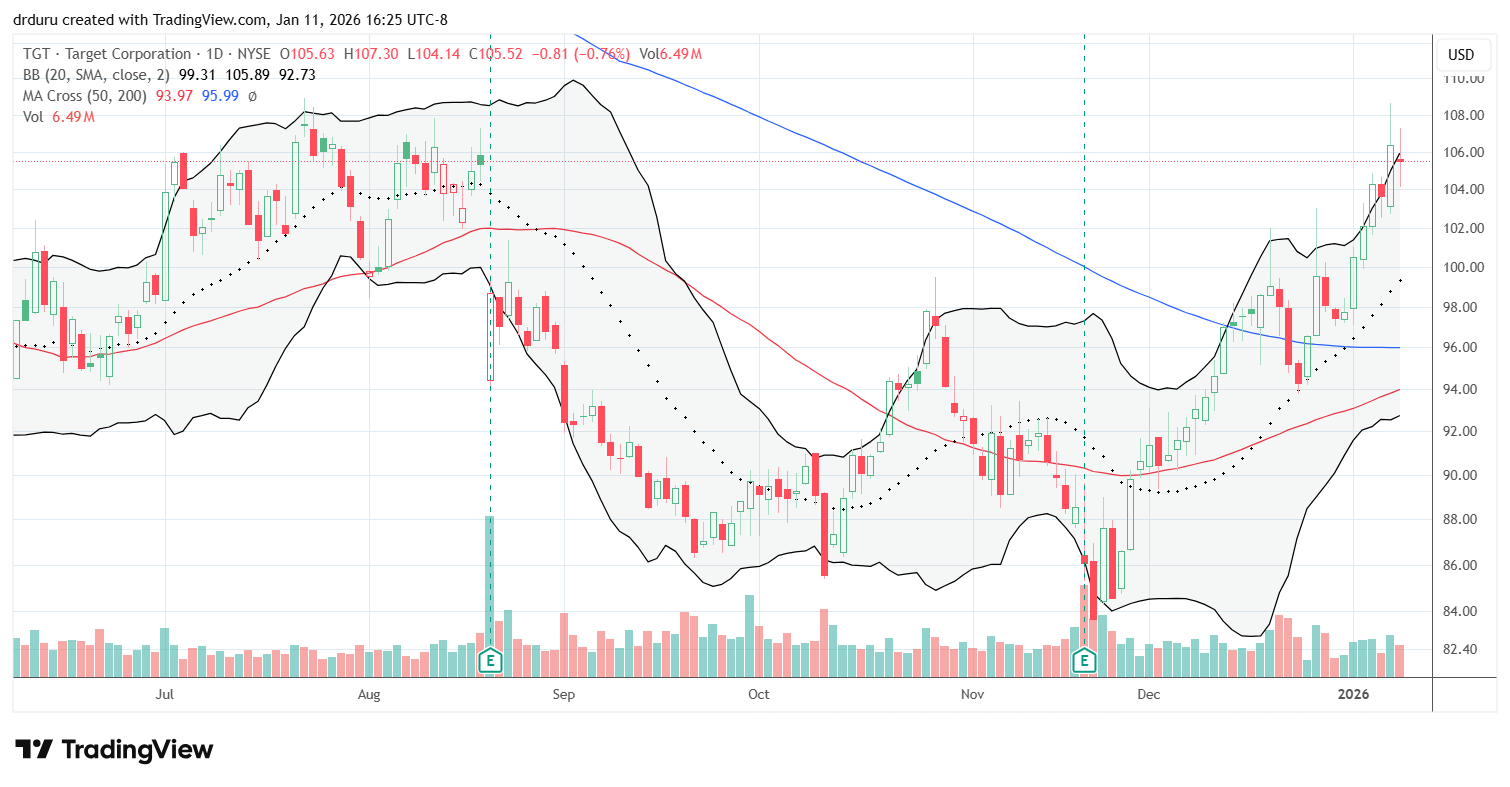
Technical status: Target (TGT) rallied back to prior summer highs after strengthening since November earnings.
Trade commentary: TGT is a big winner in the recent retail rally and one of the oversold, beaten up retail plays that I like. Since earnings in November, TGT has been really strong and is now back to previous highs from the summer. TGT will likely stall out here given technical resistance. I have a covered call position with a $100 strike. I do not mind seeing the position get called away.
Chipotle Mexican Grill (CMG)
Description: Chipotle Mexican Grill (CMG) operates fast-casual restaurants serving made-to-order Mexican-inspired food.
Technical status: Chipotle Mexican Grill (CMG) staged a bullish recovery that reversed its post-earnings drop while still trading below 200DMA resistance and its downtrend.
Trade commentary: CMG has rallied very quietly. The stock suffered a huge 18.2% post-earnings drop to a 2.5-year low, continued to dribble lower late last year, and then slowly turned back up and even reversed all of the loss from that last earnings. That move was very bullish even though CMG remains below its downtrending 200DMA resistance – short-term bullish and longer-term still bearish. I bought more CMG after the fallout, and I am happy with the partial recovery. In several years, I expect to look back pleased that I stuck with this story. I have called CMG down for the count in years past; I do not want to make the same mistake again.
")
First Solar (FSLR)
Description: First Solar (FSLR) manufactures solar photovoltaic panels and provides related solar energy solutions.
Technical status: First Solar (FSLR) formed a topping pattern, broke down below the 50DMA, and saw follow-through selling that pushed me to exit.
Trade commentary: I stopped out of FSLR. I took my profits after Jefferies downgraded FSLR to a hold and caused a sharp 50DMA breakdown. I bought FSLR as a long-term position, but the technicals tell me the trade is over for now. The stock churned for 2 months trying to reestablish an uptrend; the 50DMA breakdown turns that churn into a topping pattern. I will happily reestablish a FSLR position on a test of 200DMA support. After all, I started 2025 thinking FSLR would be an excellent contrarian buy starting in 2027.
")
CDW Corporation (CDW)
Description: CDW Corporation (CDW) provides information technology solutions and sells hardware, software, and related services to businesses and institutions.
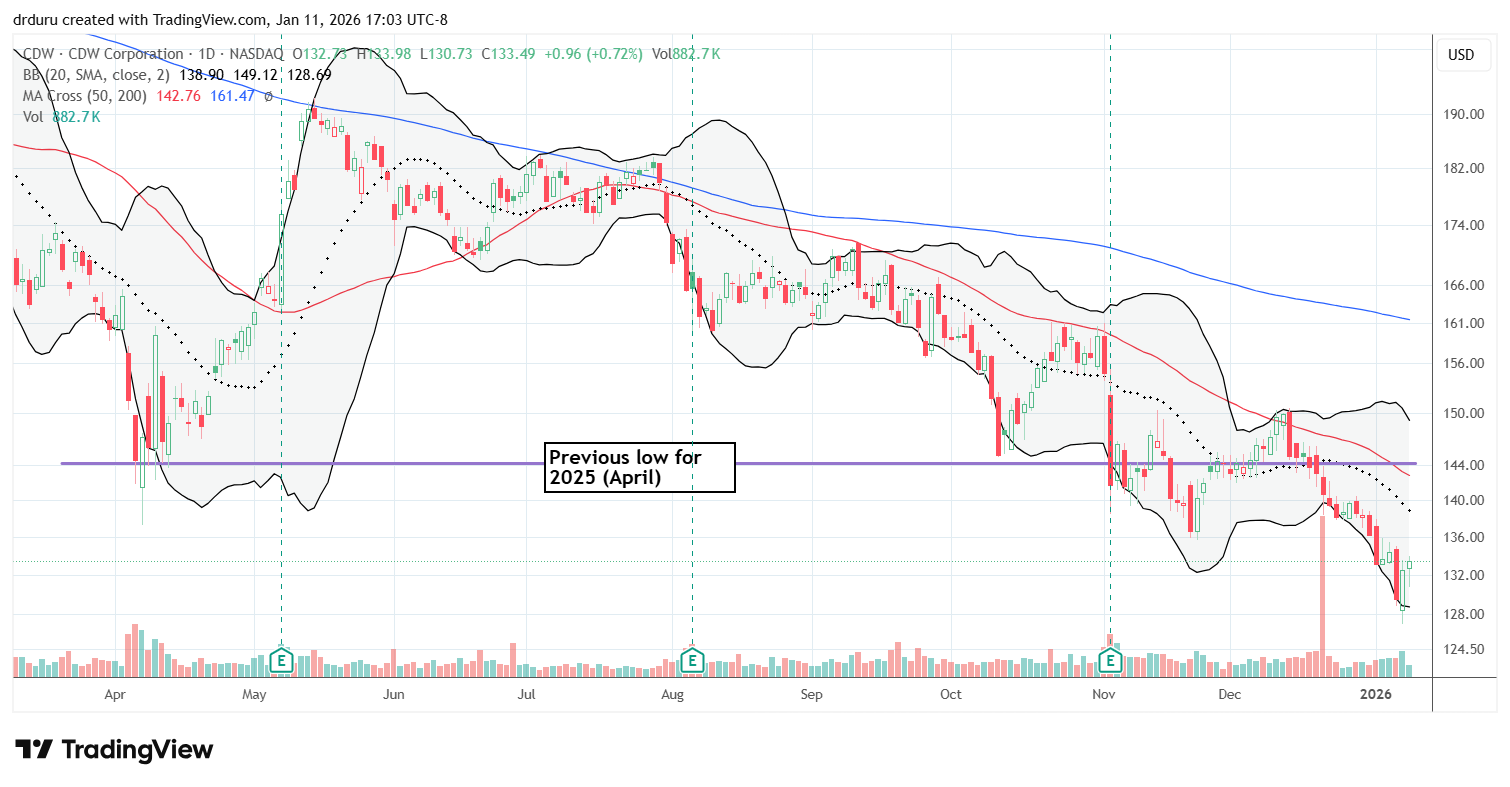
Technical status: CDW Corporation (CDW) remains locked in a persistent downtrend that diverges from broader tech strength.
Trade commentary: CDW has been very bearish for quite some time. I have watched the stock down most of the way and never shorted it. I simply could not shake the image of CDW collapsing in 2023 after reporting poor IT spending and then rallying nearly non-stop to all-time highs the following year. Since then, the stock struck me as an equity that can be really strong contrary to what it “should be” doing. Now I assume CDW has some company-specific issues as the stock has greatly underperformed the tech sector.
Accenture (ACN)
Description: Accenture (ACN) provides consulting, technology, and outsourcing services to businesses and government organizations.
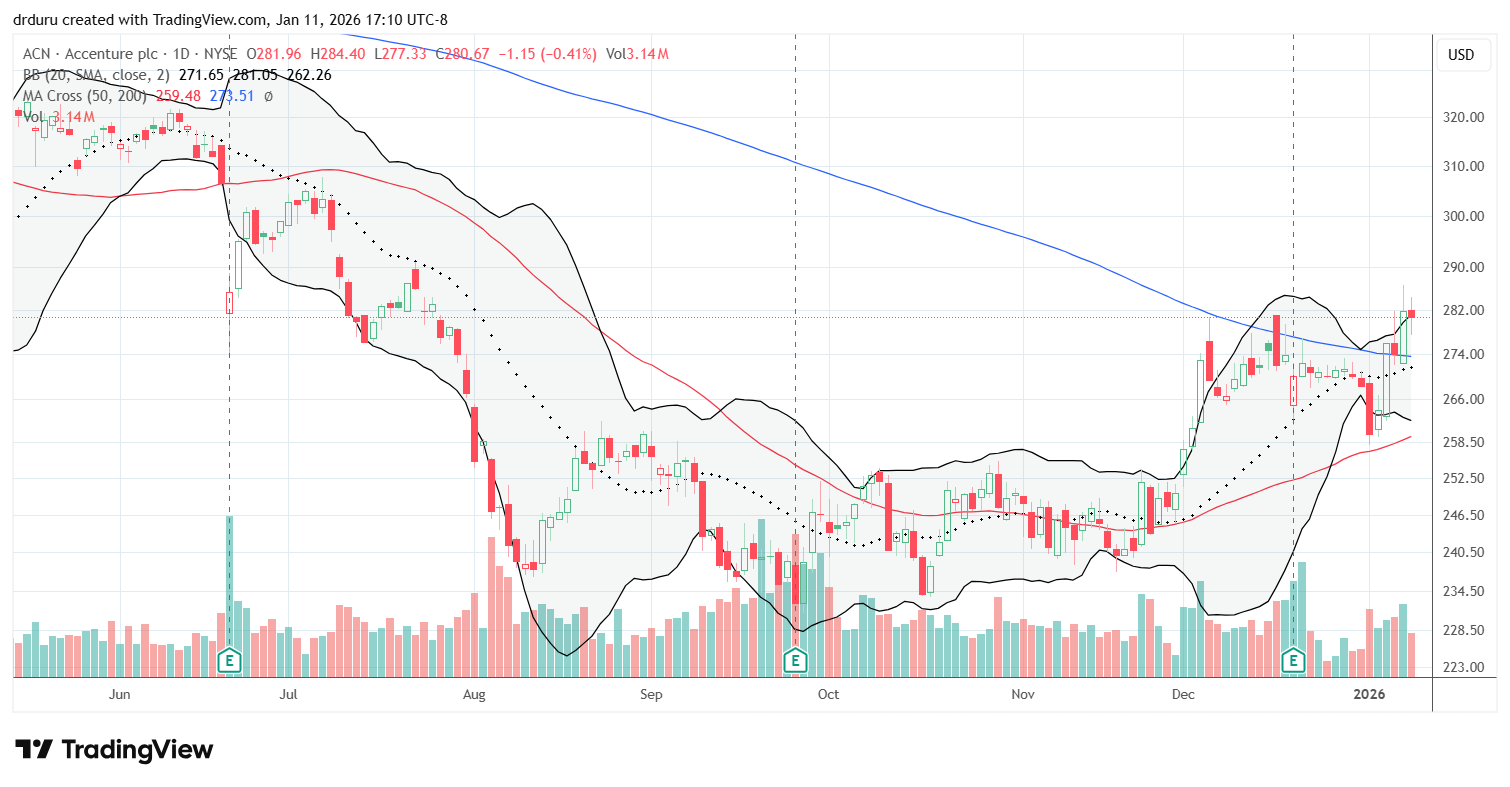
Technical status: Accenture (ACN) broke out above its 200DMA, prompting me to buy shares with plans to accumulate on a pullback toward the 50DMA.
Trade commentary: I finally got back into ACN. The confirmed 200DMA breakout brought me in. I really like ACN because its consulting business pivoted strongly to (generative) AI. Its exposure to government contracts seems tolerable at this point. I will accumulate shares right back down to the 50DMA if the market gives me the opportunity.
ROBO Global Healthcare Technology and Innovation ETF (HTEC)
Description: ROBO Global Healthcare Technology and Innovation ETF (HTEC) is an exchange-traded fund focused on healthcare technology and innovation companies.
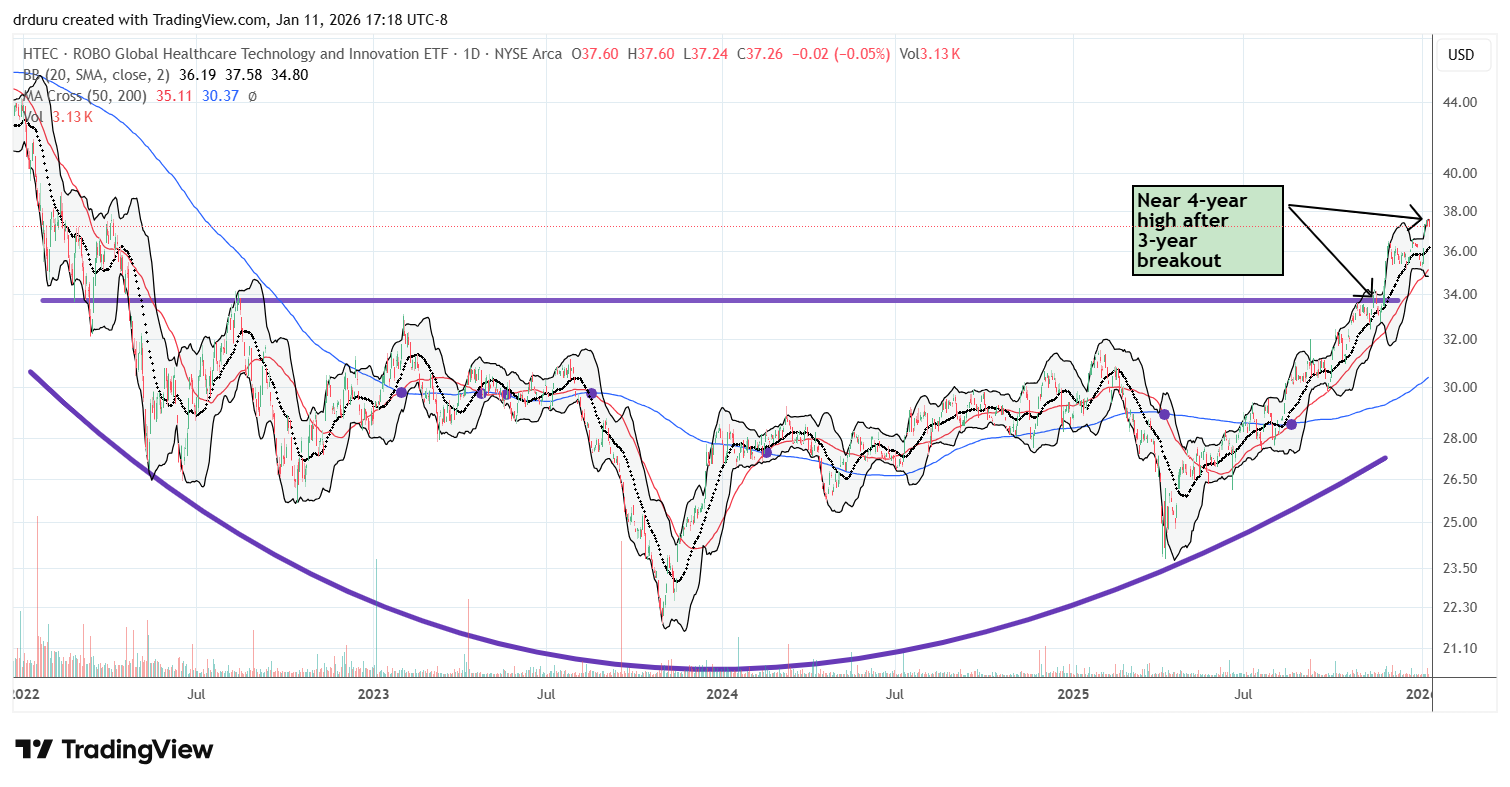
Technical status: ROBO Global Healthcare Technology and Innovation ETF (HTEC) completed a long-term bottoming process and continued the recovery with a fresh breakout to start 2026.
Trade commentary: I started buying HTEC almost 5 years ago. The bottoming process from there unfolded slowly and along the way I accumulated shares. Last year’s breakout confirmed the bottoming process. I plan to stick by HTEC as technology-assisted healthcare is the future. HTEC is now one of my favorite ETFs.
Datadog (DDOG)
Description: Datadog (DDOG) provides cloud monitoring and security analytics software for applications and infrastructure.
Technical status: Datadog (DDOG) failed at 200DMA resistance, warned with a sharp drop, and then followed through to the downside, leading me to exit at a loss.
Trade commentary: A week ago I explained why I might stop out of DDOG at a loss. I thought the big post-earnings gain had meaning when I bought DDOG at 50DMA support. I held on to see what would happen on a test of 200DMA support. I almost bought more when DDOG bounced off its 200DMA in picture perfect form. Thankfully, I missed the buy window. DDOG confirmed its 200DMA breakdown with follow-through selling.
")
Illumina (ILMN)
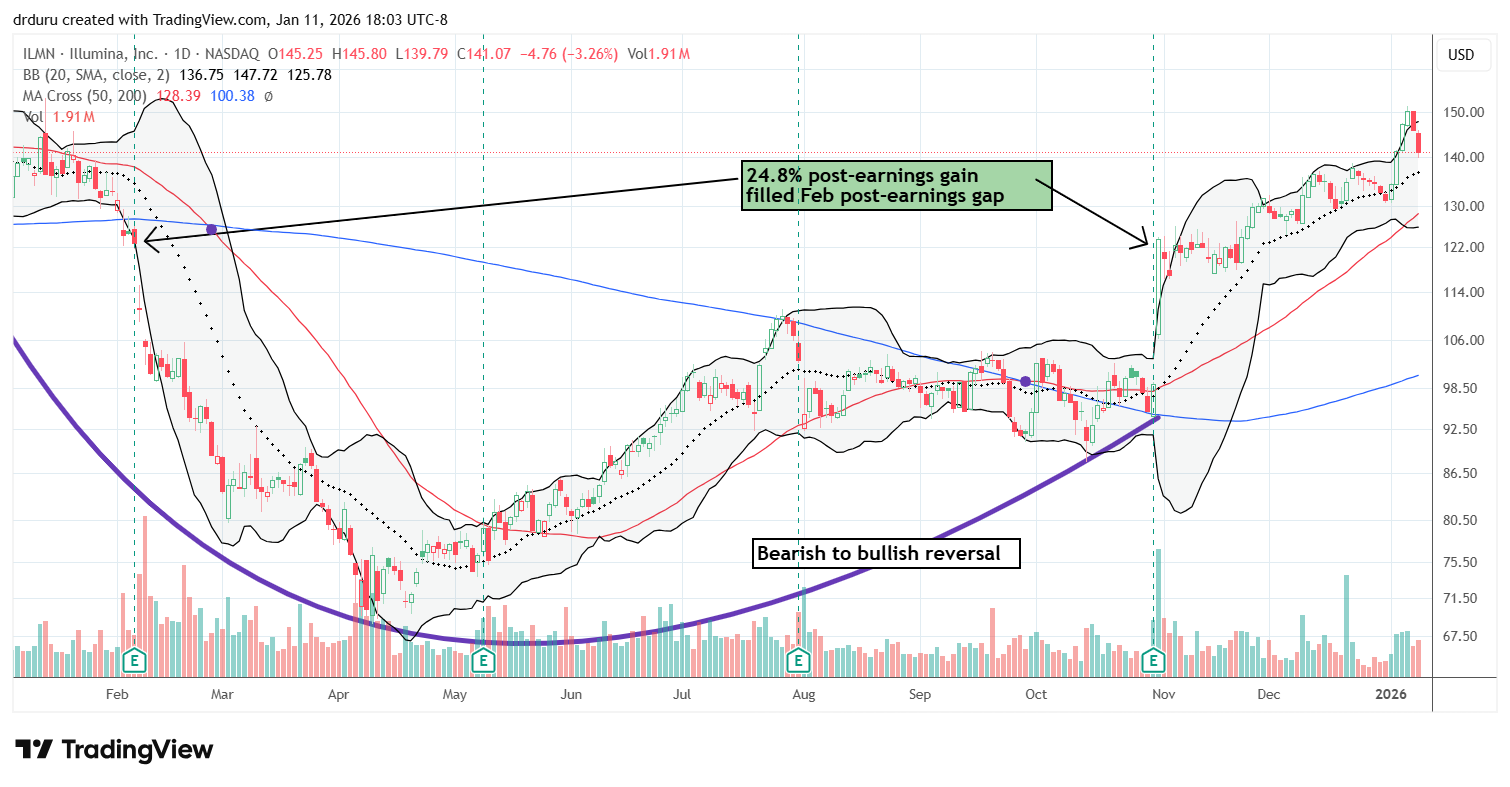
Description: Illumina (ILMN) develops and sells genomic sequencing and array-based technologies and related services.
Technical status: Illumina (ILMN) completed a bearish-to-bullish reversal that I bought into as biotech strength carried into the launch of 2026.
Trade commentary: I bought into a bearish to bullish reversal for ILMN. ILMN benefited from a strong second half of 2025 for biotech. I like biotech as a trade relatively independent of geopolitical risk and headline risk, even the headline risk in health care with rising costs. I will buy dips if biotech sells off in sympathy of general market troubles.
Zentalis Pharmaceuticals (ZNTL)
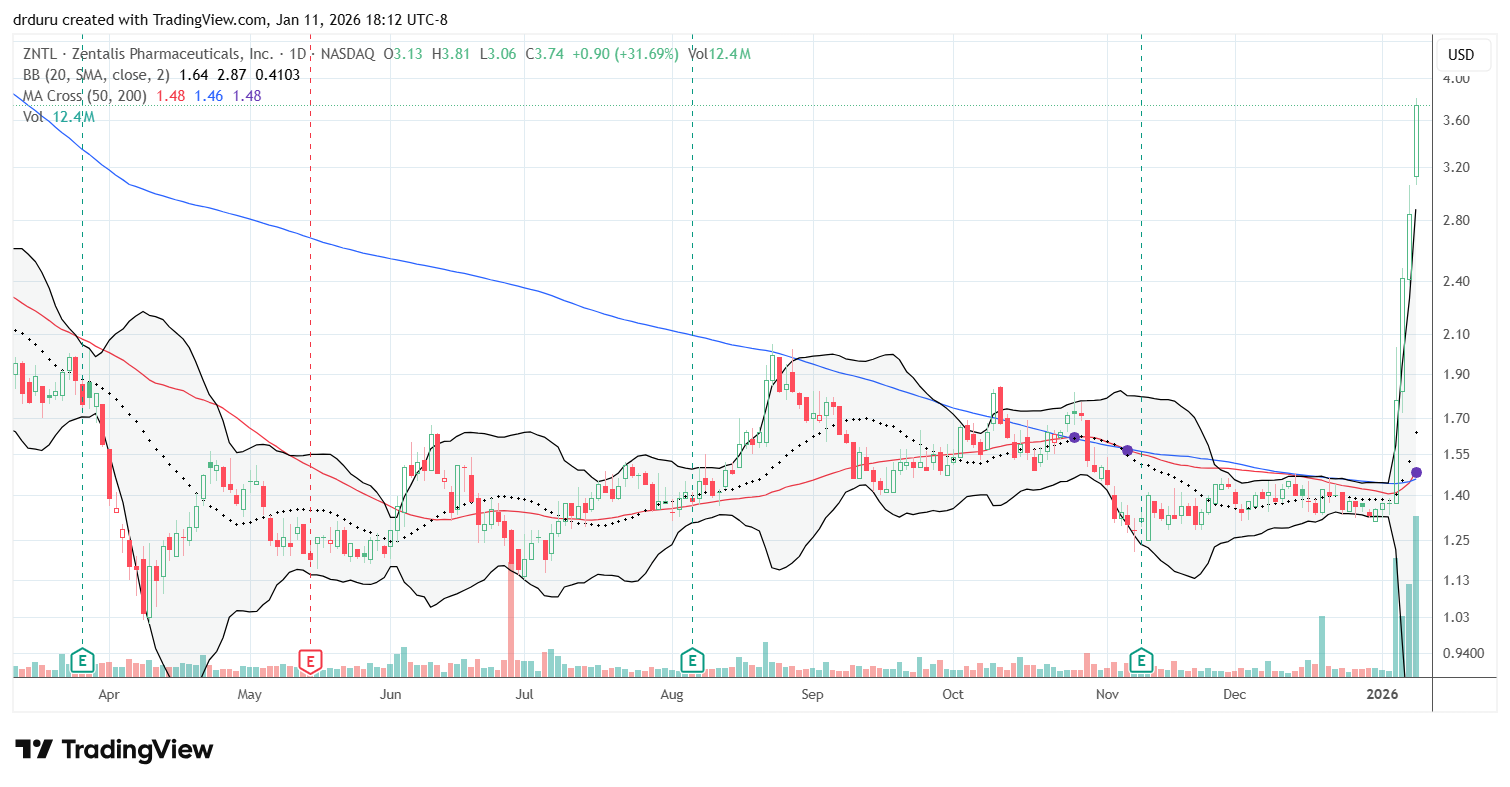
Description: Zentalis Pharmaceuticals (ZNTL) is a biopharmaceutical company developing investigational therapies for cancer treatment.
Technical status: Zentalis Pharmaceuticals (ZNTL) broke out violently after repeated failures at 200DMA and 50DMA resistance, and then continued soaring on drug-related news.
Trade commentary: A friend of mine who is expert in analyzing biotech companies helps me identify or validate biotech “value” plays. We particularly like to buy when the market overreacts to bad news, a trade strategy I affectionately called “biowrecks” years ago. We profited from trading ZNTL volatility in 2024 and again in early 2025. However, we missed out on the best trading opportunity last week. The stock nearly tripled over 4 days after announcing positive drug news. We failed to buy any shares at any time. Looking back, I realized we are overly tuned to buying as contrarians and do not have the trading muscles to buy good news. We will be exercising those muscles in 2026!
Vistra (VST)
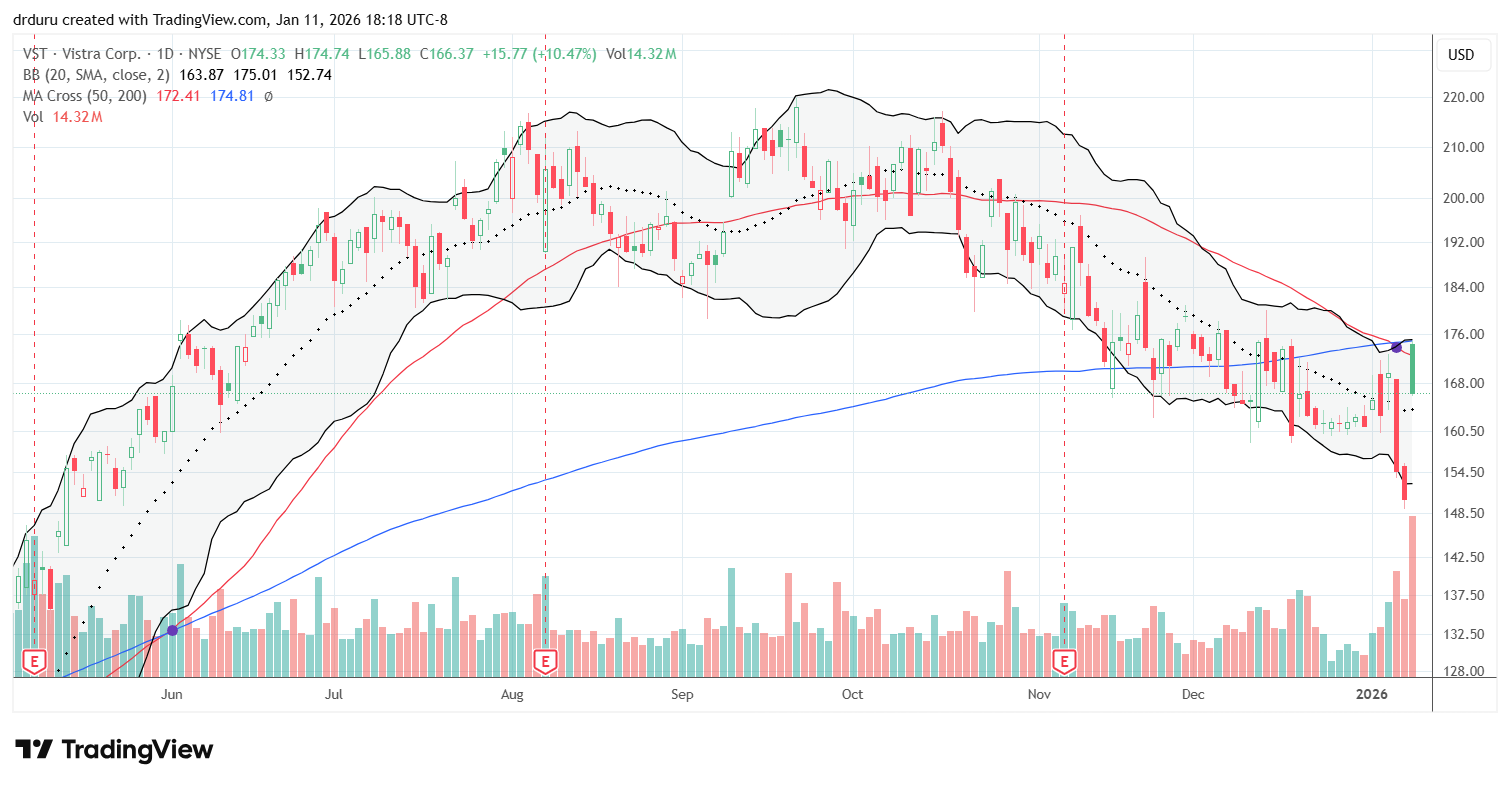
Description: Vistra (VST) is an integrated power company that generates electricity and provides energy-related services.
Technical status: Vistra (VST) stayed in a downtrend and failed again at 200DMA resistance even after a sharp news-driven pop, leaving a breakout above resistance as the buy trigger for me.
Trade commentary: I was watching VST because stock had been trading poorly since October, including a downtrending 20DMA followed by a 200DMA breakdown. Last week, VST suddenly lost 8.8% on Tuesday as if the market feared some pending news. Everything almost changed as VST surged 10.5% on news of a power deal with Meta Platforms (META). Still, the downtrend remains in effect even with the good news tailwind. I am eyeing VST for a bullish breakout above its 200DMA.
Oklo Inc (OKLO)
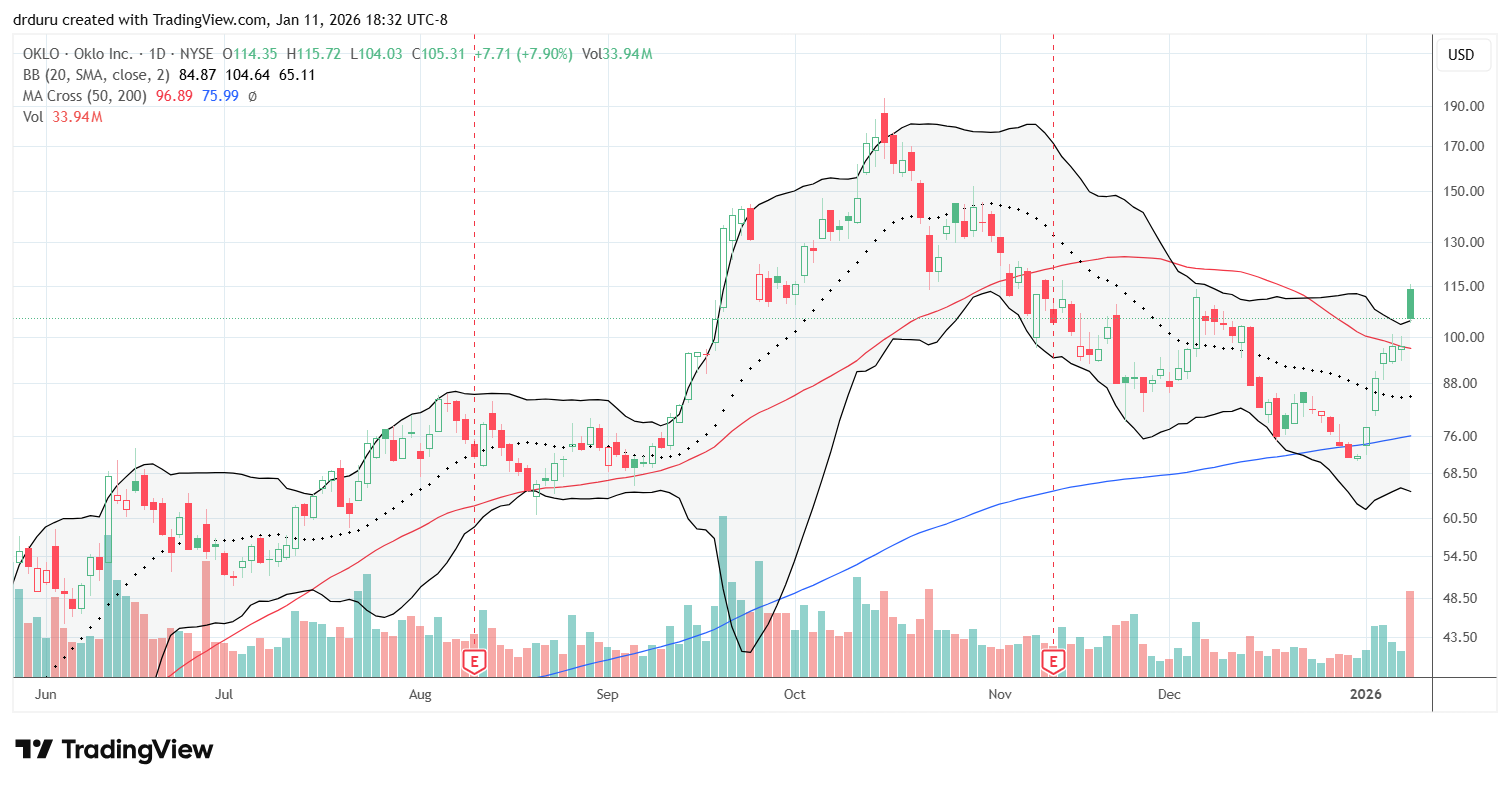
Description: Oklo, Inc. is a nuclear energy company developing compact, advanced fission power plants designed to provide clean, reliable, and scalable power with minimal waste.
Technical status: Oklo Inc (OKLO) bounced off 200DMA support on its way to a bullish 50DMA breakout, bringing an end to 2 months of losses.
Trade commentary: I have long been skeptical of OKLO given the company has no revenues. The company is the equivalent of an R&D biotech company that goes public to raise funds to finance operations. After a 238% gain in 2025, the stock perched nearly perfectly around its 200DMA support. Now the stock has traded up every day for a 46% year-to-date gain! If not for the presumed upside to the all-time high above $170, I would dismiss 2026’s move as over-extended. Instead, I have put the stock on a shopping list. I had some unsuccessful trading as OKLO tumbled for 2 1/2 months to end last year.
")
")
Be careful out there!
Footnotes
Subscribe for free to get email notifications of future posts!
“Above the 50” (AT50) uses the percentage of stocks trading above their respective 50-day moving averages (DMAs) to measure breadth in the stock market. Breadth defines the distribution of participation in a rally or sell-off. As a result, AT50 identifies extremes in market sentiment that are likely to reverse. Above the 50 is my alternative name for “MMFI” which is a symbol TradingView.com and other chart vendors use for this breadth indicator. Learn more about AT50 on my Market Breadth Resource Page. AT200, or MMTH, measures the percentage of stocks trading above their respective 200DMAs.
Active AT50 (MMFI) periods: Day #146 over 20%, Day #35 over 30%, Day #33 over 40%, Day #28 over 50%, Day #4 under 60% (overperiod), Day #119 under 70%
Source for charts unless otherwise noted: TradingView.com
Full disclosure: long IWM shares, long SPY calls, long INTC, long ITB shares and calls, long DHI call spread, long GLD call, long TGT covered call, long CMG, long ACN, long HTEC, long ILMN
FOLLOW Dr. Duru’s commentary on financial markets via StockTwits, BlueSky, and even Instagram!
*Charting notes: Stock prices are not adjusted for dividends. Candlestick charts use hollow bodies: open candles indicate a close higher than the open, filled candles indicate an open higher than the close.
* Blog notes: this blog was written based on the heavily edited transcript of the following video that includes a live review of the stock charts featured in this post. I used ChatGPT to process the transcript.