Stock Market Commentary:
The no worries stock market is sleepwalking its way through April. The major indices are stuck in tight ranges near or at key technical resistance and support levels. Yet, market breadth remains relatively low as many of the big market leaders hold up the tent. Meandering economic data induces some of this sleepwalking. Just when the market thinks weak economic data has finally arrived to convince the Federal Reserve to stand down from tight monetary policy, strong economic data comes along to dash those hopes for the near term.
Yahoo Finance took the latest S&P Global Flash US Composite PMI™ and concluded that “the US economy is in the midst of its biggest upturn in nearly a year.” The S&P’s report shows the continued growth in the services sector and a manufacturing sector that rose from (marginal) contraction territory and back into (marginal) expansion territory. The manufacturing PMI is even at a 6-month high. Job creation “accelerated” to start the second quarter. Along with stronger economic performance comes fresh inflationary pressures. Per the S&P:
“Following back-to-back months of softening cost pressures in February and March, April data indicated a pick-up in rates of input cost and output charge inflation. Operating expenses rose at a marked and historically elevated pace that was the steepest for three months. Hikes in supplier prices were often attributed to greater incremental increases in material costs during the month. Manufacturers and service providers alike recorded sharper increases in cost burdens.”
This report validates my claims that inflationary pressures remain alive and well in the economy. The Federal Reserve has reasons for concern for what might happen when/once they pause rate hikes. The good news is that the economy is somehow managing to motor along despite the tightening to-date. This post-pandemic economy is full of surprises and continues to prove many economists and pundits wrong over and over again. The next up is the May decision on monetary policy from the Federal Reserve…a moment that could provide just the catalyst the market needs to wake from its sleepwalking….to the downside or the upside.
The Stock Market Indices
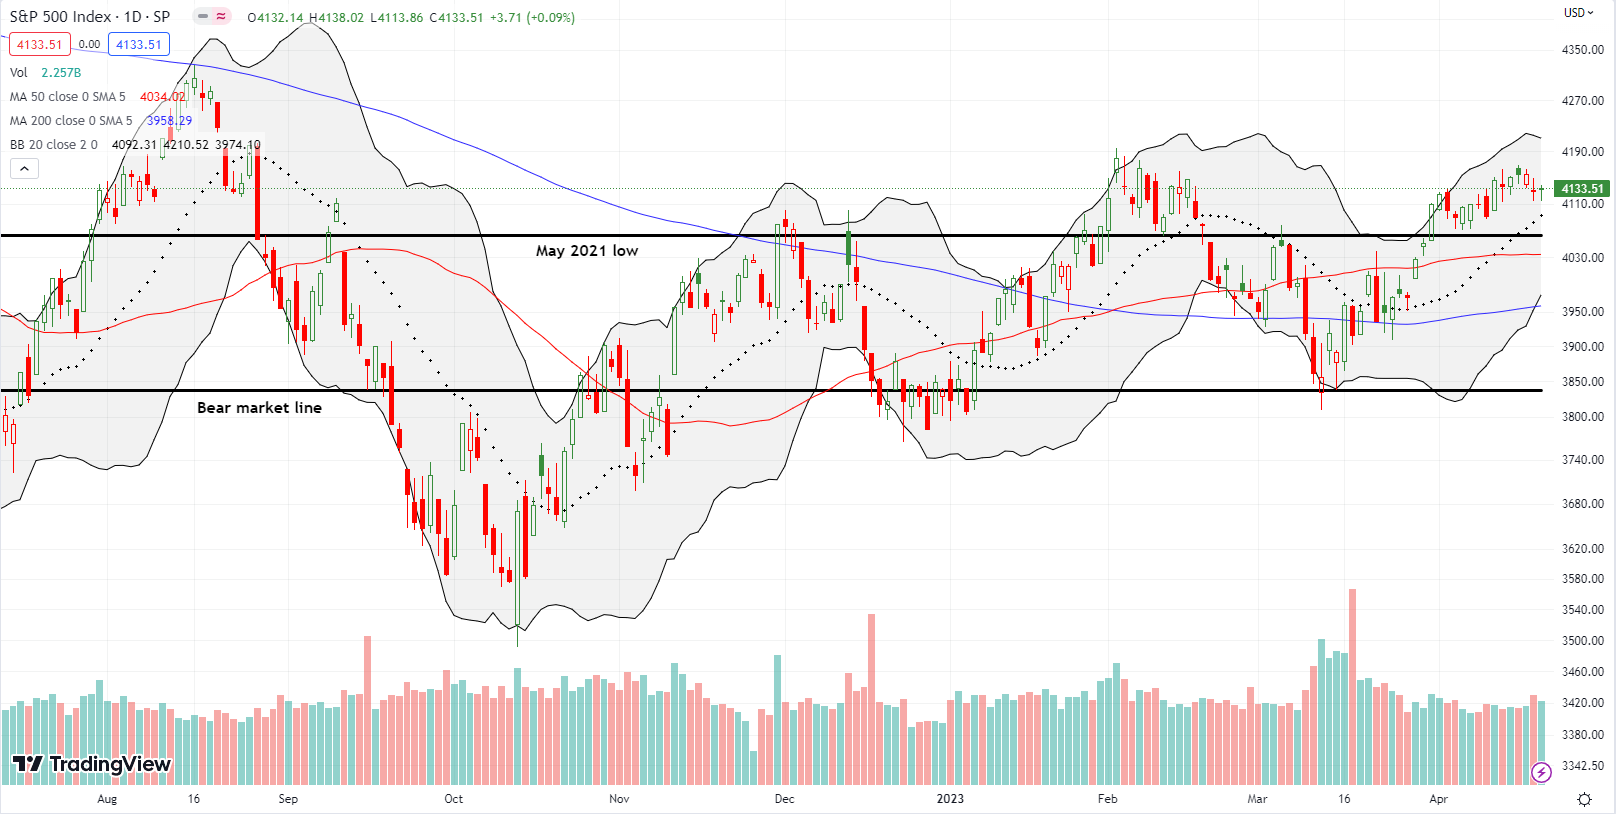
The S&P 500 (SPY) was melting upward going into last week. That subtle momentum came to an end after the index fell slightly Wednesday and Thursday and closed the week with a net flat performance. The 20-day moving average (DMA) (the dashed line below) is now on standby to provide support. However, the February lows essentially held as resistance. Buyers still have a lot left to prove. With volatility so low, I decided to buy a May $400/$395 SPY put spread to play a potential pullback to or through 50DMA support (the red line).
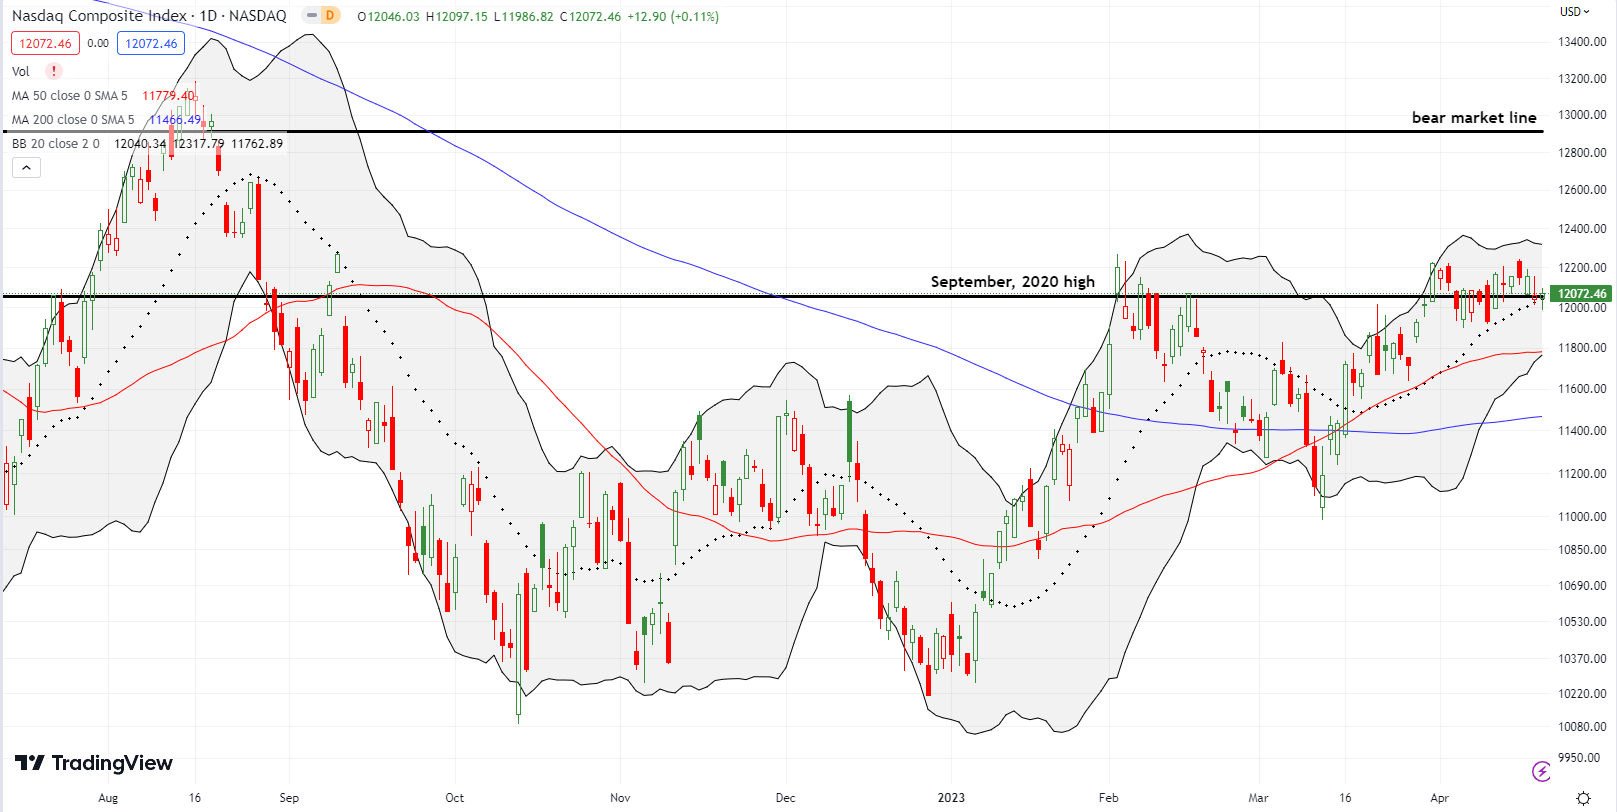
The NASDAQ (COMPQ) is already testing 20DMA support. The tech laden index is sleepwalking through April, along 20DMA support, and around the September, 2020 high. More importantly, the NASDAQ has challenged the February high twice and failed twice to break through and hold. So now I am mindful of the increasing risk of sellers taking control and at least forcing the issue of a test of 50DMA support.
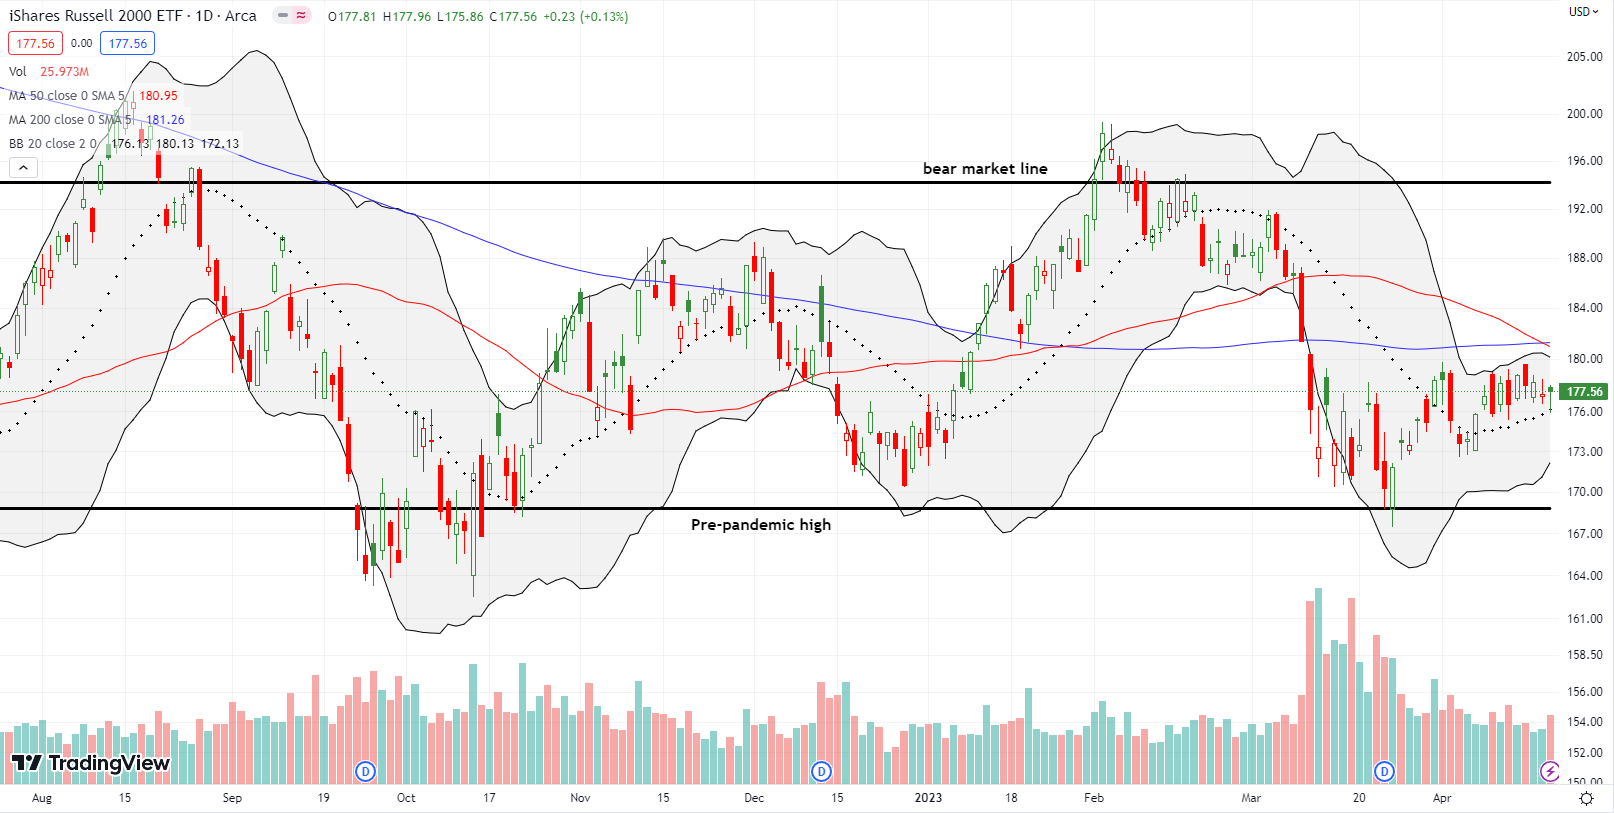
The iShares Russell 2000 ETF (IWM) remains stuck. IWM’s sleepwalking pattern is all about the 20DMA holding as support. IWM tested that support intraday on Friday. The uptrend in the 20DMA is a slight positive, but overhead converging resistance from the 50DMA and 200DMA (bluish line) look more and more ominous.
Stock Market Volatility
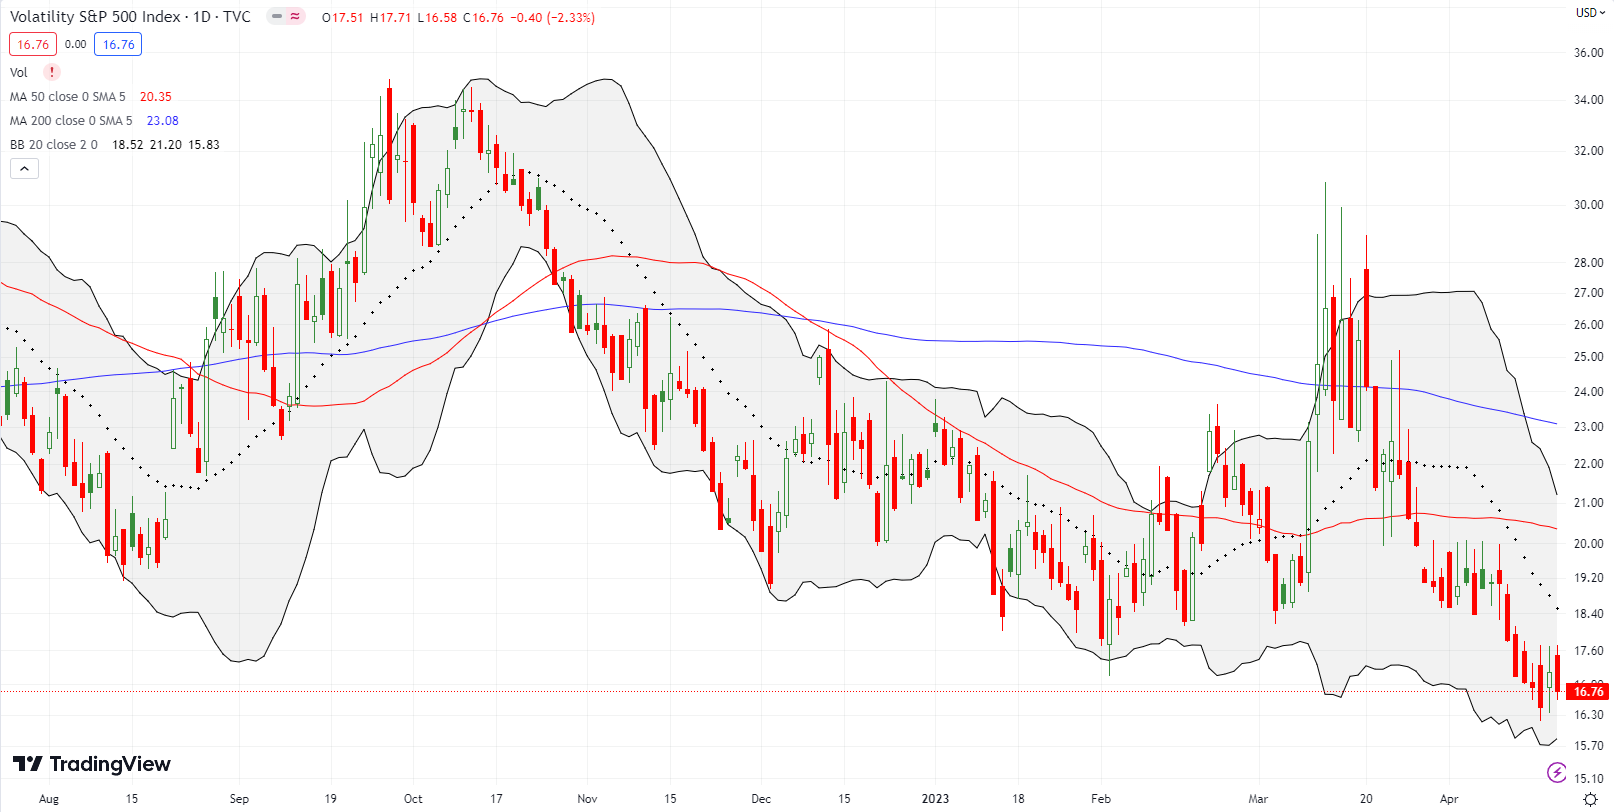
The volatility index (VIX) continued to sink last week. The 2.3% loss for the week sent this “fear gauge” to a level last seen November, 2021, right at the top of the NASDAQ. This ominous milestone encouraged me to start shading more of my trading toward put options even though I still prefer to buy dips to key support levels.
The VIX hit the topping milestone just as the Cboe Global Markets, Inc (CBOE) gets set to release its 1-Day Volatility Index (VIX1D) to track the volatility in 1-day to expiration options on S&P 500 futures. The burst in popularity in 1DTE and 0DTE options has been blamed for the increasing dysfunction in the VIX. I have yet to find direct evidence to support this hypothesis. However, a widely quoted paper, “Traders Retail Traders Love 0DTE Options… But Should They?“, came up with this startling estimate: “Between February 2021 and February 2023, retail investors lost $184,000 on the average day; since the introduction of a daily expiration calendar in May of 2022, this number has grown to average losses of $358,000 per day.” No wonder CBOE rallied to a new 52-week high last week…
The Short-Term Trading Call While Sleepwalking
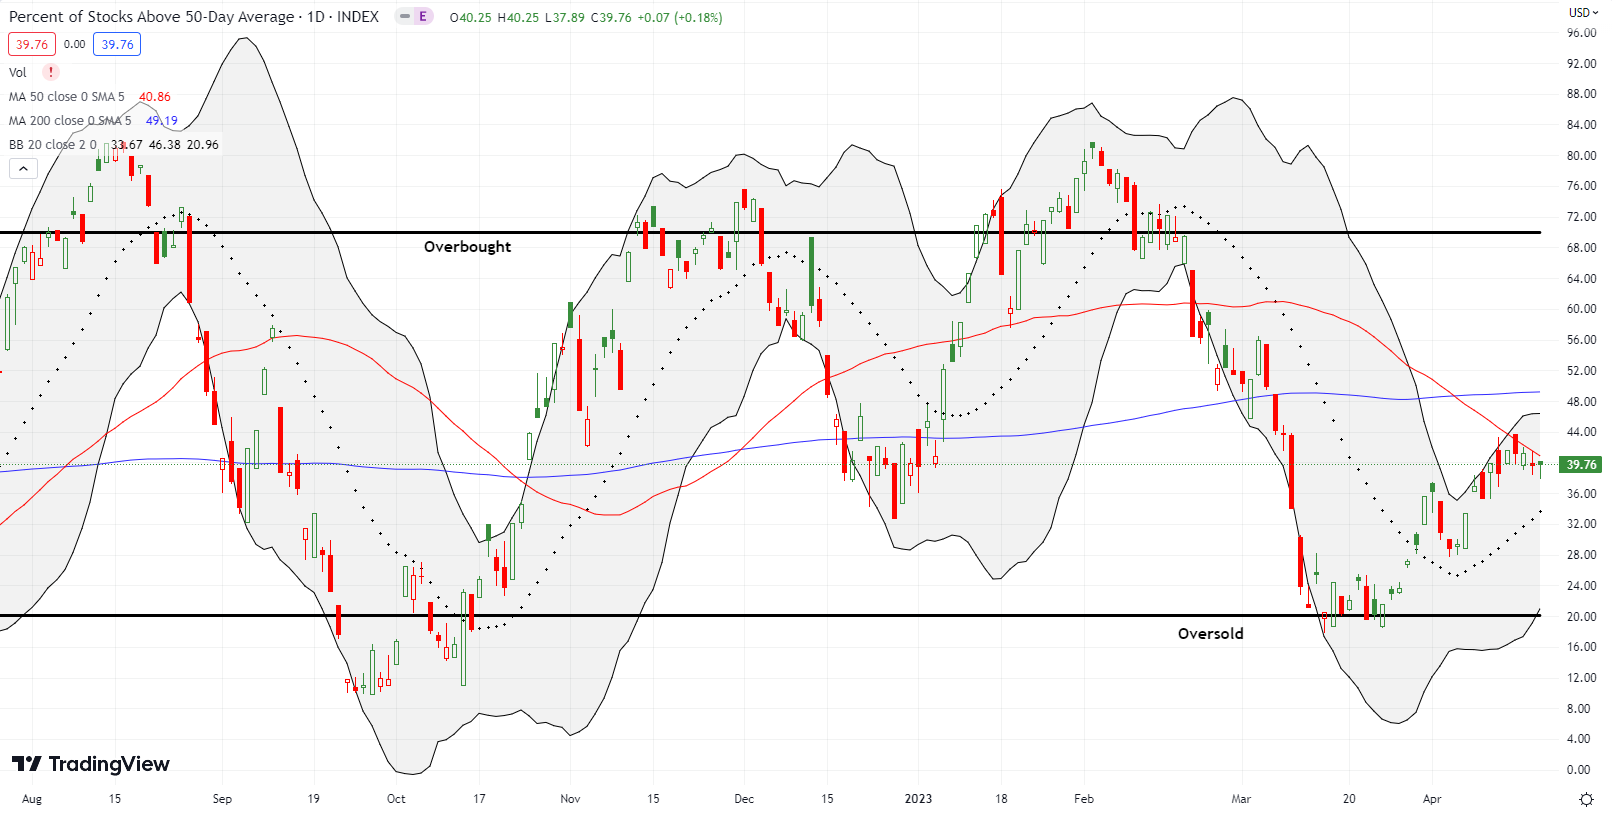
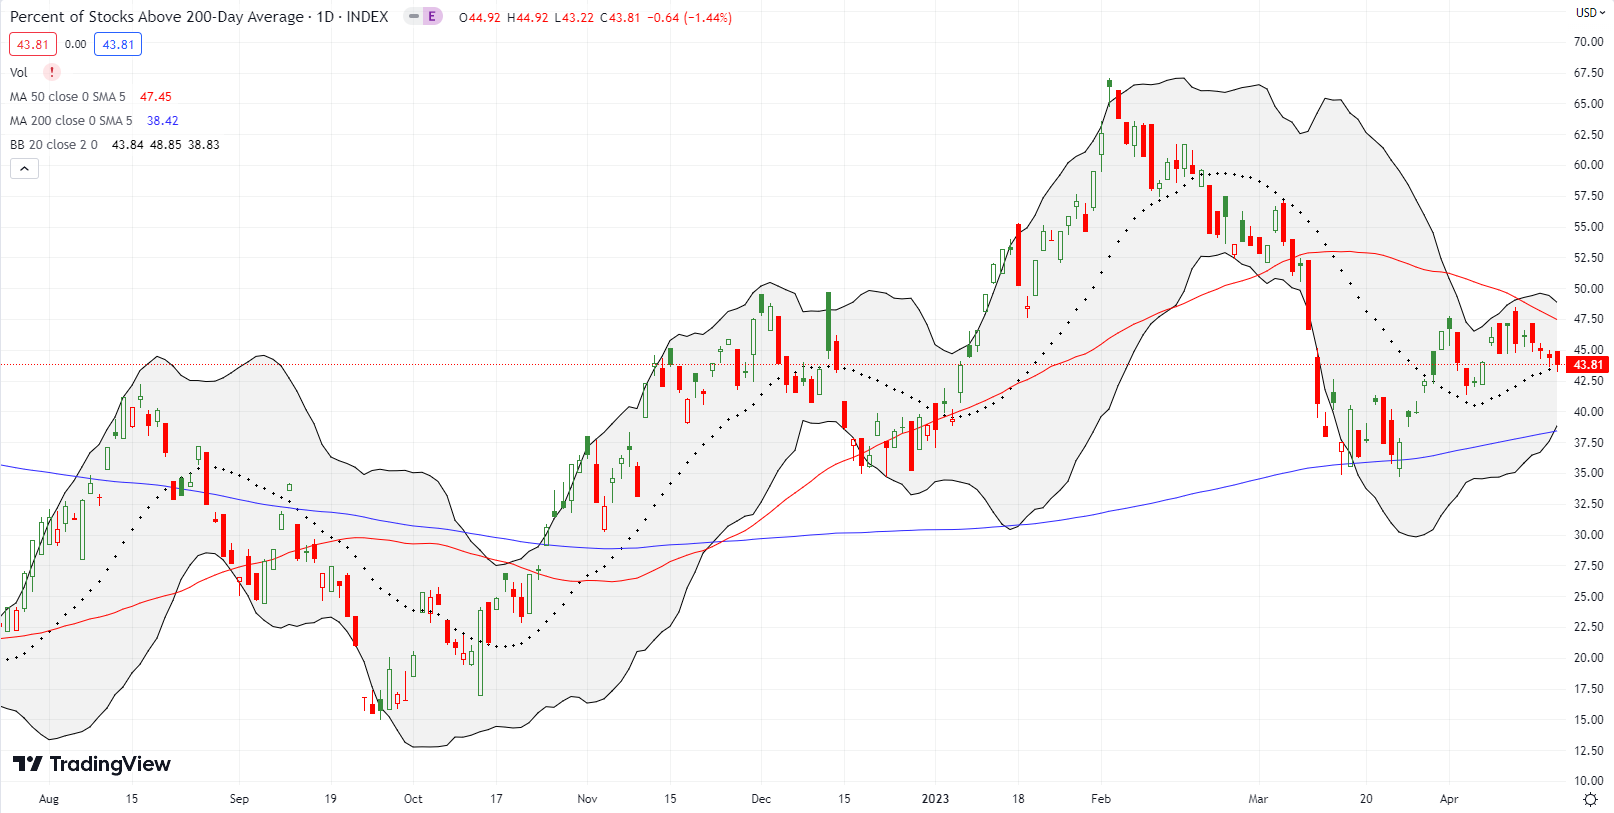
- AT50 (MMFI) = 39.8% of stocks are trading above their respective 50-day moving averages
- AT200 (MMTH) = 43.8% of stocks are trading above their respective 200-day moving averages
- Short-term Trading Call: neutral
AT50 (MMFI), the percentage of stocks trading above their respective 50DMAs, churned in a tight range for the week. My favorite technical indicator briefly cracked the 40% level but failed to hold. While I want to remain cautiously bullish on the stock market, I am less and less comfortable doing so with the VIX at such low levels. At this point, I think the market is more likely to return to oversold before hitting overbought levels. The S&P 500 and the NASDAQ can dissuade me from my growing pessimism by confirming breakouts above their respective February highs.
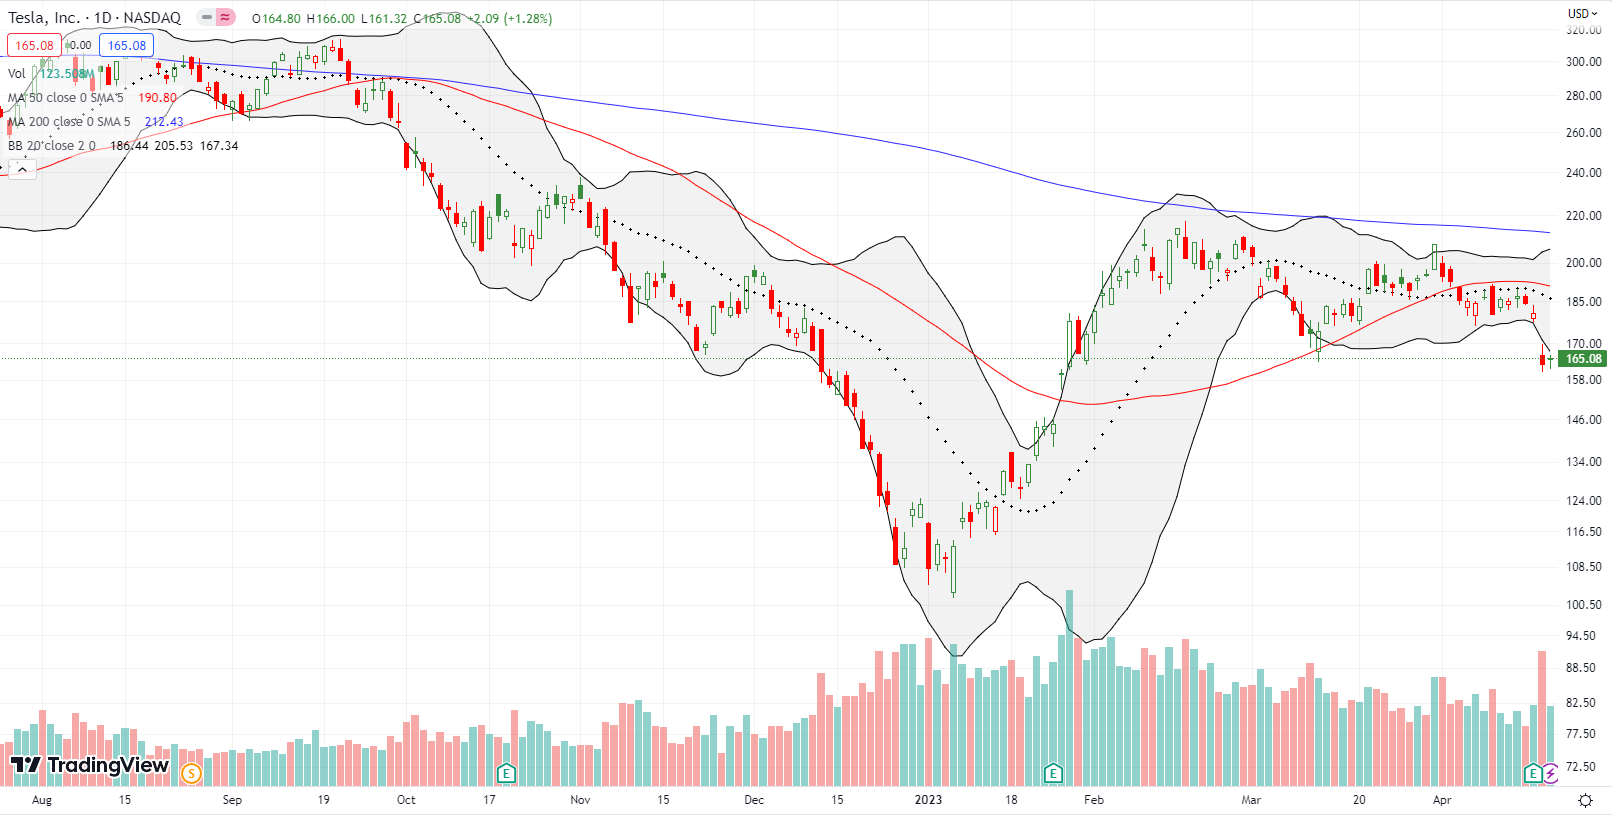
Two weeks ago, I worried that the 50DMA breakdown for Tesla (TSLA) could be the start of a change in fortunes. Sure enough, TSLA suffered a 9.8% post-earnings loss last week that further confirmed 50DMA resistance. TSLA closed the week at a 3-month low. In the wake of the post-earnings drop I bought a straddle position in the form of calendar spreads. The $165 call spread hit my profit target the next day. I am now riding a weekly $160 put option.
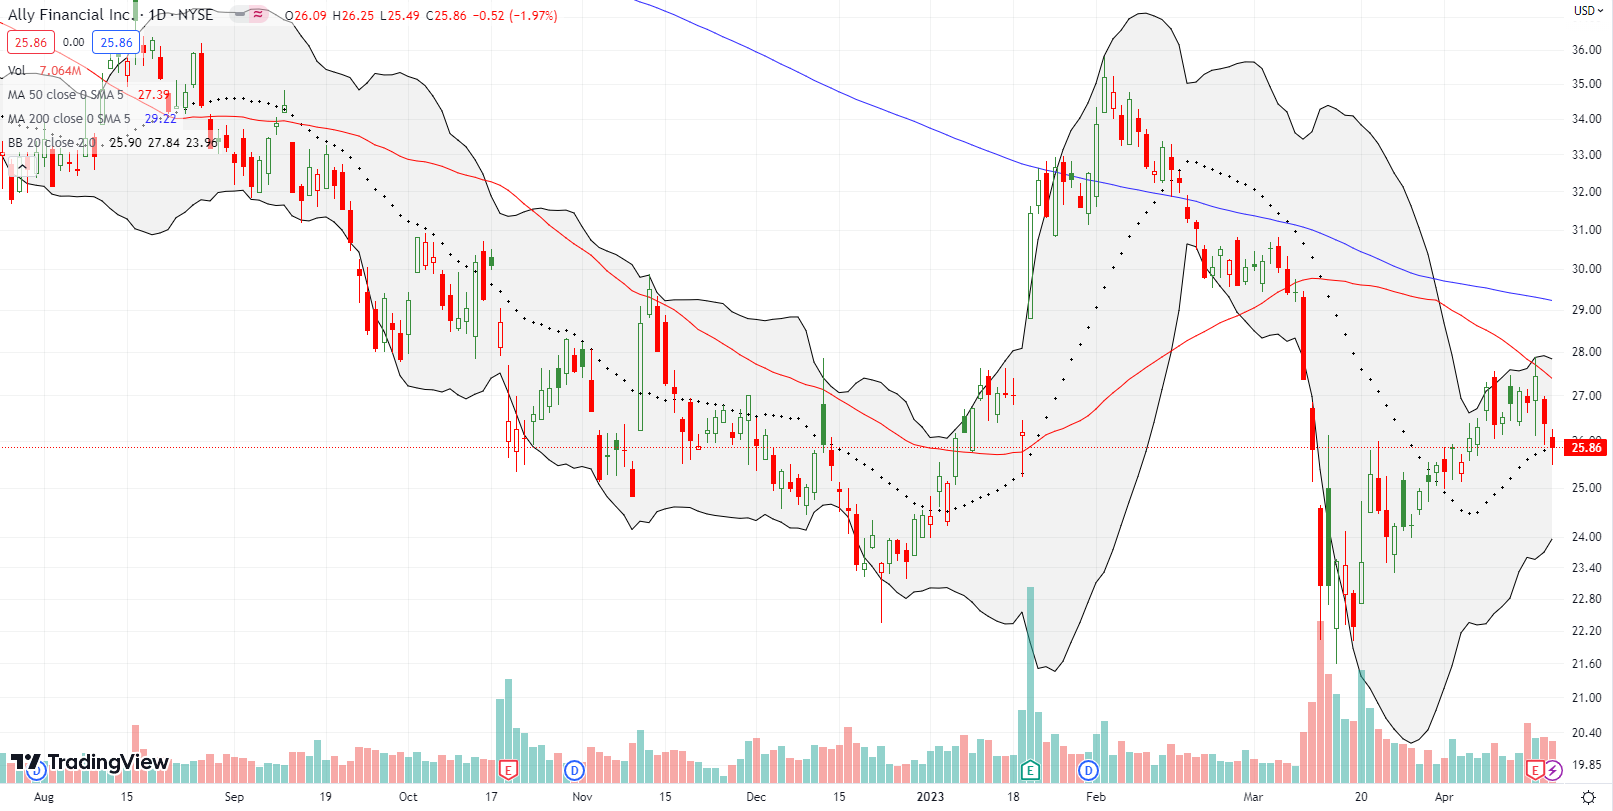
Ally Financial Inc (ALLY) maintained bear market action by failing right at 50DMA resistance after a rebound from March’s panic in regional banks. I jumped into a May put spread as ALLY crossed below its 20DMA. This is another trade that serves as a hedge against bullishness.
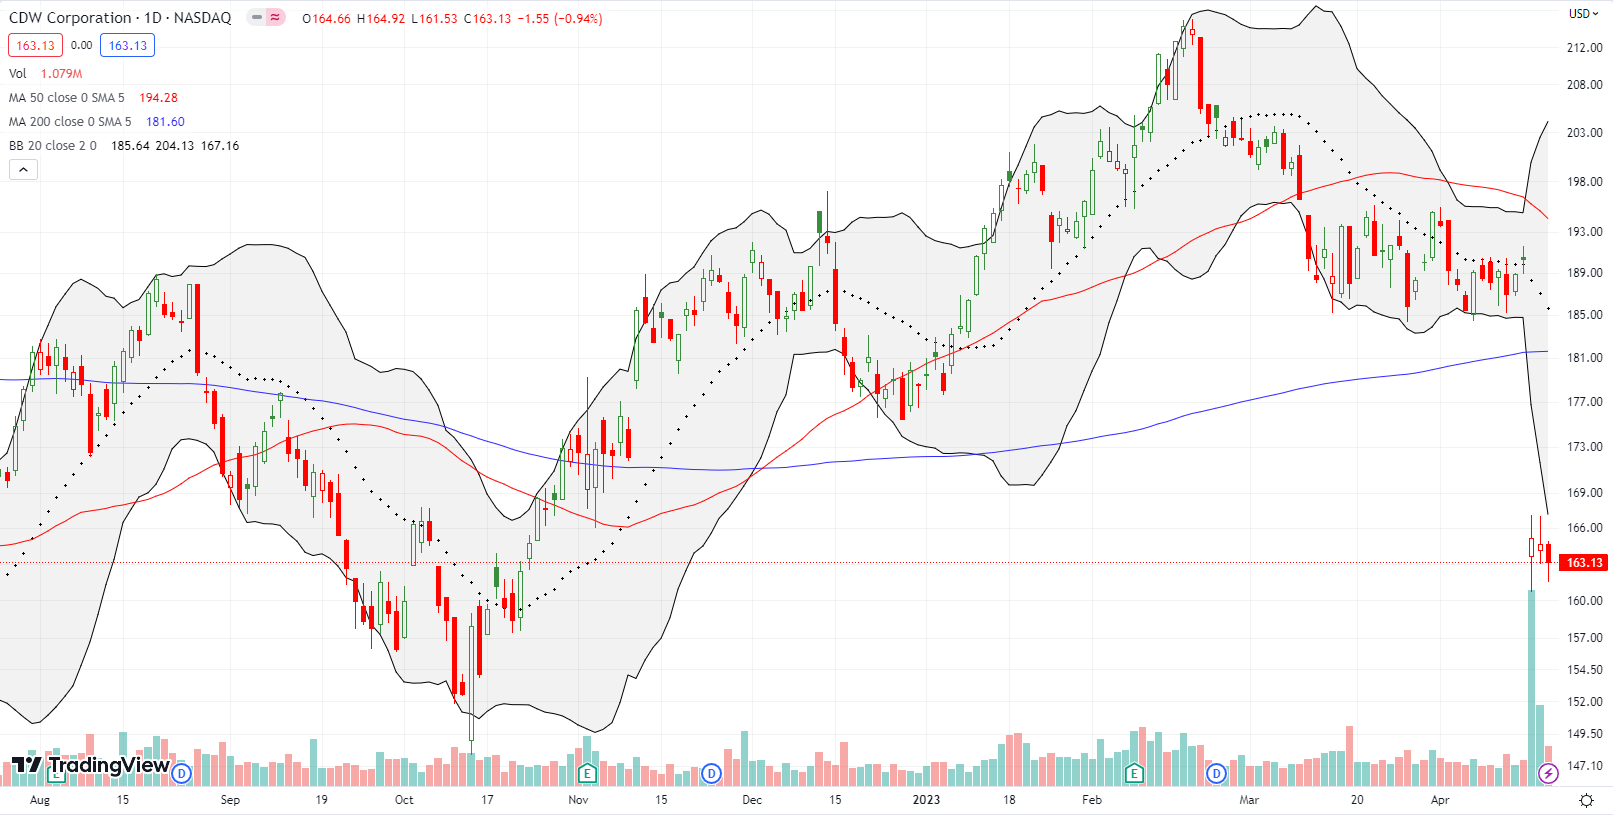
CDW Corporation (CDW) is an IT company that I have never tracked. Since it started publicly trading in 2014, CDW has ground its way steadily higher until the pandemic. CDW printed its last all-time high at the beginning of 2022. So after CDW plunged 13.2% post-earnings last week, my ears perked up. It seems CDW cited poor IT spending. That news puts the entire sector on notice.
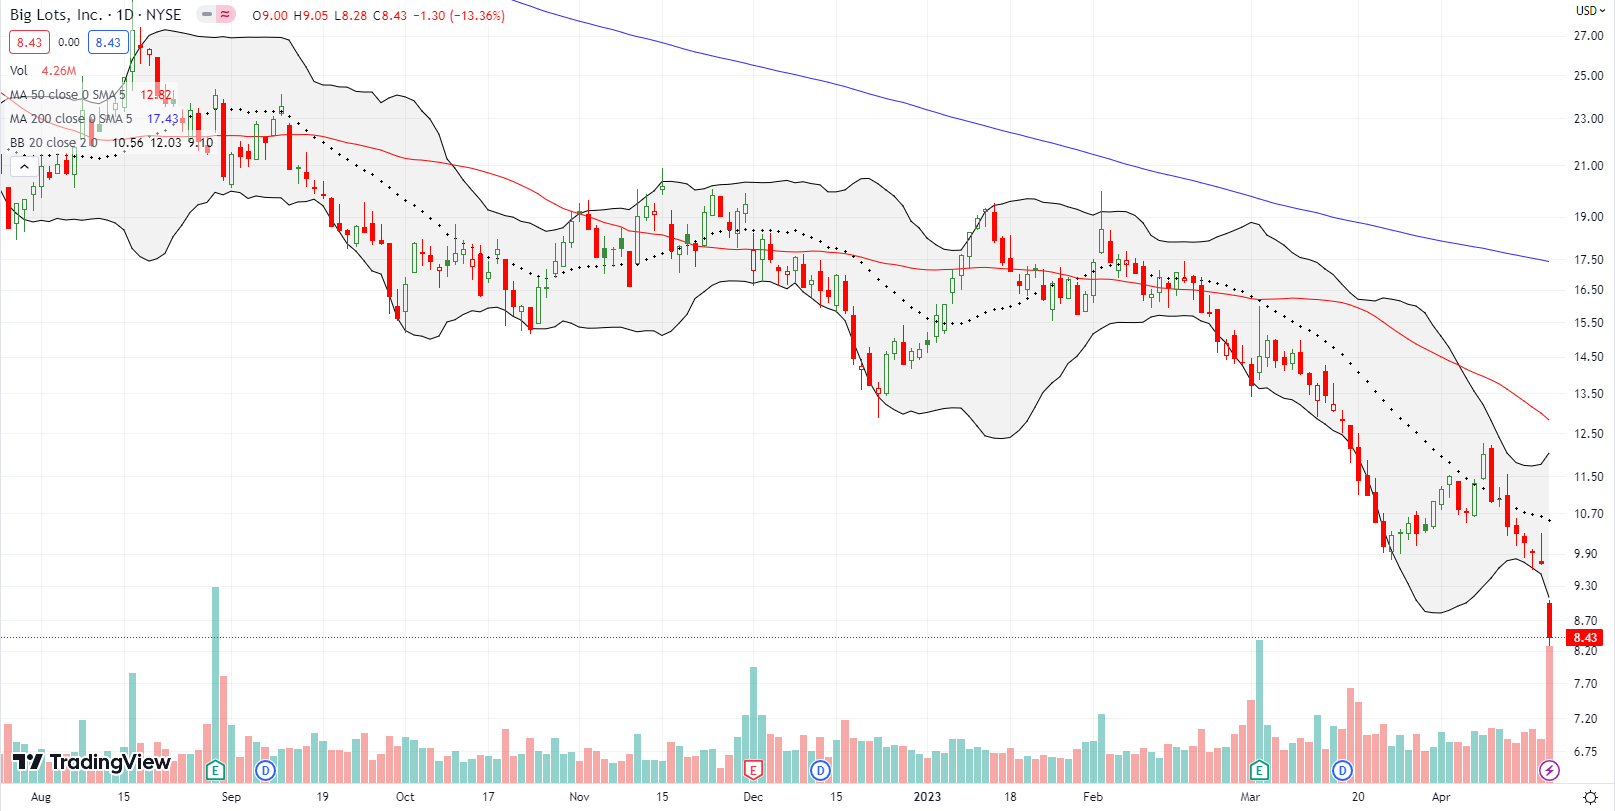
Big Lots, Inc (BIG) is selling at a steeper discount than the products it carries. The stock is so weak that a Piper Sandler downgrade to underweight was enough to cause a 13.4% drop to levels last seen in 2001. Needless to say, the stock’s persistent downtrend since the top 2 years ago provided plenty of warnings to-date.
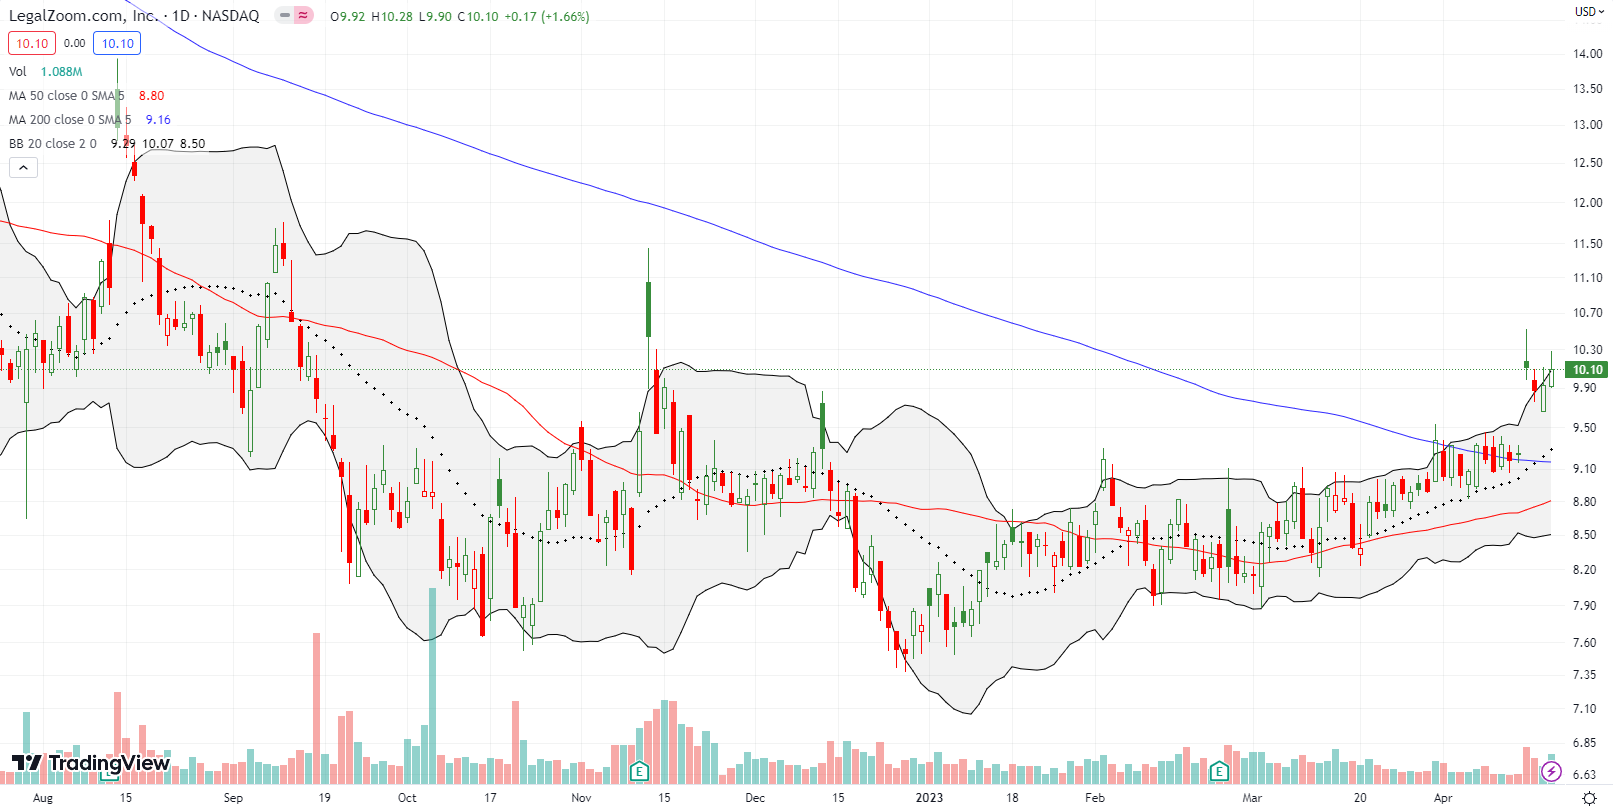
There is still some good news under the covers of the sleepwalking market. LegalZoom.com, Inc (LZ) broke out last week above 200DMA resistance thanks to a JMP Securities upgrade to market outperform from market perform. Note the stock had several false 50DMA breakouts while the 50DMA was in a downtrend. This breakout is more convincing with the 50DMA in an uptrend. I want to buy the stock here with a stop-loss below the 50DMA uptrend.
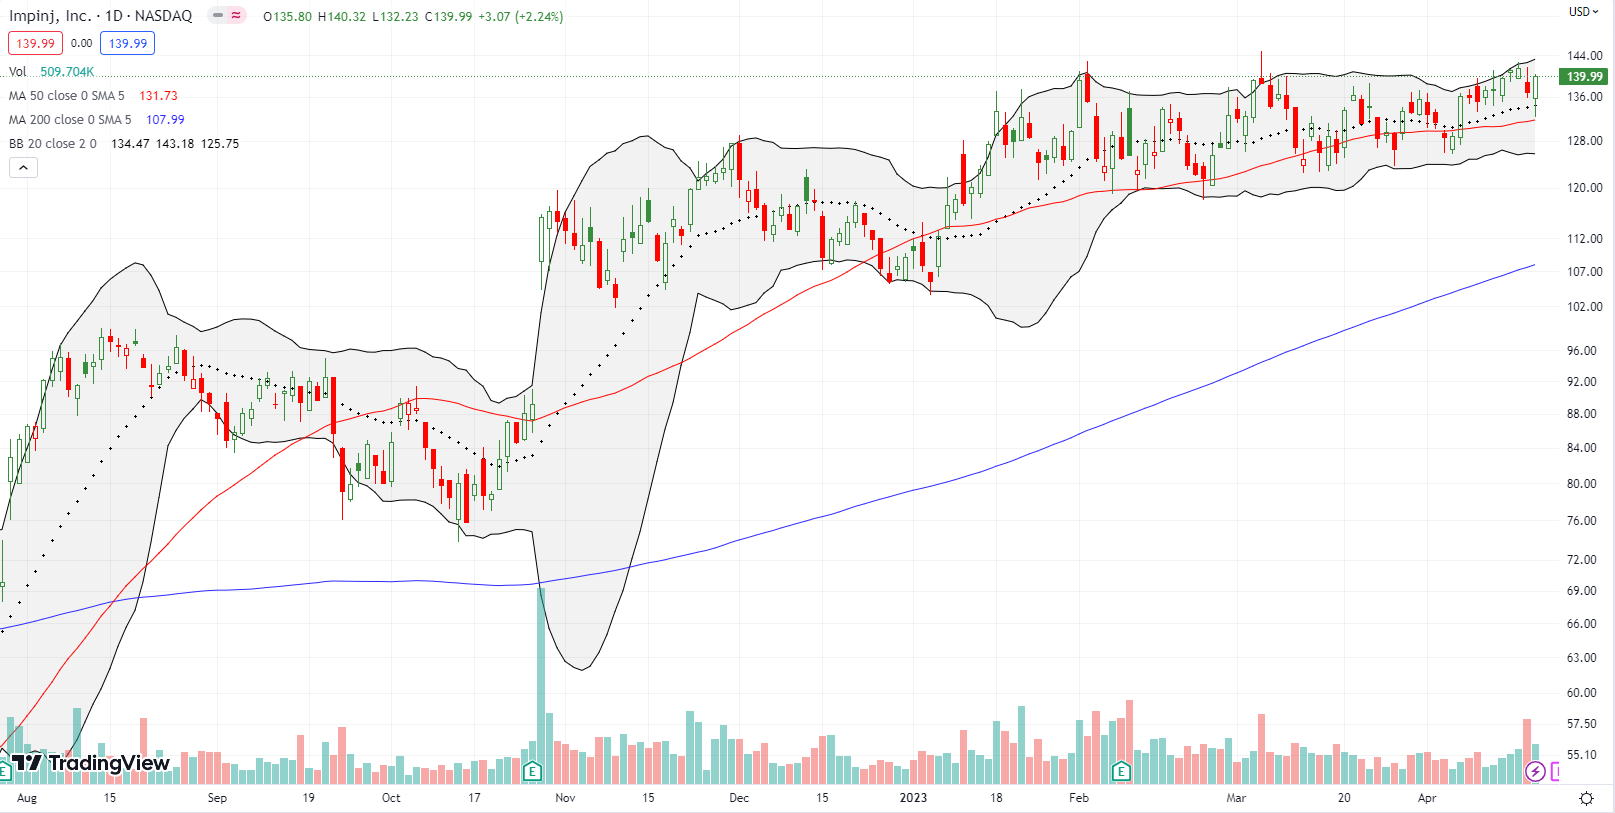
Impinj, Inc (PI), an IoT (internet of things) connectivity company, has been quietly sleepwalking through intermittent all-time highs since a 29.2% post-earnings breakout last October. This is the kind of stock I like to buy first with a covered call. However, with a triple-digit stock price, such a trade takes up too much capital. So, I will instead look for a long-dated call spread as a first attempt to ride this gradual uptrend that is defying gravity. PI’s rich valuation means that any bad news could send the stock abruptly plunging.
Be careful out there!
Footnotes
Subscribe for free to get email notifications of future posts!
“Above the 50” (AT50) uses the percentage of stocks trading above their respective 50-day moving averages (DMAs) to measure breadth in the stock market. Breadth defines the distribution of participation in a rally or sell-off. As a result, AT50 identifies extremes in market sentiment that are likely to reverse. Above the 50 is my alternative name for “MMFI” which is a symbol TradingView.com and other chart vendors use for this breadth indicator. Learn more about AT50 on my Market Breadth Resource Page. AT200, or MMTH, measures the percentage of stocks trading above their respective 200DMAs.
Active AT50 (MMFI) periods: Day #20 over 20%, Day #10 over 30% (overperiod), Day #2 under 40%, Day #33 under 50%, Day 43 under 60%, Day #45 under 70%
Source for charts unless otherwise noted: TradingView.com
Full disclosure: long QQQ put spread; long TSLA put, long SPY put spread, long ALLY put spread
FOLLOW Dr. Duru’s commentary on financial markets via StockTwits, Twitter, and even Instagram!
*Charting notes: Stock prices are not adjusted for dividends. Candlestick charts use hollow bodies: open candles indicate a close higher than the open, filled candles indicate an open higher than the close.


