
Stock Market Commentary
The stock market started the week in familiar melt-up mode, supported by a (temporary) thaw in the economic war between the U.S. and China. Optimism persisted until the Federal Reserve weighed in with its latest announcement on monetary policy, when Chair Jerome Powell balked at the idea of a December rate cut. That hesitation triggered immediate wobbles in the stock market. Most importantly, market breadth plunged and ended the week right at the same low caused by the reignition of U.S. vs China economic tensions in mid-October. Thus, at market breadth’s edge of a breakdown, the market has a kind of bearish divergence while the major indices are floating near all-time highs.
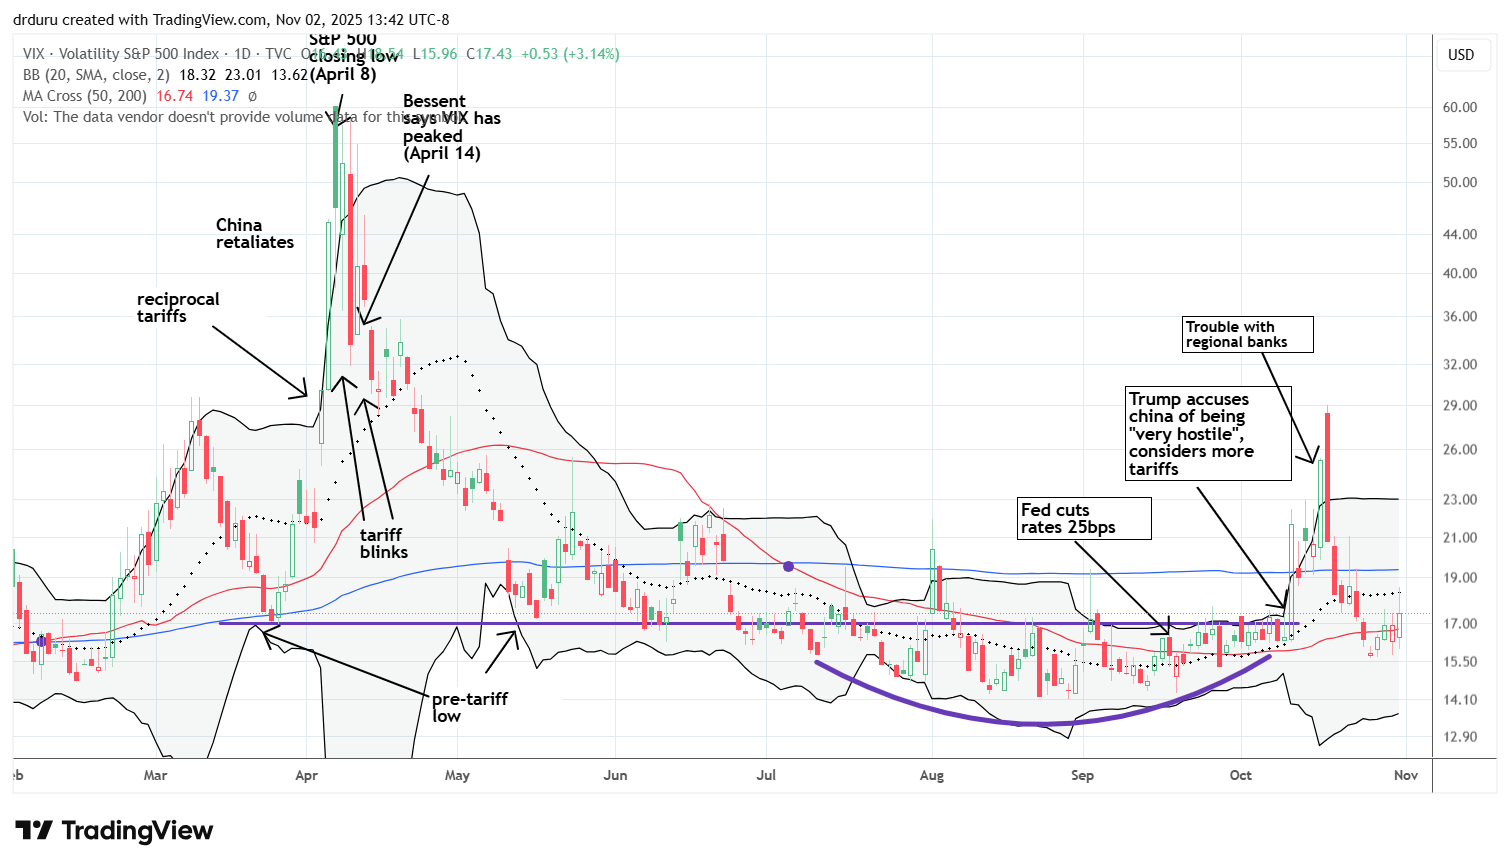
The VIX, meanwhile, has stopped descending and is showing signs of consolidation. This setup looks like volatility is regaining strength. Given the pullbacks during the market’s most dangerous months were so brief and shallow, I will not be surprised to see the VIX spike again in coming days or weeks.
Stock Market Commentary
The Stock Market Indices
S&P 500 (SPY)
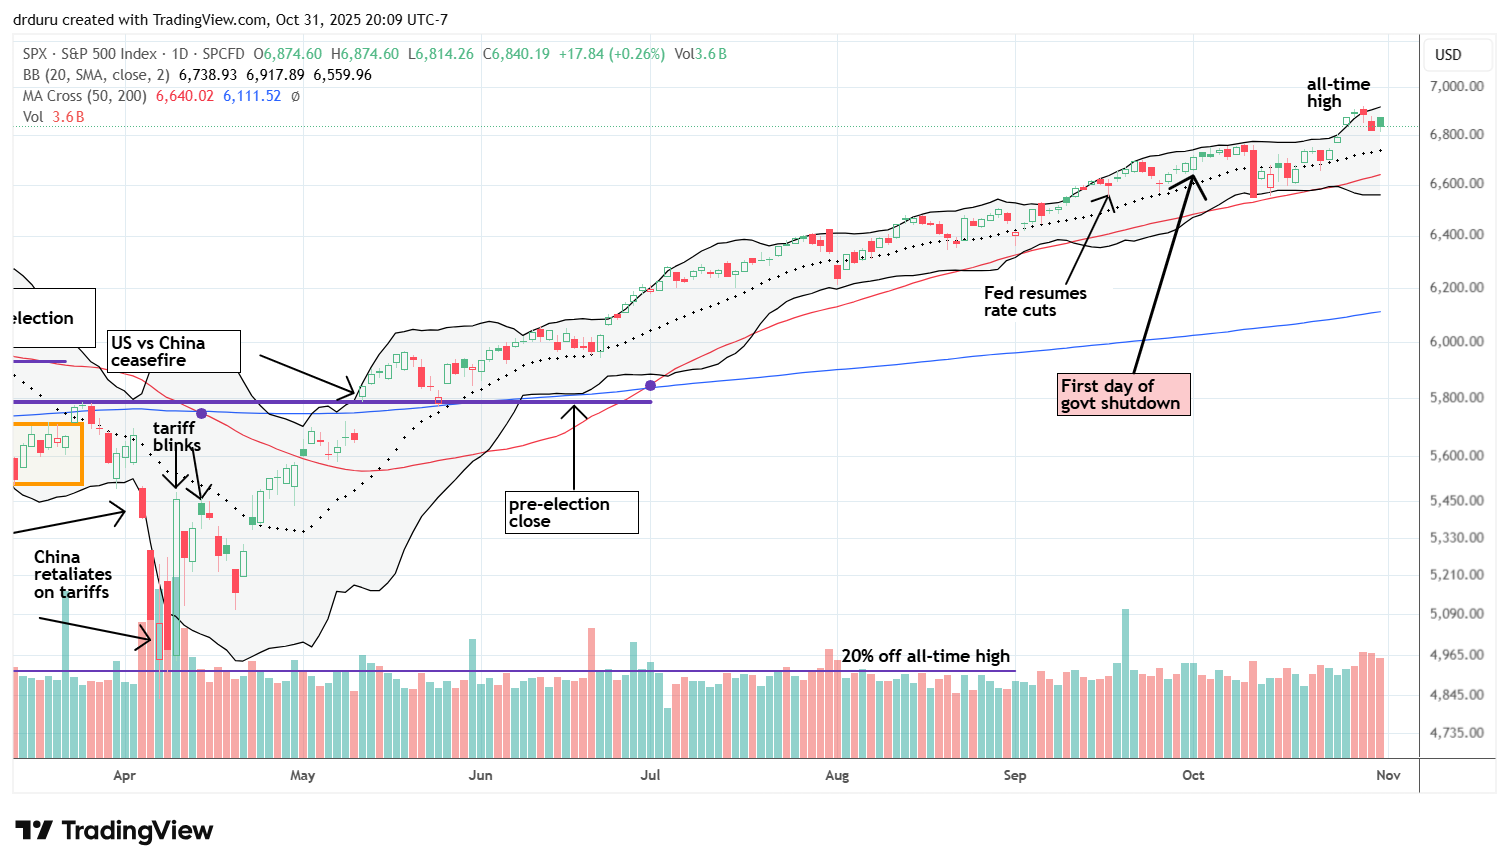
The S&P 500 (SPY) reached an all-time high on Tuesday before sellers jumped in after the Fed’s statement on monetary policy. The index lost about 1% midweek and looks set for a possible retest of its 20DMA uptrend in the next week or two. A true test of the 50DMA has not occurred in months, making a deeper pullback overdue. I remain short-term cautiously bullish overall, wary of an eventual true test of 50DMA support.
NASDAQ (COMPQX)
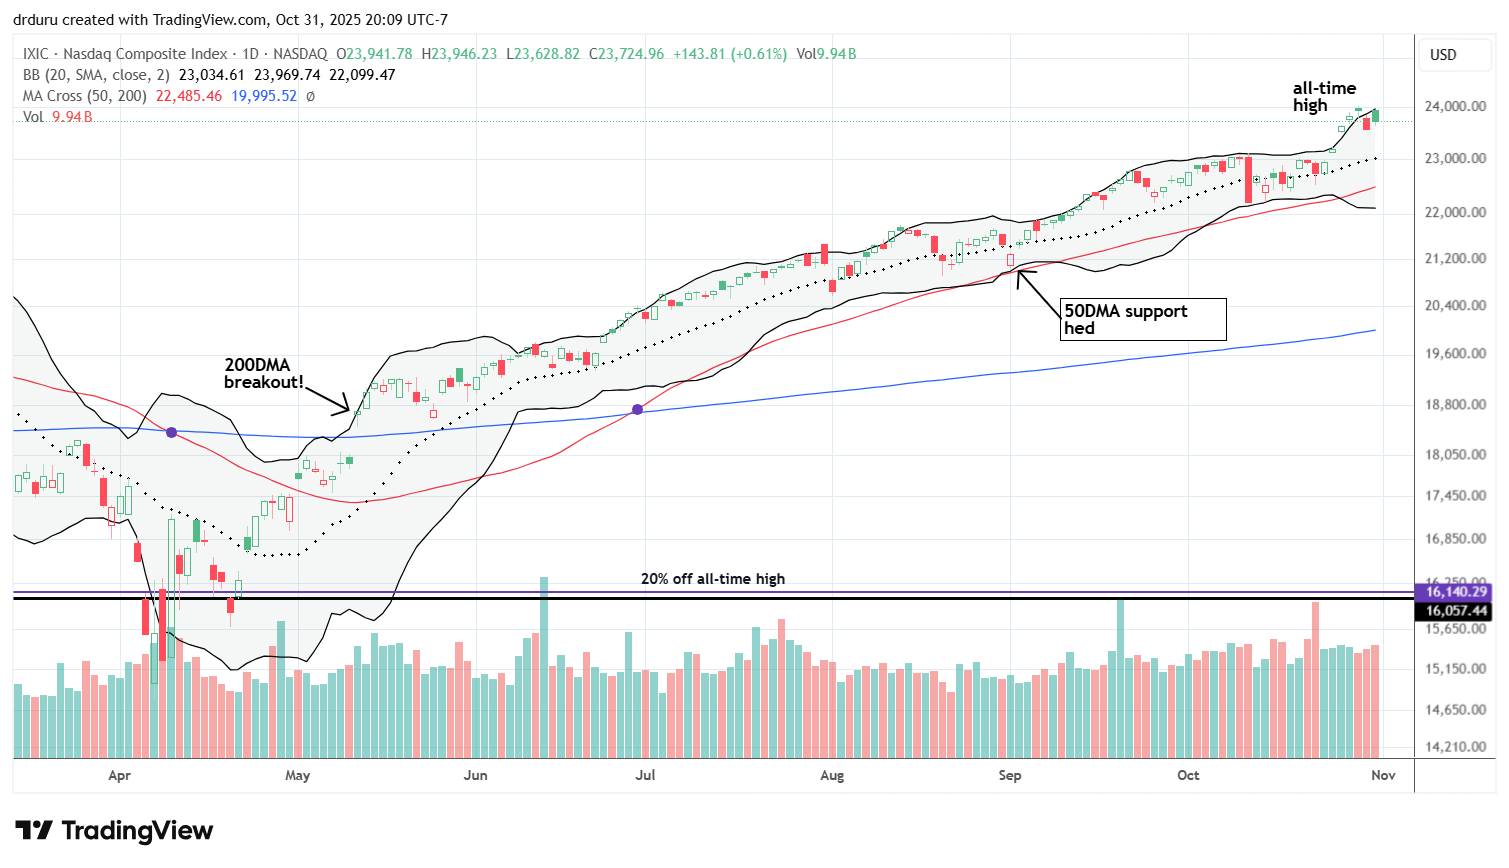
The NASDAQ showed relative strength versus the S&P 500, hitting an all-time high on Fed day. After a 1.6% drop the next day, the tech-laden index rebounded strongly. This resilience helped prevent a clean breakdown for market breadth.
iShares Russell 2000 ETF (IWM)
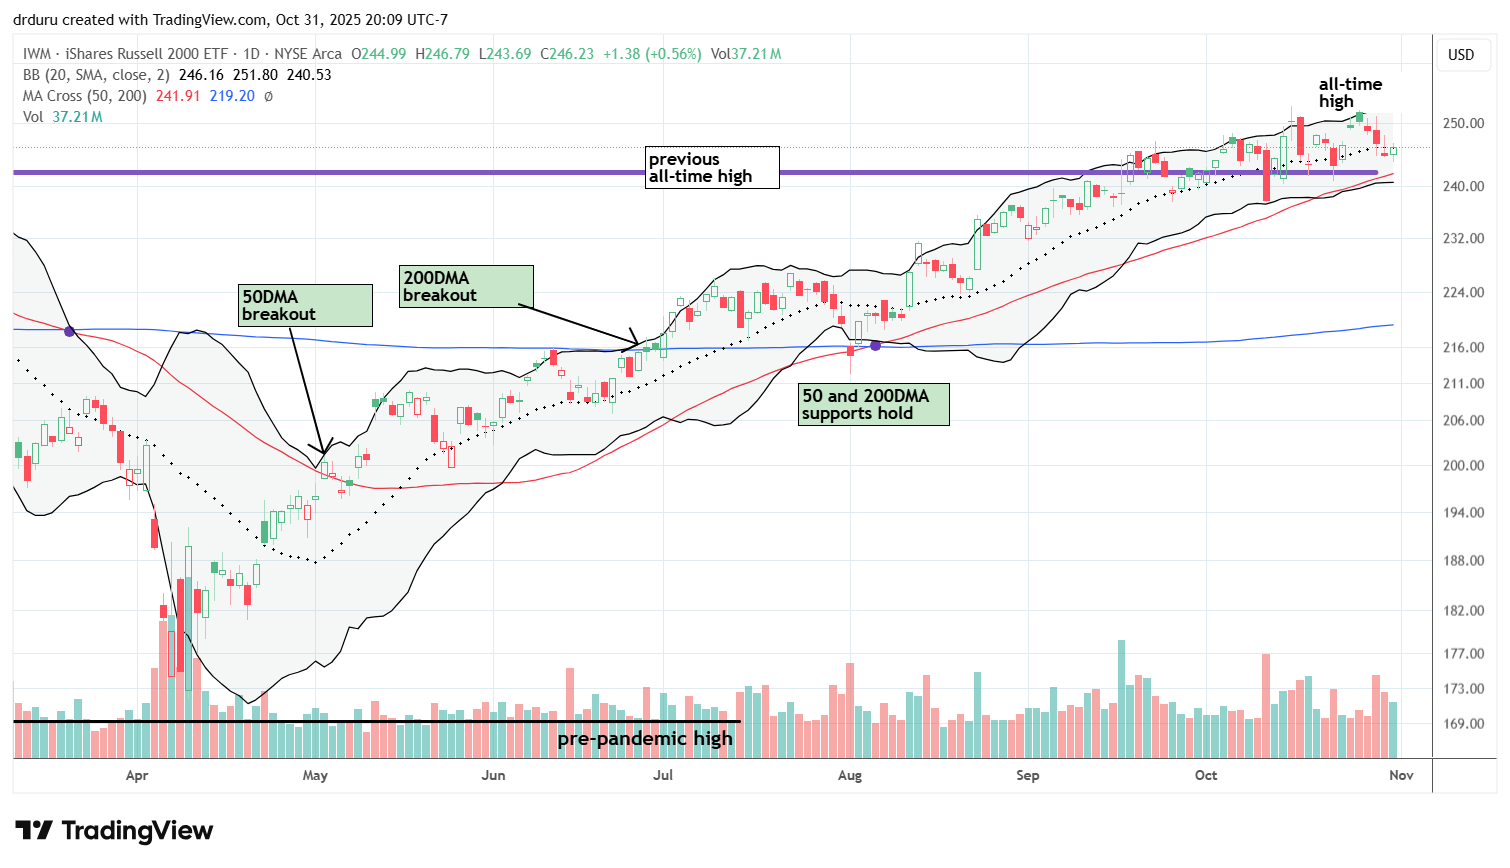
Small caps are back to lagging. IWM sold off most of the week before a tepid gain on Friday. IWM is now closing in on a critical test at the convergence of its prior all-time high and its 50-day moving average (DMA) (the red line below). I am holding a fresh set of IWM calls that expire this Friday, but that position looks tenuous.
The Short-Term Trading Call With the Breadth’s Edge
- AT50 (MMFI) = 41.4% of stocks are trading above their respective 50-day moving averages
- AT200 (MMTH) = 54.8% of stocks are trading above their respective 200-day moving averages
- Short-term Trading Call: cautiously bullish
AT50 (MMFI), the percentage of stocks trading above their respective 50DMAs, closed the week at 41.4%. This level represents fragile market health and underscores how few stocks are participating in the rally; most individual stocks are in bearish territory with 50DMA breakdowns or downtrends. AT50 sits on market breadth’s edge.
AT200, the percentage of stocks trading above their 200DMAs, looks relatively stronger than AT50 but still slipped below its range from earlier in the year. A breakdown below October’s low in AT200 would confirm a broad-based bearish turn in the market and force me to downgrade my short-term trading call. (I am already wary about being bullish at this juncture).
The Equities: Breadth’s Edge
Chipotle Mexican Grill (CMG)
Description: Chipotle Mexican Grill operates fast-casual restaurants specializing in burritos, bowls, tacos, and other Mexican-inspired dishes.
Technical status: The stock suffered an 8.2% post-earnings drop to a two-and-a-half-year low, confirming a long-running downtrend that began soon after a 50-to-1 stock split.
Trade commentary: I earlier shifted from short-term trading and profit-taking to a longer-term hold on CMG. While this latest post-earnings collapse was not in my playbook of possibilities, I was prepared by holding a small position. Still, I am not adding to the position here. CMG looks like dead money for now, reflecting broader weakness in consumer=facing stocks.
")
Coursera (COUR)
Description: Coursera provides an online platform for digital learning, offering courses and degrees from universities and institutions worldwide.
Technical status: COUR dropped 13% post-earnings, finishing a reversal of its prior 36% summer post-earnings rally and confirming a breakdown below its 200DMA.
Trade commentary: I exited my position after the post-earnings selloff and took a loss. The stock remains broken, and I am not looking to buy dips from here.
")
Stride, Inc (LRN)
Description: Stride provides online and blended learning programs for students and educational institutions.
Technical status: LRN collapsed 54% post-earnings and hit a 52-week low despite a strong multi-year uptrend beforehand.
Trade commentary: I am watching LRN for a potential comeback. I am not hopeful given the broadening struggles of education-related stocks like COUR. Confirmation of a potential buy will come from higher closes or a new post-earnings high.
")
DraftKings (DKNG)
Description: DraftKings operates a digital sports entertainment and gaming platform offering sports betting and fantasy contests.
Technical status: DKNG sold off 5.5% on new competition from PolyMarket and continued lower until a minor gain on Friday.
Trade commentary: DKNG sits near the bottom of a two-year trading range, making next week’s earnings critical for direction.
")
Fiserv Inc (FI)
Description: Fiserv, Inc operates as a fintech company providing digital financial services and lending products.
Technical status: FI lost 44% post-earnings on a big earnings miss and leadership restructuring, extending a persistent downtrend that has kept it below its 50DMA for months.
Trade commentary: FI is an example of a stock where prior post-earnings losses in the middle of a persistent downtrend warned traders to stay away. I have zero interest in speculating on this collapse to a near 8-year low.
")
Sea Limited (SE)
Description: Sea Limited provides digital entertainment, e-commerce, and financial services primarily in Southeast Asia.
Technical status: SE fell 9.6% without news on October 16 for a 50DMA breakdown. The next day, Bank of America (BAC) tried to save the stock and failed with an upgrade and $215 price target.
Trade commentary: SE is a tempting buy given how it is hovering above 200DMA support (the blue line). However, I am content to wait to see what happens after upcoming earnings.
")
SPS Commerce (SPSC)
Description: SPS Commerce provides cloud-based supply chain management solutions.
Technical status: SPSC plunged 21% post-earnings to a five-year low after a long downtrend. Buyers stepped in off the intraday low.
Trade commentary: SPSC is a new stock for me. I put it on my watch list as I study the prospects for an eventual comeback. After enjoying a decent uptrend, SPSC has suffered 4 straight significant post-earnings losses.
")
United Parcel Service (UPS)
Description: United Parcel Service provides package delivery, logistics, and supply chain management services.
Technical status: UPS surged 8% post-earnings but remains in a four-year downtrend. The stock stopped cold under 200DMA resistance.
Trade commentary: I bought shares near pandemic lows and sold a covered call before earnings. I made an exception to my rule to avoid stocks in a long-term downtrend because I think UPS at the pandemic lows makes no sense…unless some kind of economic calamity is waiting around the corner.
")
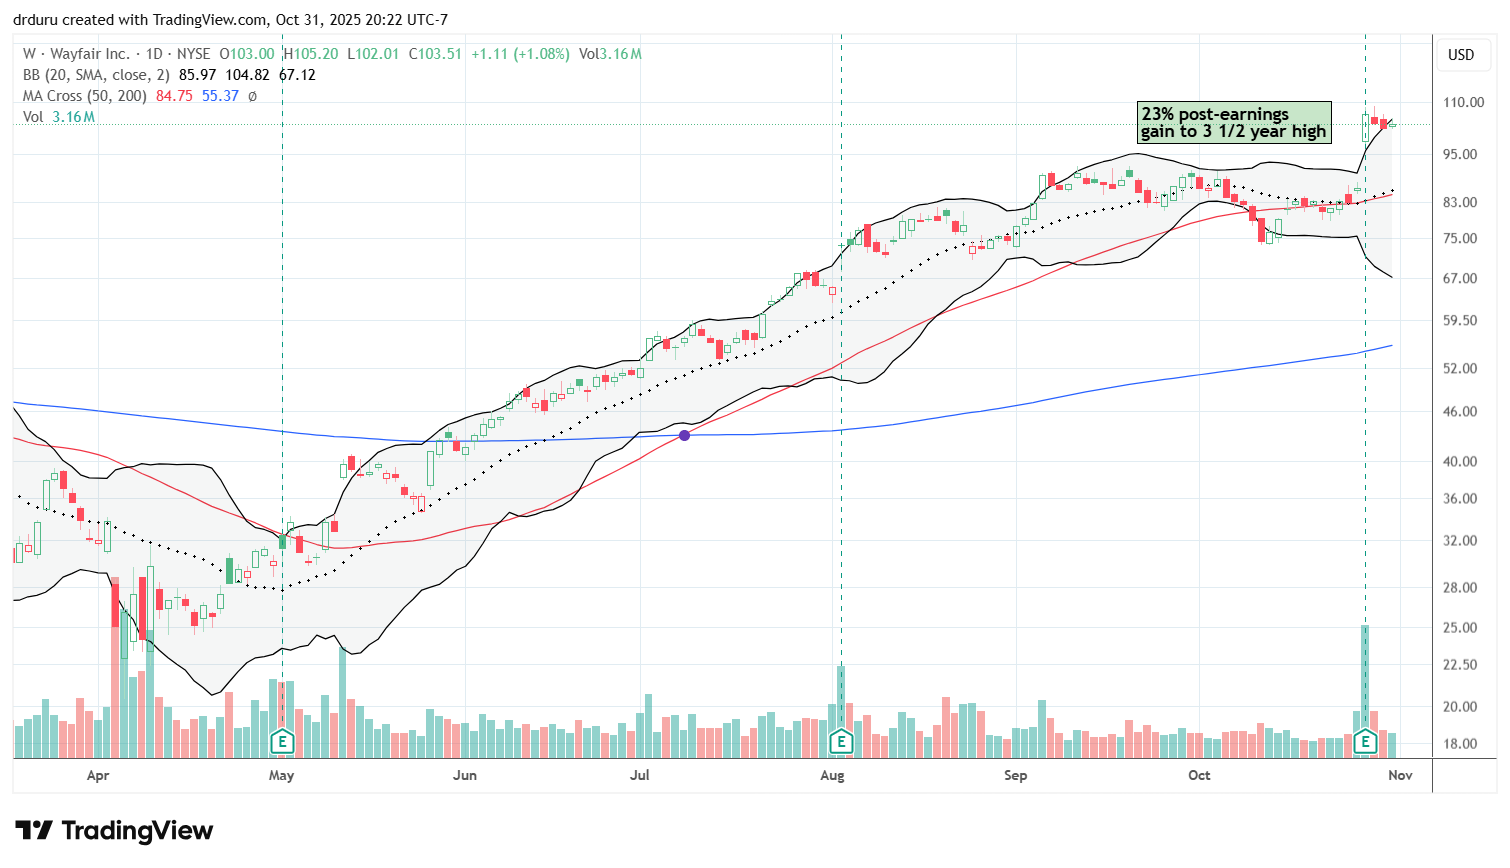
Wayfair (W)
Description: Wayfair operates an e-commerce platform for home furnishings and décor.
Technical status: W surged 23% post-earnings to a three-and-a-half-year high, bucking the trend of weak Consumer-facing stocks.
Trade commentary: W stands out as a rare winner in a struggling consumer sector. The stock is a “beautiful house in an ugly neighborhood.” I doubt I will but the dips in W given overall weakness in the sector.
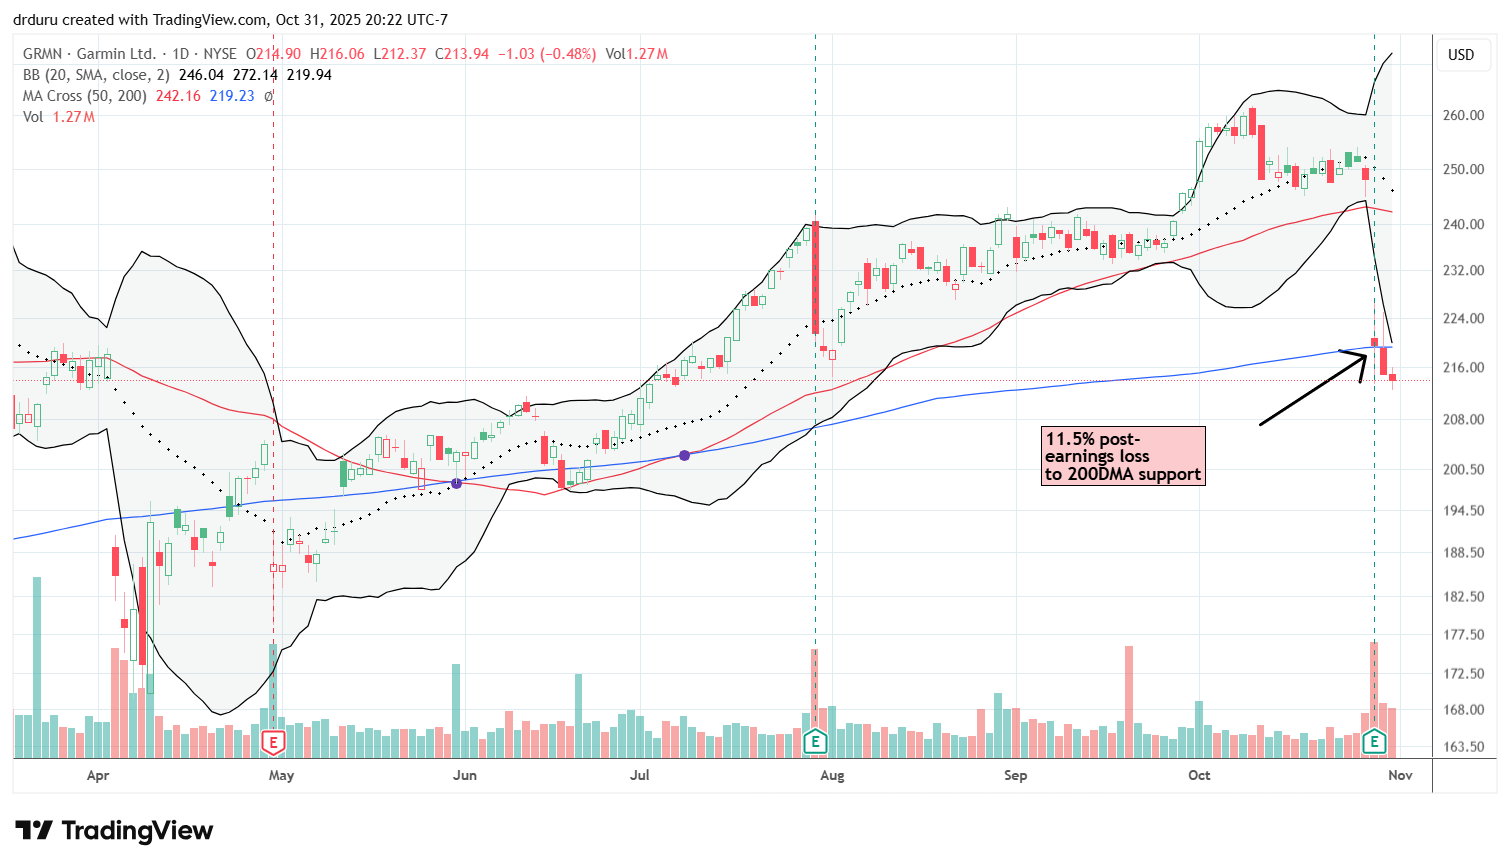
Garmin (GRMN)
Description: Garmin designs and sells GPS navigation and wearable technology products.
Technical status: GRMN fell 11.5% post-earnings, breaking below 200DMA support and entering bearish territory.
Trade commentary: I will not short GRMN, as the stock could easily snap back. The confirmed 200DMA breakdown confirms technical weakness, but I will monitor the stock for a comeback. GRMN staged a comeback from the previous post-earnings loss.
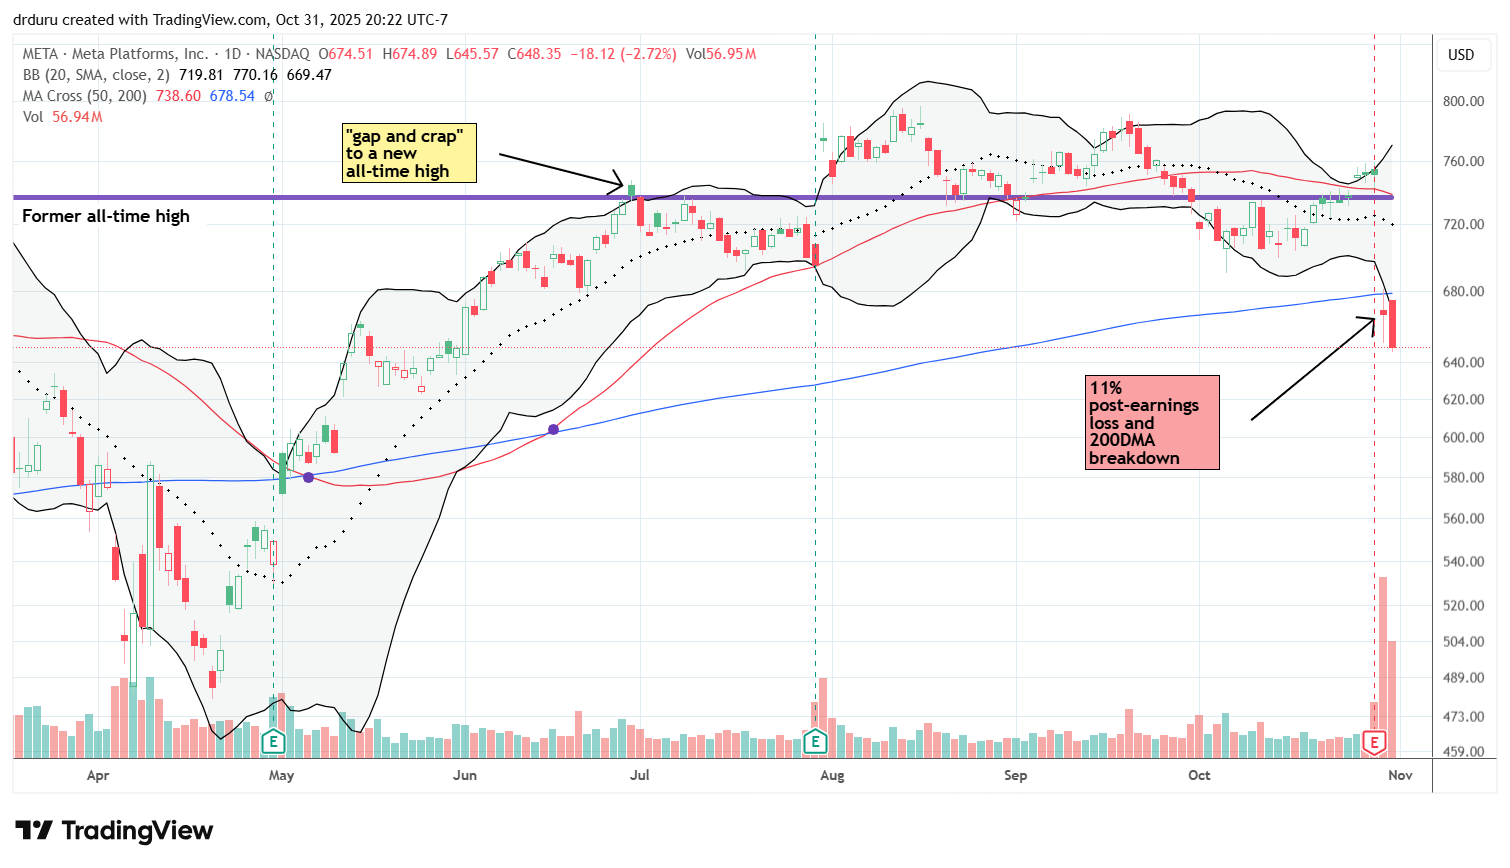
Meta Platforms (META)
Description: Meta Platforms operates social media and digital advertising platforms including Facebook and Instagram.
Technical status: META dropped 11% post-earnings, slicing through its 200DMA support after committing to extra capital investments in AI.
Trade commentary: After META flipped short-term bearish, I decided not to trade the stock. This latest breakdown confirms a top after months of resistance near its former highs. The “gap and crap” from the previous pop to an all-time high looms large as the beginning of an extended topping pattern….and a theme for a number of big cap tech stocks.
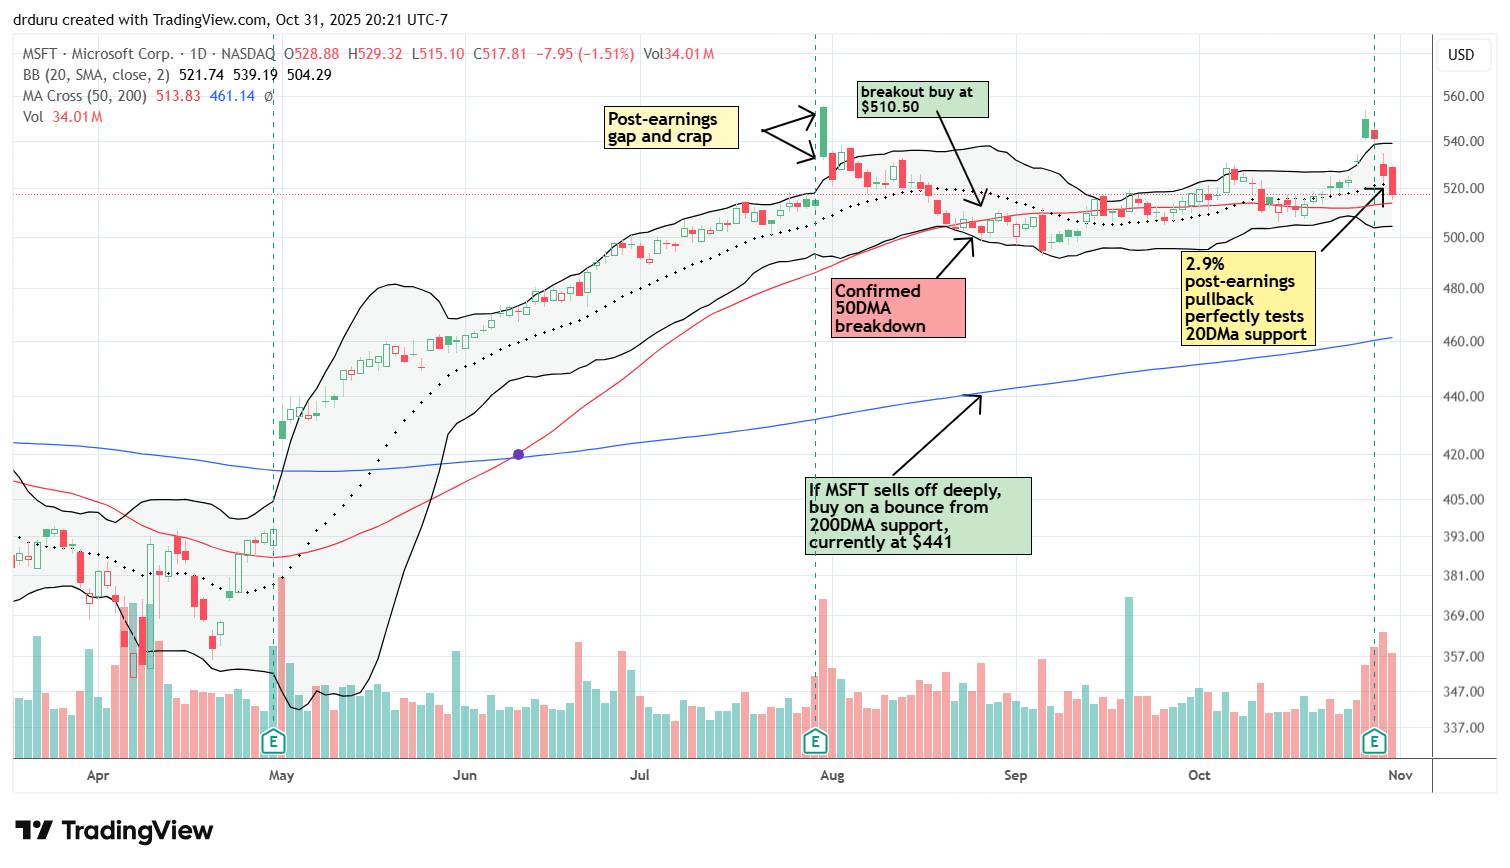
Microsoft (MSFT)
Description: Microsoft develops and licenses software, hardware, and cloud services.
Technical status: MSFT failed to hold pre-earnings gains, dropping 2.9% post-report and testing its 20DMA support (the dashed line).
Trade commentary: I hold MSFT long-term but see an extended (short-term?) topping pattern emerging starting from the gap and crap from the previous post-earnings reaction. Note how the pre-earnings pop stopped short of challenging the intraday all-time high. If 50DMA support holds, I will speculate with call options on a rebound to reverse the post-earnings loss.
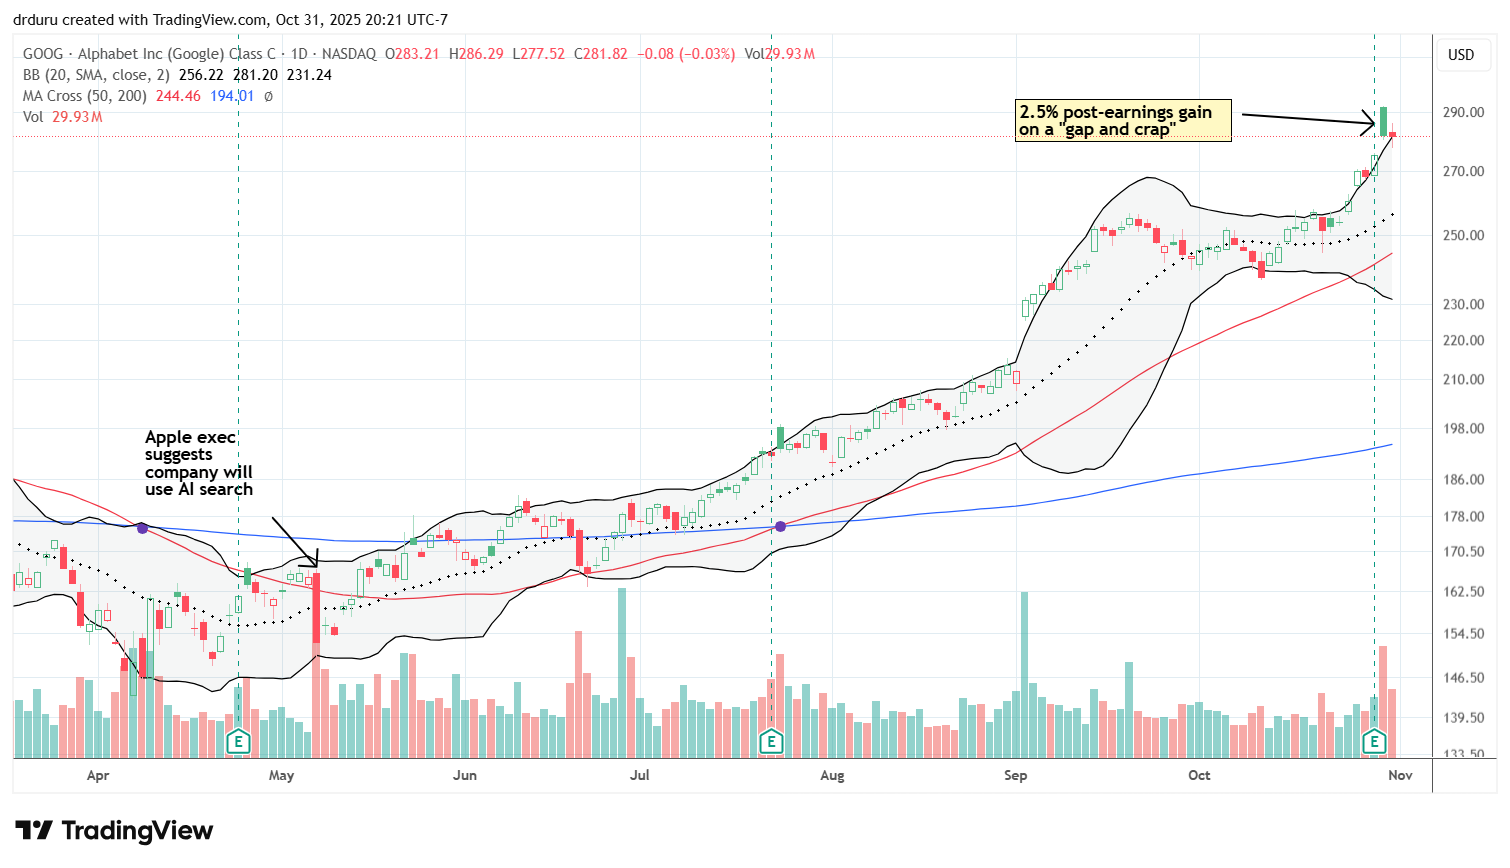
Alphabet (GOOG)
Description: Alphabet provides digital advertising, search, and cloud services through Google and other platforms.
Technical status: GOOG gained 2.5% post-earnings despite a gap and and crap fade.
Trade commentary: Google looks extended during this run along its upper Bollinger Band (BB). Given the various gap and crap patterns marking topping pattern in big cap tech stocks, I am very wary of a top for GOOG here. I am a buyer at 20DMA and 50DMA support.
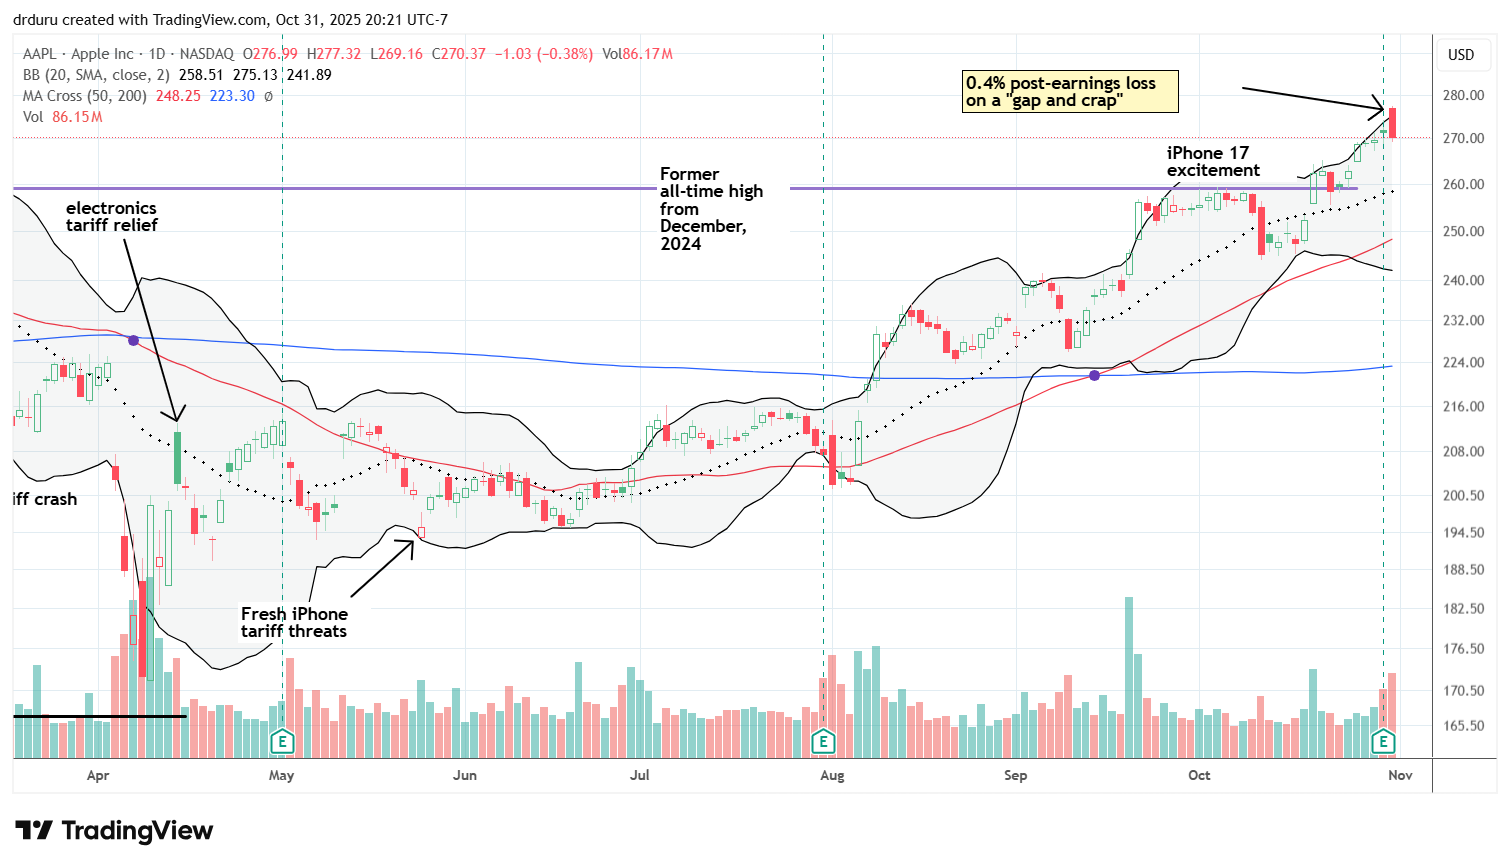
Apple (AAPL)
Description: Apple designs, manufactures, and sells smartphones, computers, and digital devices.
Technical status: AAPL gapped up on earnings but reversed to close down 0.4%, forming a bearish engulfing pattern on a gap and crap fade.
Trade commentary: My pre-earnings calendar call trade did not pan out. I reloaded by selling a call option against the long portion of the calendar call. I am of course wary about yet another gap and crap post-earnings response on a big-cap tech stock.
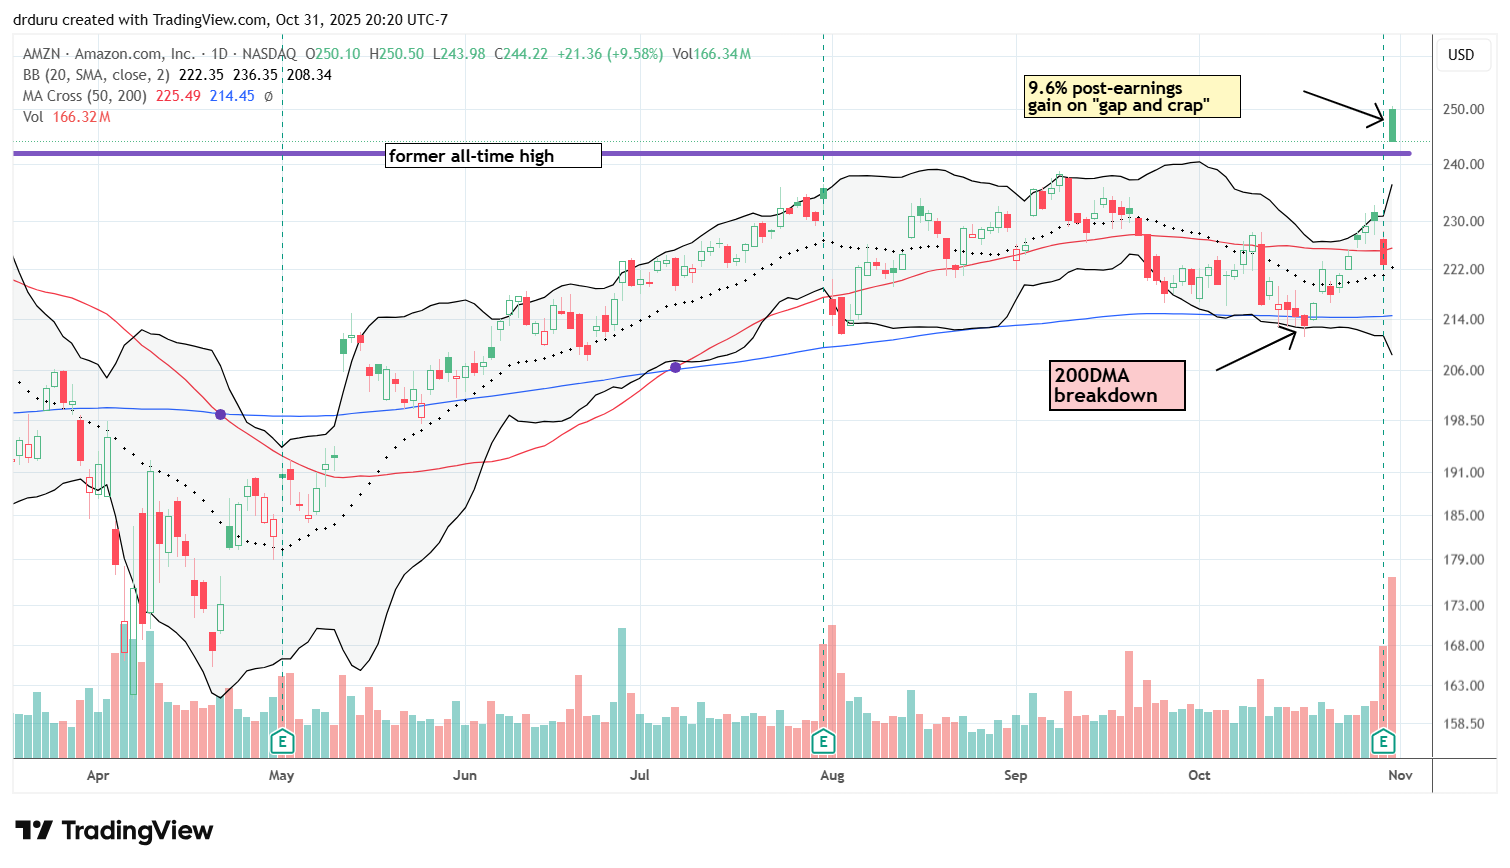
Amazon.com (AMZN)
Description: Amazon.com operates global e-commerce, cloud computing, and digital streaming businesses.
Technical status: AMZN gained 9.6% post-earnings after faking a breakdown below its 200DMA earlier in the week.
Trade commentary: My bearish trade did not work out. I was tempted to take profits on the calendar put spread, but I did not want to make a discretionary move on a trade paired with the AAPL post-earnings trade (which was also profitable ahead of earnings, ironically enough). While I reversed course with a call spread betting on the typical pattern of AMZN being higher two weeks after earnings, I am very wary about yet another gap and crap on a big cap tech stock. Combined with market breadth’s edge of a breakdown, these topping patterns are yellow flags.
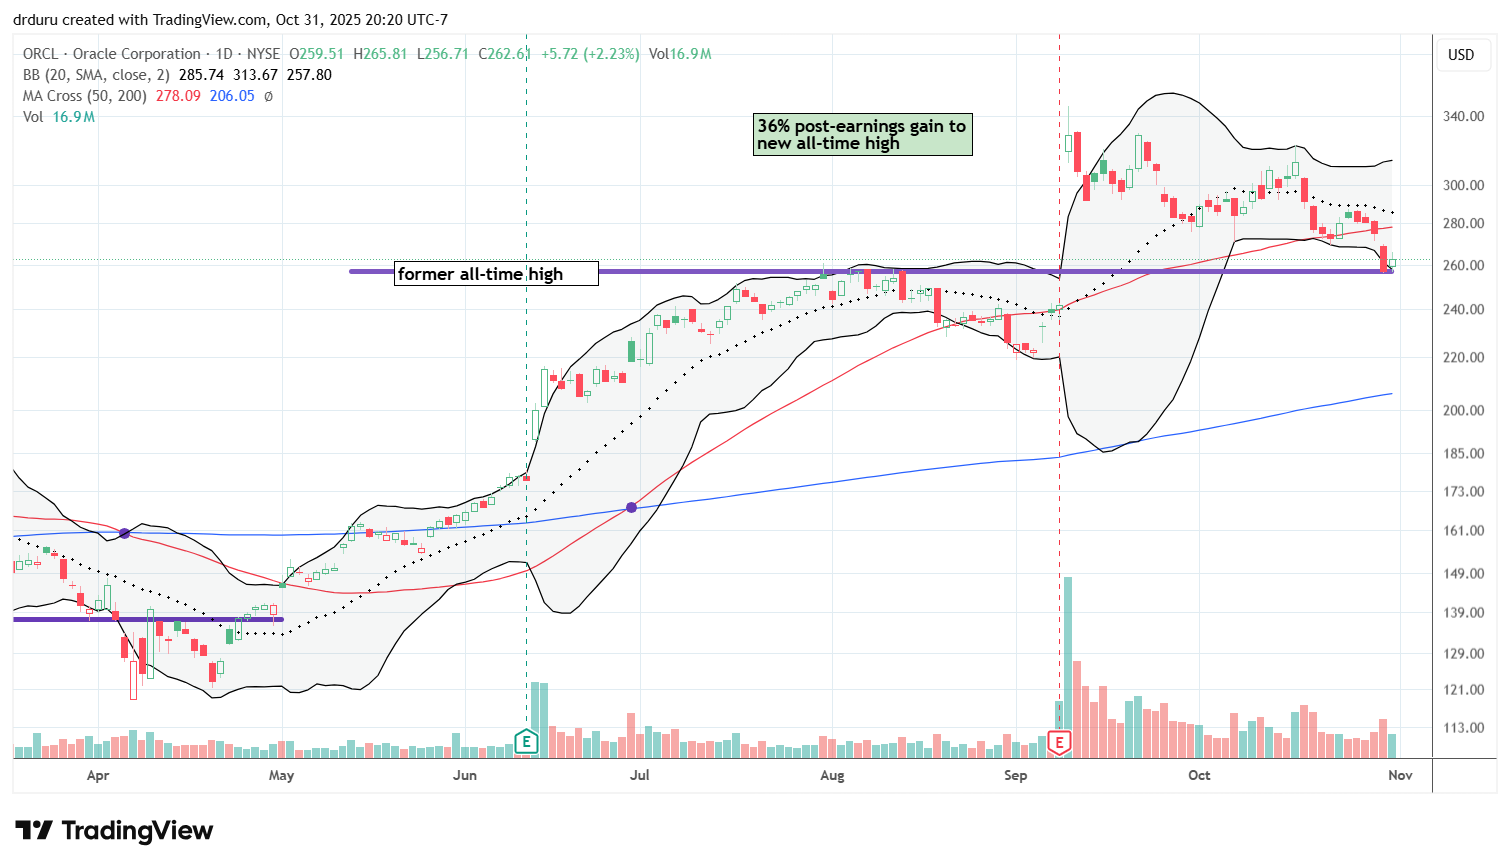
Oracle (ORCL)
Description: Oracle develops enterprise software and cloud infrastructure products.
Technical status: ORCL dropped confirmed a 50DMA breakdown but held its former all-time high as support.
Trade commentary: ORCL may be the first big cap tech of the bunch signaling a topping out in these stocks. A slip below the former all-time high will put in a play a complete reversal of ORCL’s big 36% post-earnings surge.
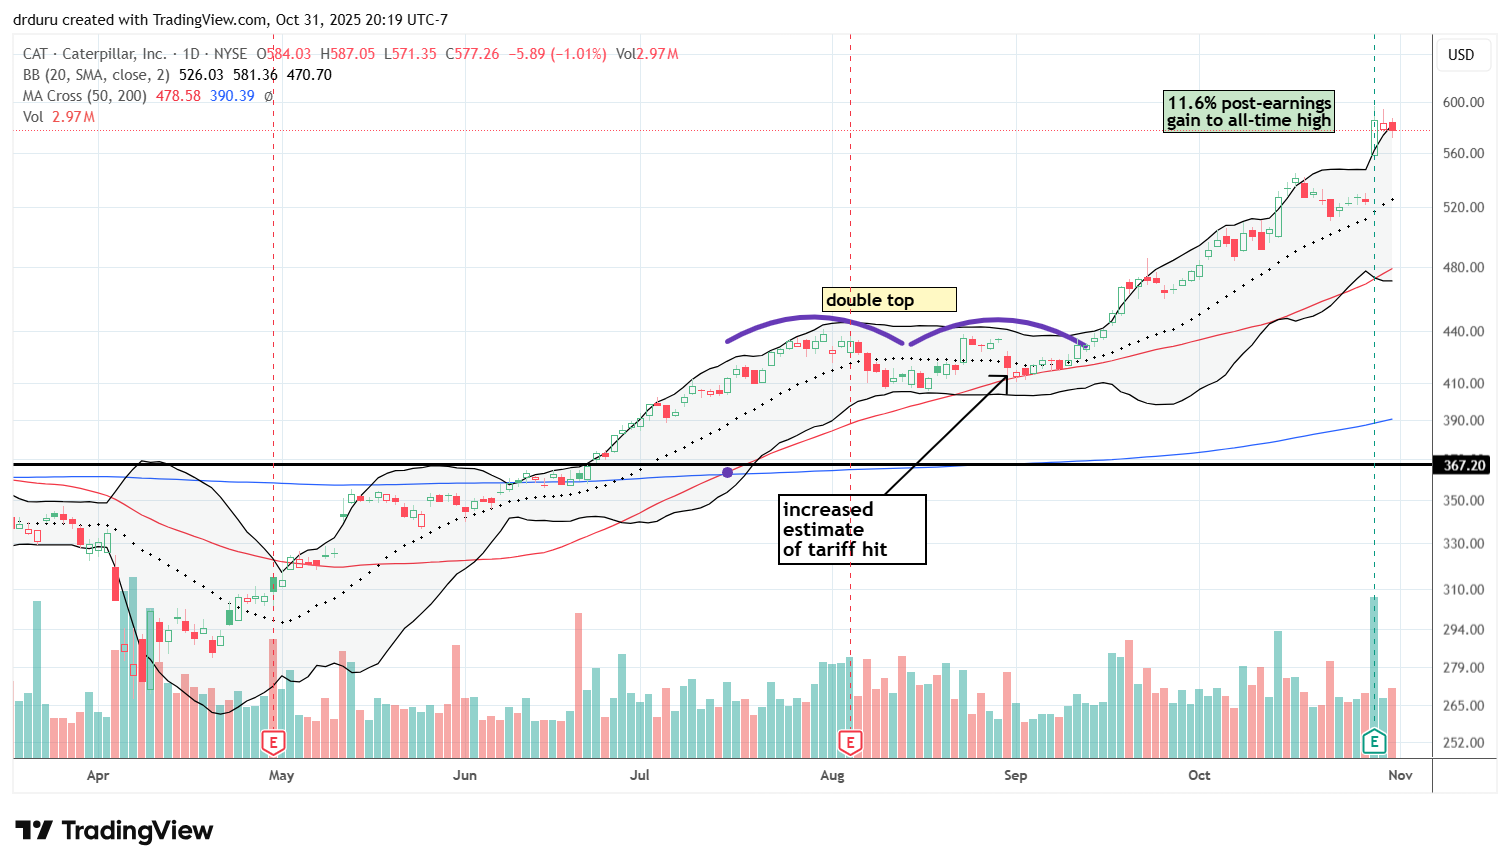
Caterpillar, Inc (CAT)
Description: Caterpillar manufactures heavy machinery and engines for construction and resource industries.
Technical status: CAT soared 11.6% post-earnings on surging demand for construction of data centers linked to AI infrastructure.
Trade commentary: I now view CAT as an AI play. Its bullish breakout confirms renewed strength and strongly contrasts with the gap and crap patterns of big cap tech.
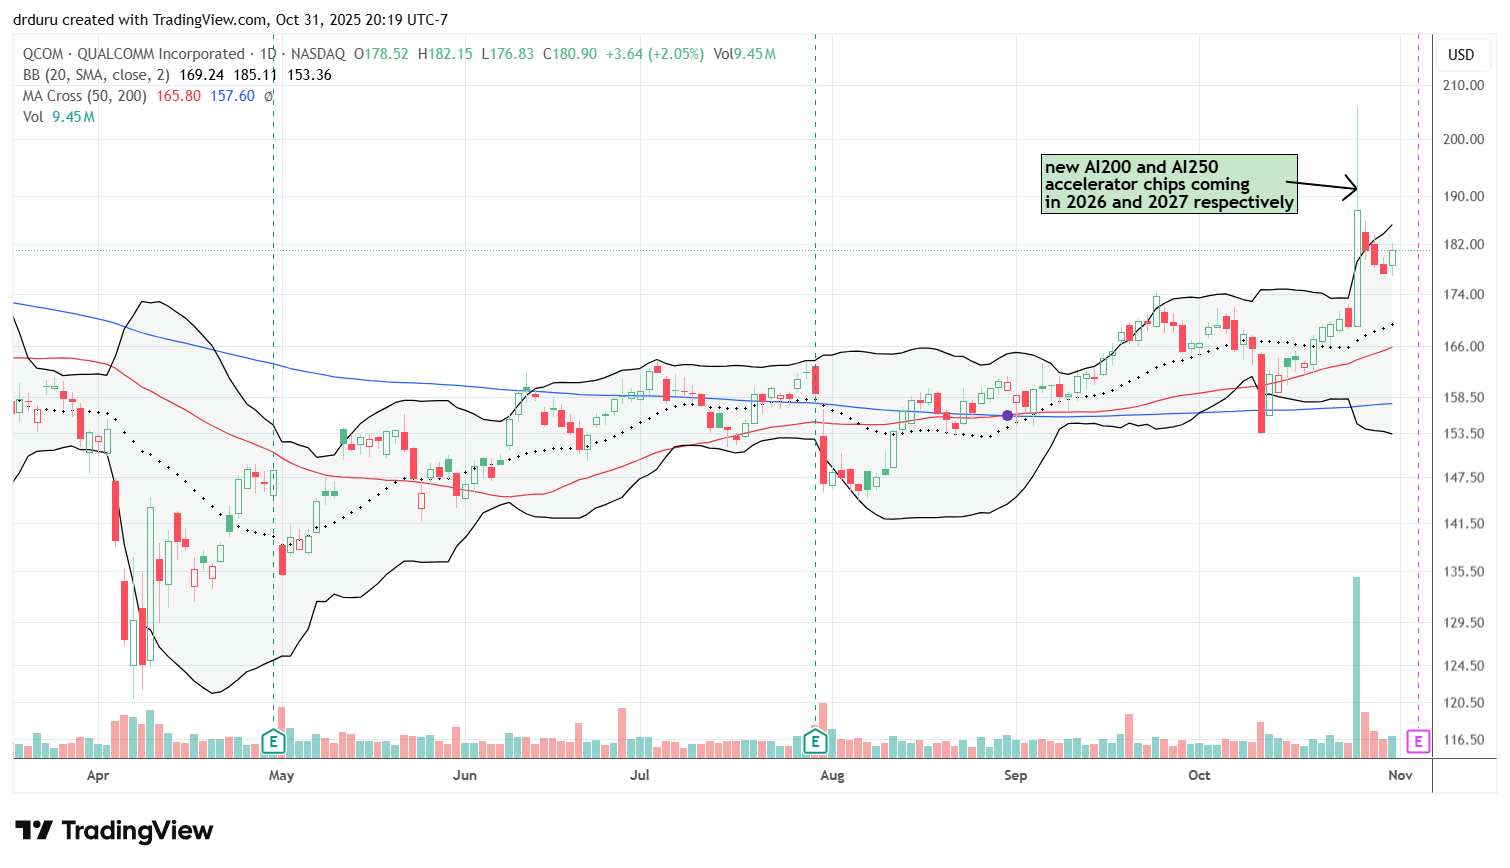
QUALCOMM Incorporated (QCOM)
Description: QUALCOMM designs semiconductors and wireless communication technology for mobile devices.
Technical status: QCOM spiked 11.1% on AI chip news but quickly faded from the intraday high, suggesting the AI hype has already peaked.
Trade commentary: I am watching to see how QCOM fares after upcoming earnings. The surge and sharp fade warns of rapid buyer exhaustion over AI-related news that will not contribute financial results for at least another year.
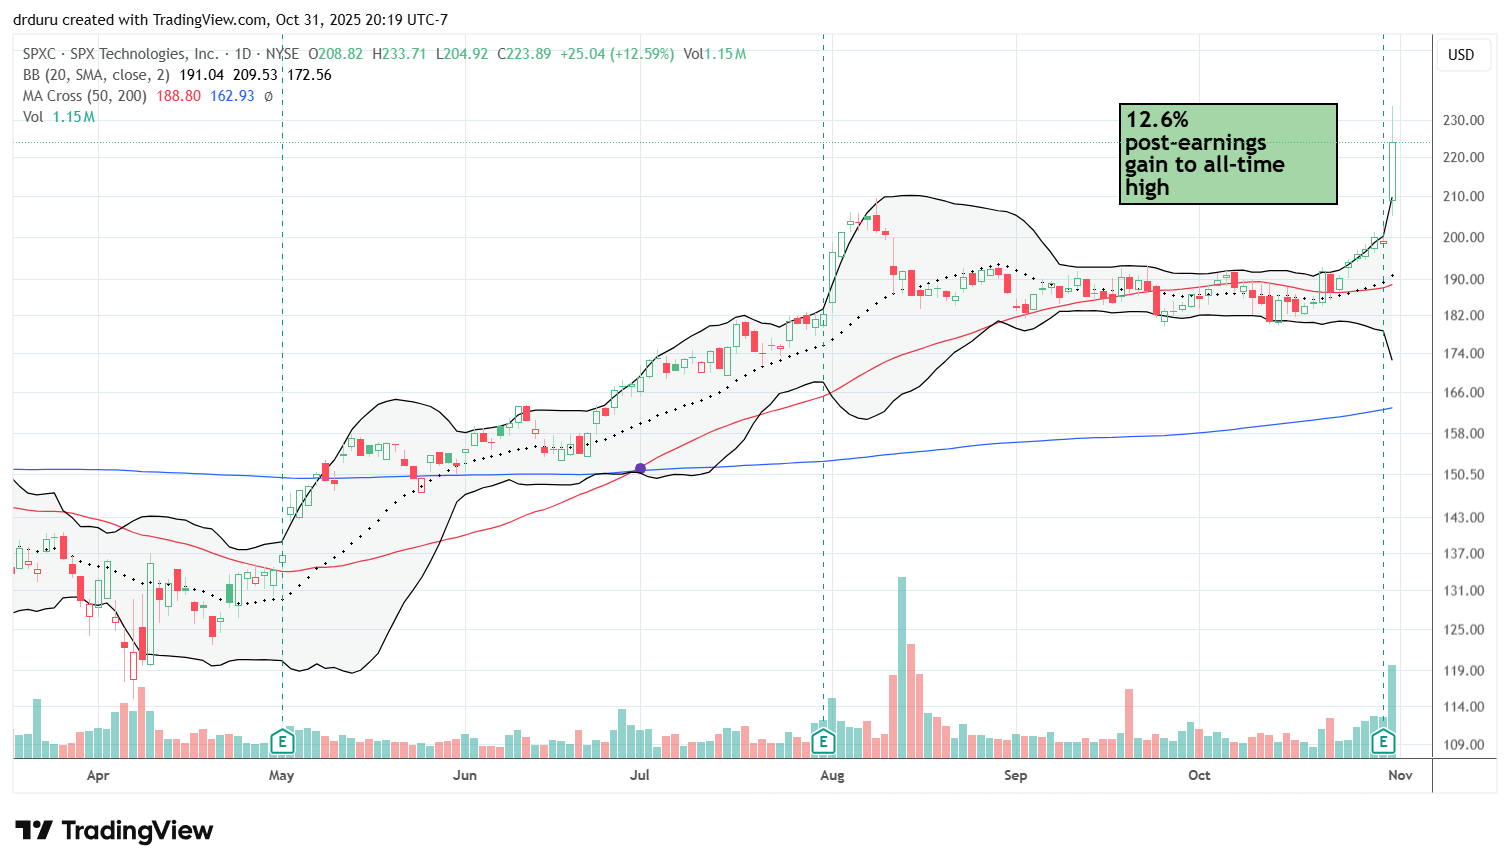
SPX Technologies (SPXC)
Description: SPX Technologies provides infrastructure equipment and solutions for industrial and energy markets.
Technical status: SPXC gained 12.6% post-earnings to reach new all-time highs.
Trade commentary: I bought SPXC after discovering the stock in a CNBC segment covering the stocks directly benefiting from the AI-driven power needs of data centers. I covered these stocks in the video below.
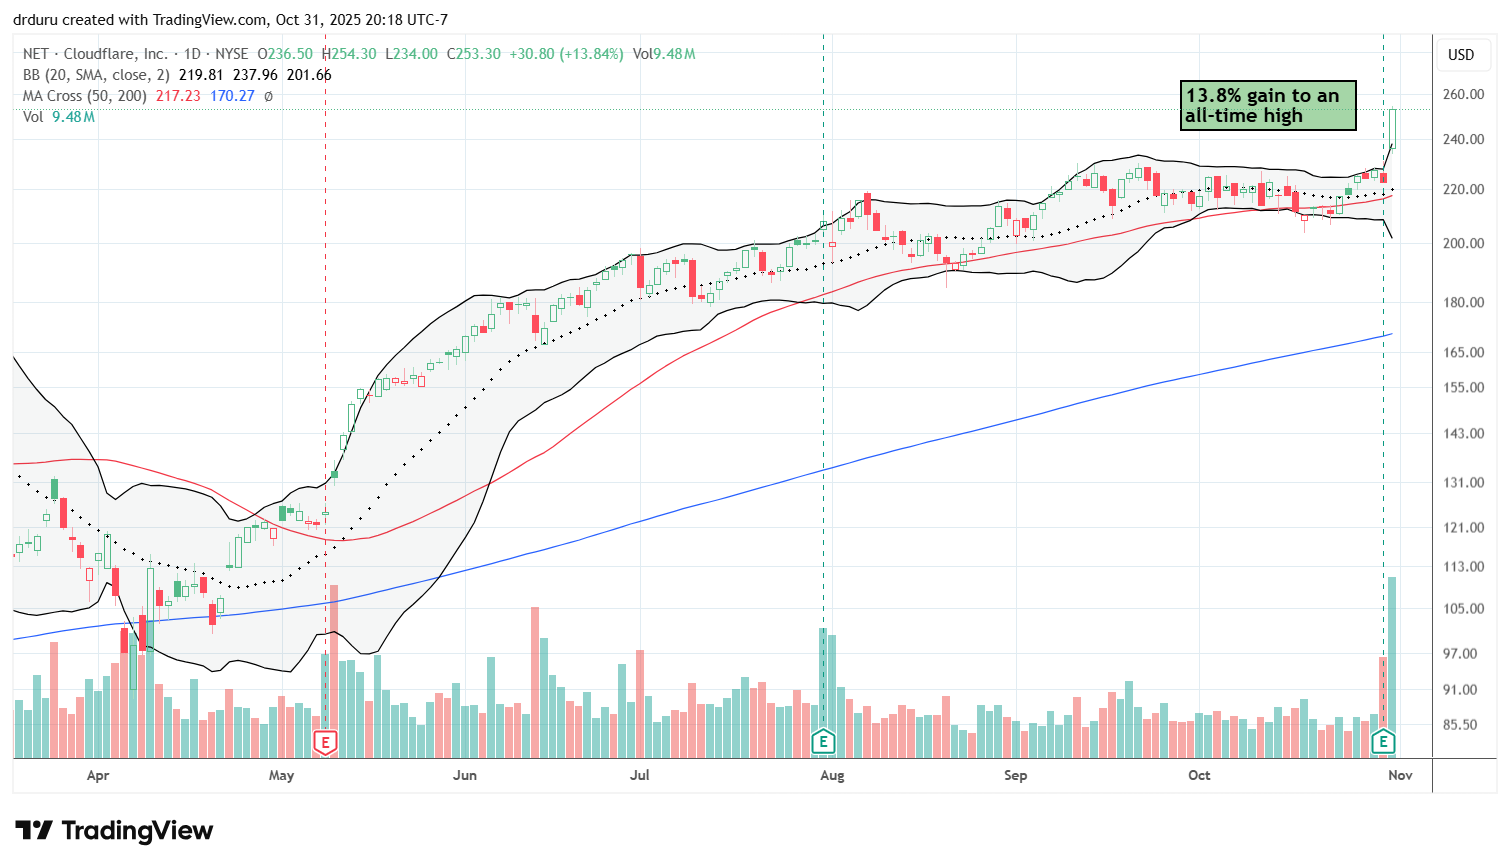
Cloudflare (NET)
Description: Cloudflare provides web performance and security services through its global cloud network.
Technical status: NET gained 13.8% post-earnings, reaching a new all-time high.
Trade commentary: I took profits earlier on NET due to valuation concerns despite my earlier claim to making this stock a long-term hold. I still like Cloudflare’s strategy to help publishers monetize AI-related data, but I just can no longer bring myself to pay at these sky-high valuations.
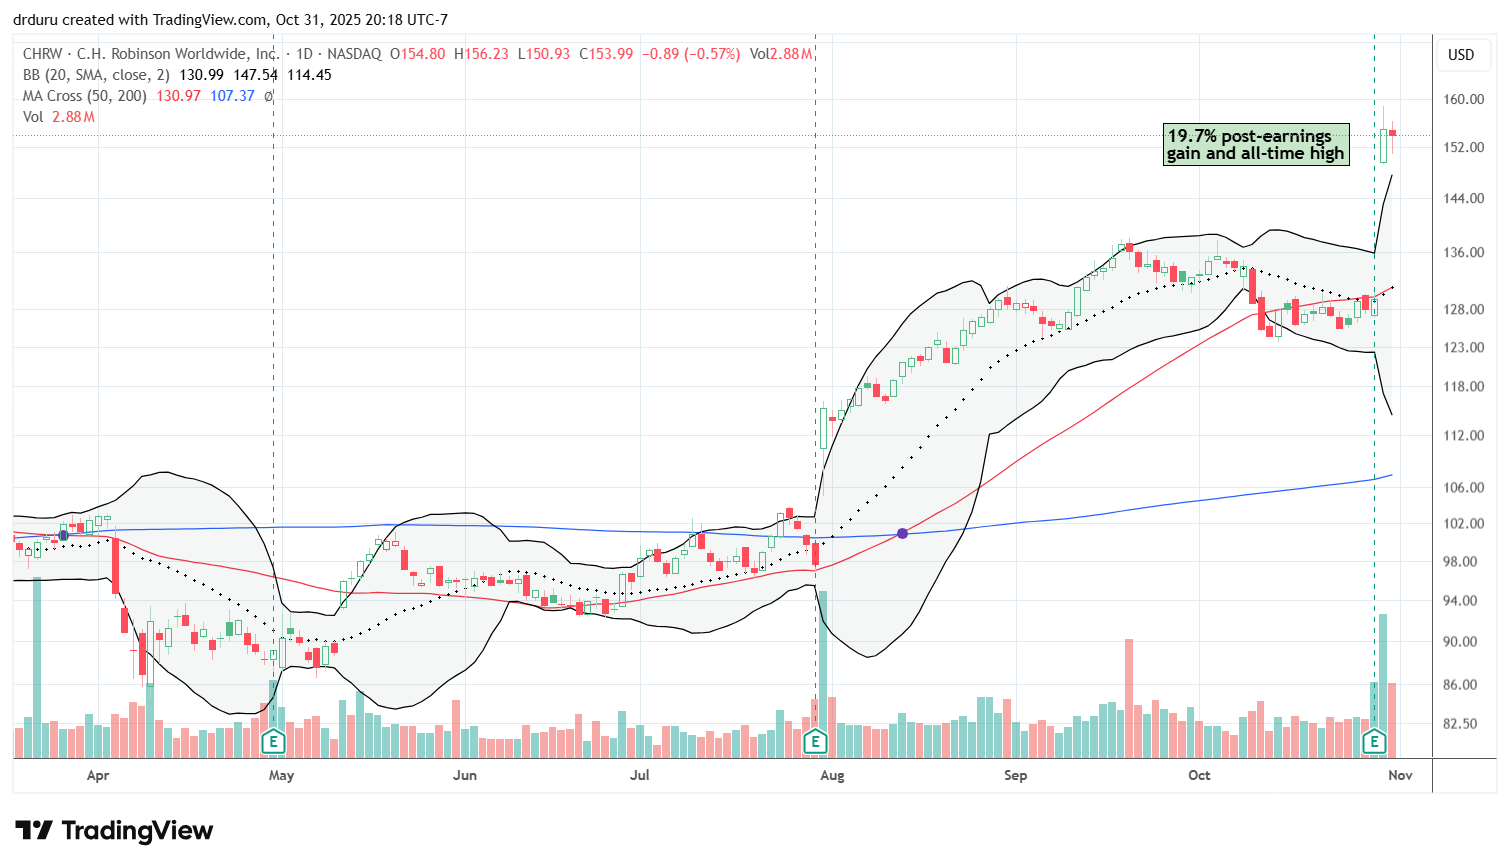
C.H. Robinson Worldwide (CHRW)
Description: C.H. Robinson provides freight transportation, logistics, and supply chain services.
Technical status: CHRW gained 19.7% post-earnings to an all-time high, breaking free from prior 50DMA resistance.
Trade commentary: I am interested in buying dips; this post-earnings surge signals (surprising) strength in logistics.
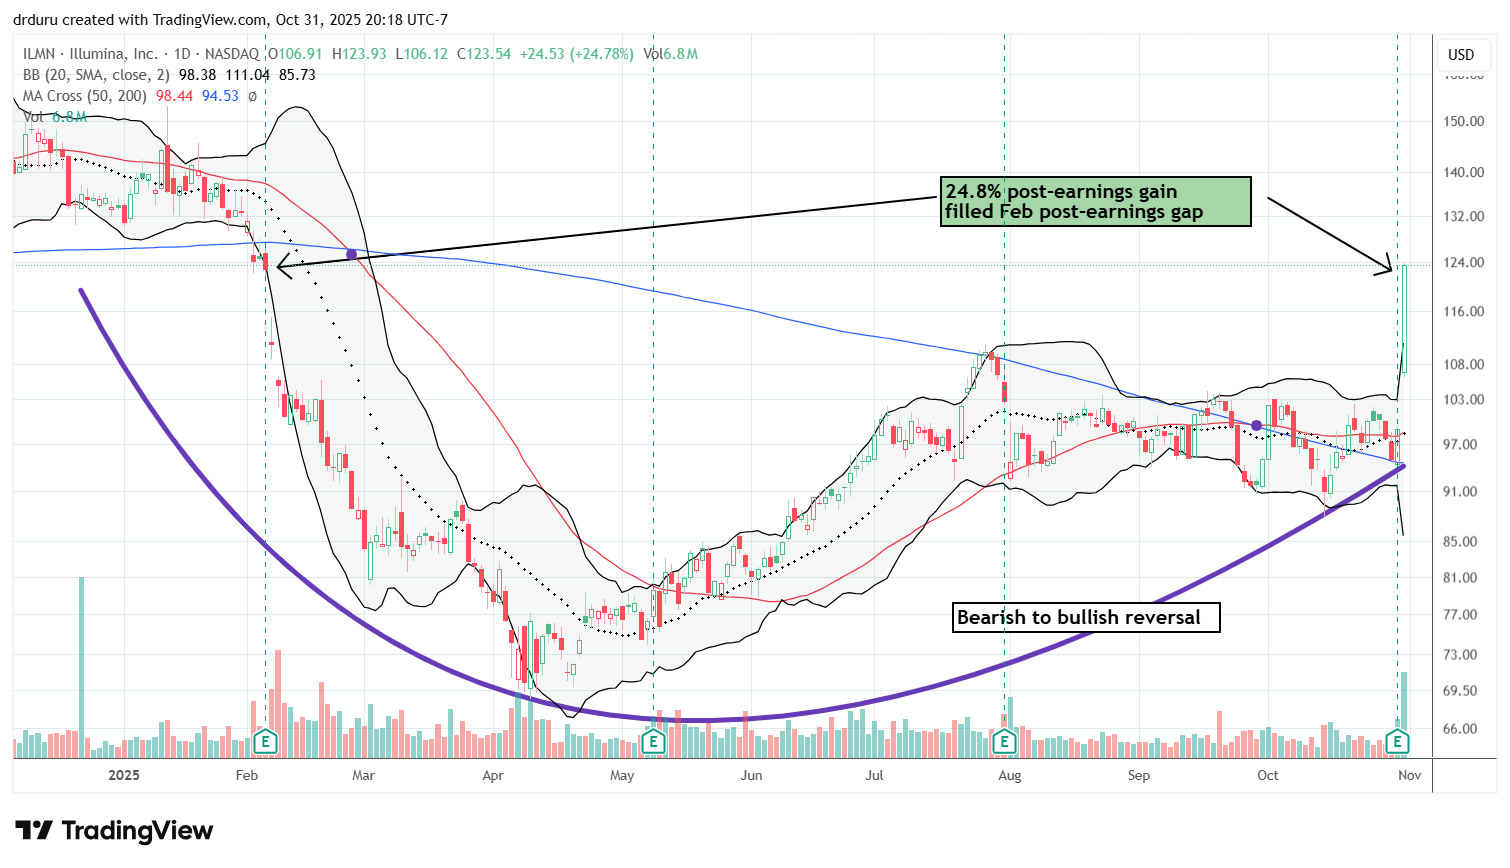
Illumina (ILMN)
Description: Illumina develops and manufactures tools for genetic analysis and sequencing.
Technical status: ILMN rallied 24.8% post-earnings, filling a prior post-earnings gap and forming a bearish to bullish reversal pattern.
Trade commentary: I am looking to reaccumulate a position in ILMN on a pullback now that the stock’s downtrend may be ending with a bearish to bullish reversal (see the purple curve below).
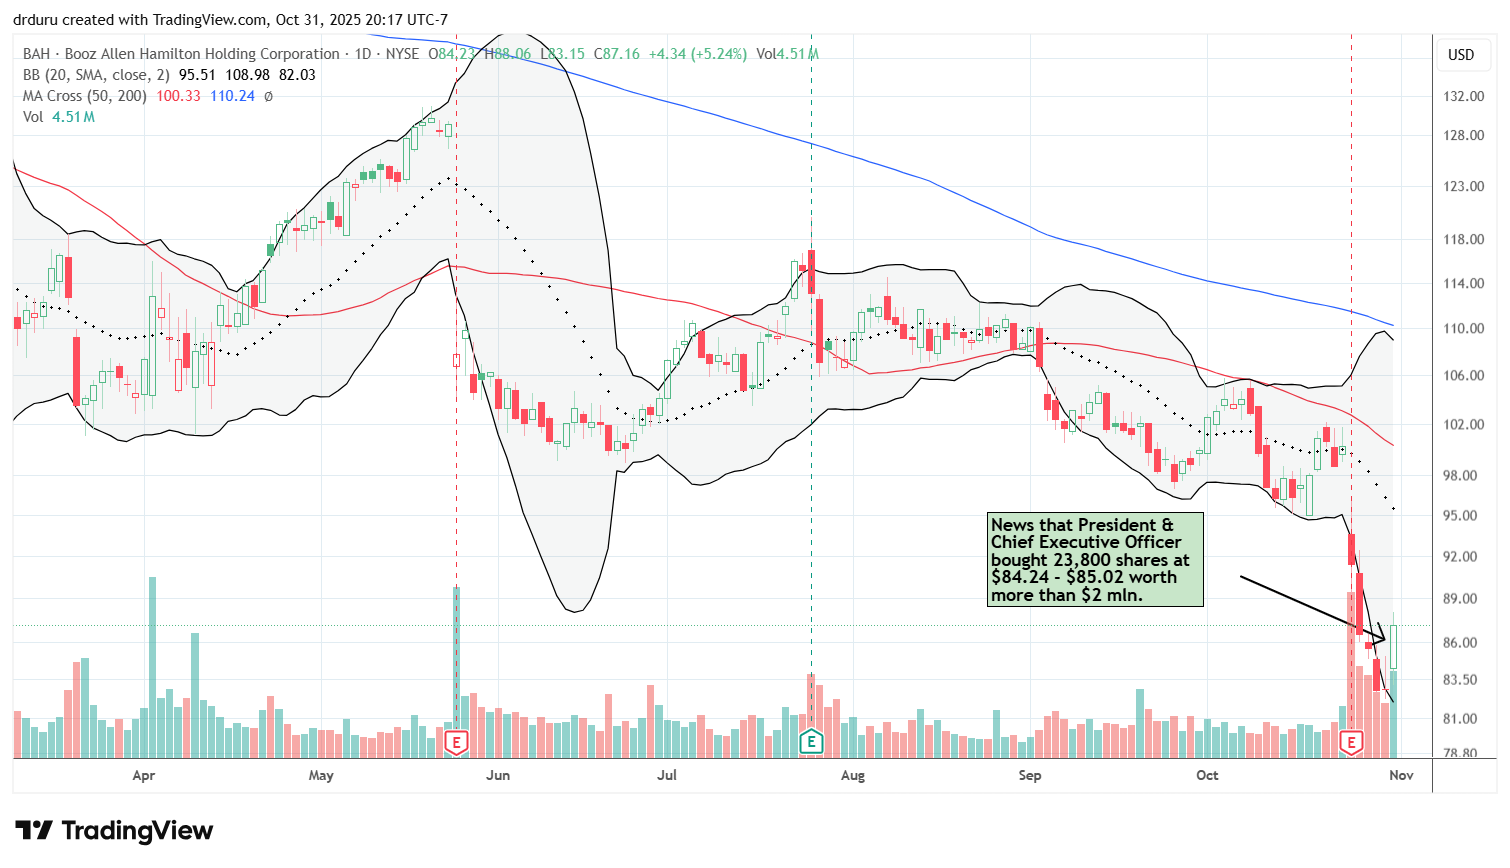
Booz Allen Hamilton (BAH)
Description: Booz Allen Hamilton provides management and technology consulting services primarily to government clients.
Technical status: BAH has been halved from last year’s highs amid government spending cuts.
Trade commentary: In May, I made the case to stay away from BAH given its exposure to government contracts. Now, with the stock much lower, I bought shares after the CEO purchased $2 million worth. I am hoping this insider confidence signals a bottoming process is on the way.
")
")
Be careful out there!
Footnotes
Subscribe for free to get email notifications of future posts!
“Above the 50” (AT50) uses the percentage of stocks trading above their respective 50-day moving averages (DMAs) to measure breadth in the stock market. Breadth defines the distribution of participation in a rally or sell-off. As a result, AT50 identifies extremes in market sentiment that are likely to reverse. Above the 50 is my alternative name for “MMFI” which is a symbol TradingView.com and other chart vendors use for this breadth indicator. Learn more about AT50 on my Market Breadth Resource Page. AT200, or MMTH, measures the percentage of stocks trading above their respective 200DMAs.
Active AT50 (MMFI) periods: Day #97 over 20%, Day #95 over 30%, Day #15 over 40% (overperiod), Day #4 under 50% (underperiod), Day #28 under 60%, Day #70 under 70%
Source for charts unless otherwise noted: TradingView.com
Full disclosure: long IWM shares and calls, long SPY put spreads, long CMG, long UPS shares and short call, long MSFT, long AAPL call spread, long AMZN call spread, long SPXC
FOLLOW Dr. Duru’s commentary on financial markets via StockTwits, BlueSky, and even Instagram!
*Charting notes: Stock prices are not adjusted for dividends. Candlestick charts use hollow bodies: open candles indicate a close higher than the open, filled candles indicate an open higher than the close.
* Blog notes: this blog was written based on the heavily edited transcript of the following video that includes a live review of the stock charts featured in this post. I used ChatGPT to process the transcript.
Update: I bought shares in LRN after this morning’s news: “Stride authorizes $500 million stock repurchase program until October 31, 2026”