
Stock Market Commentary
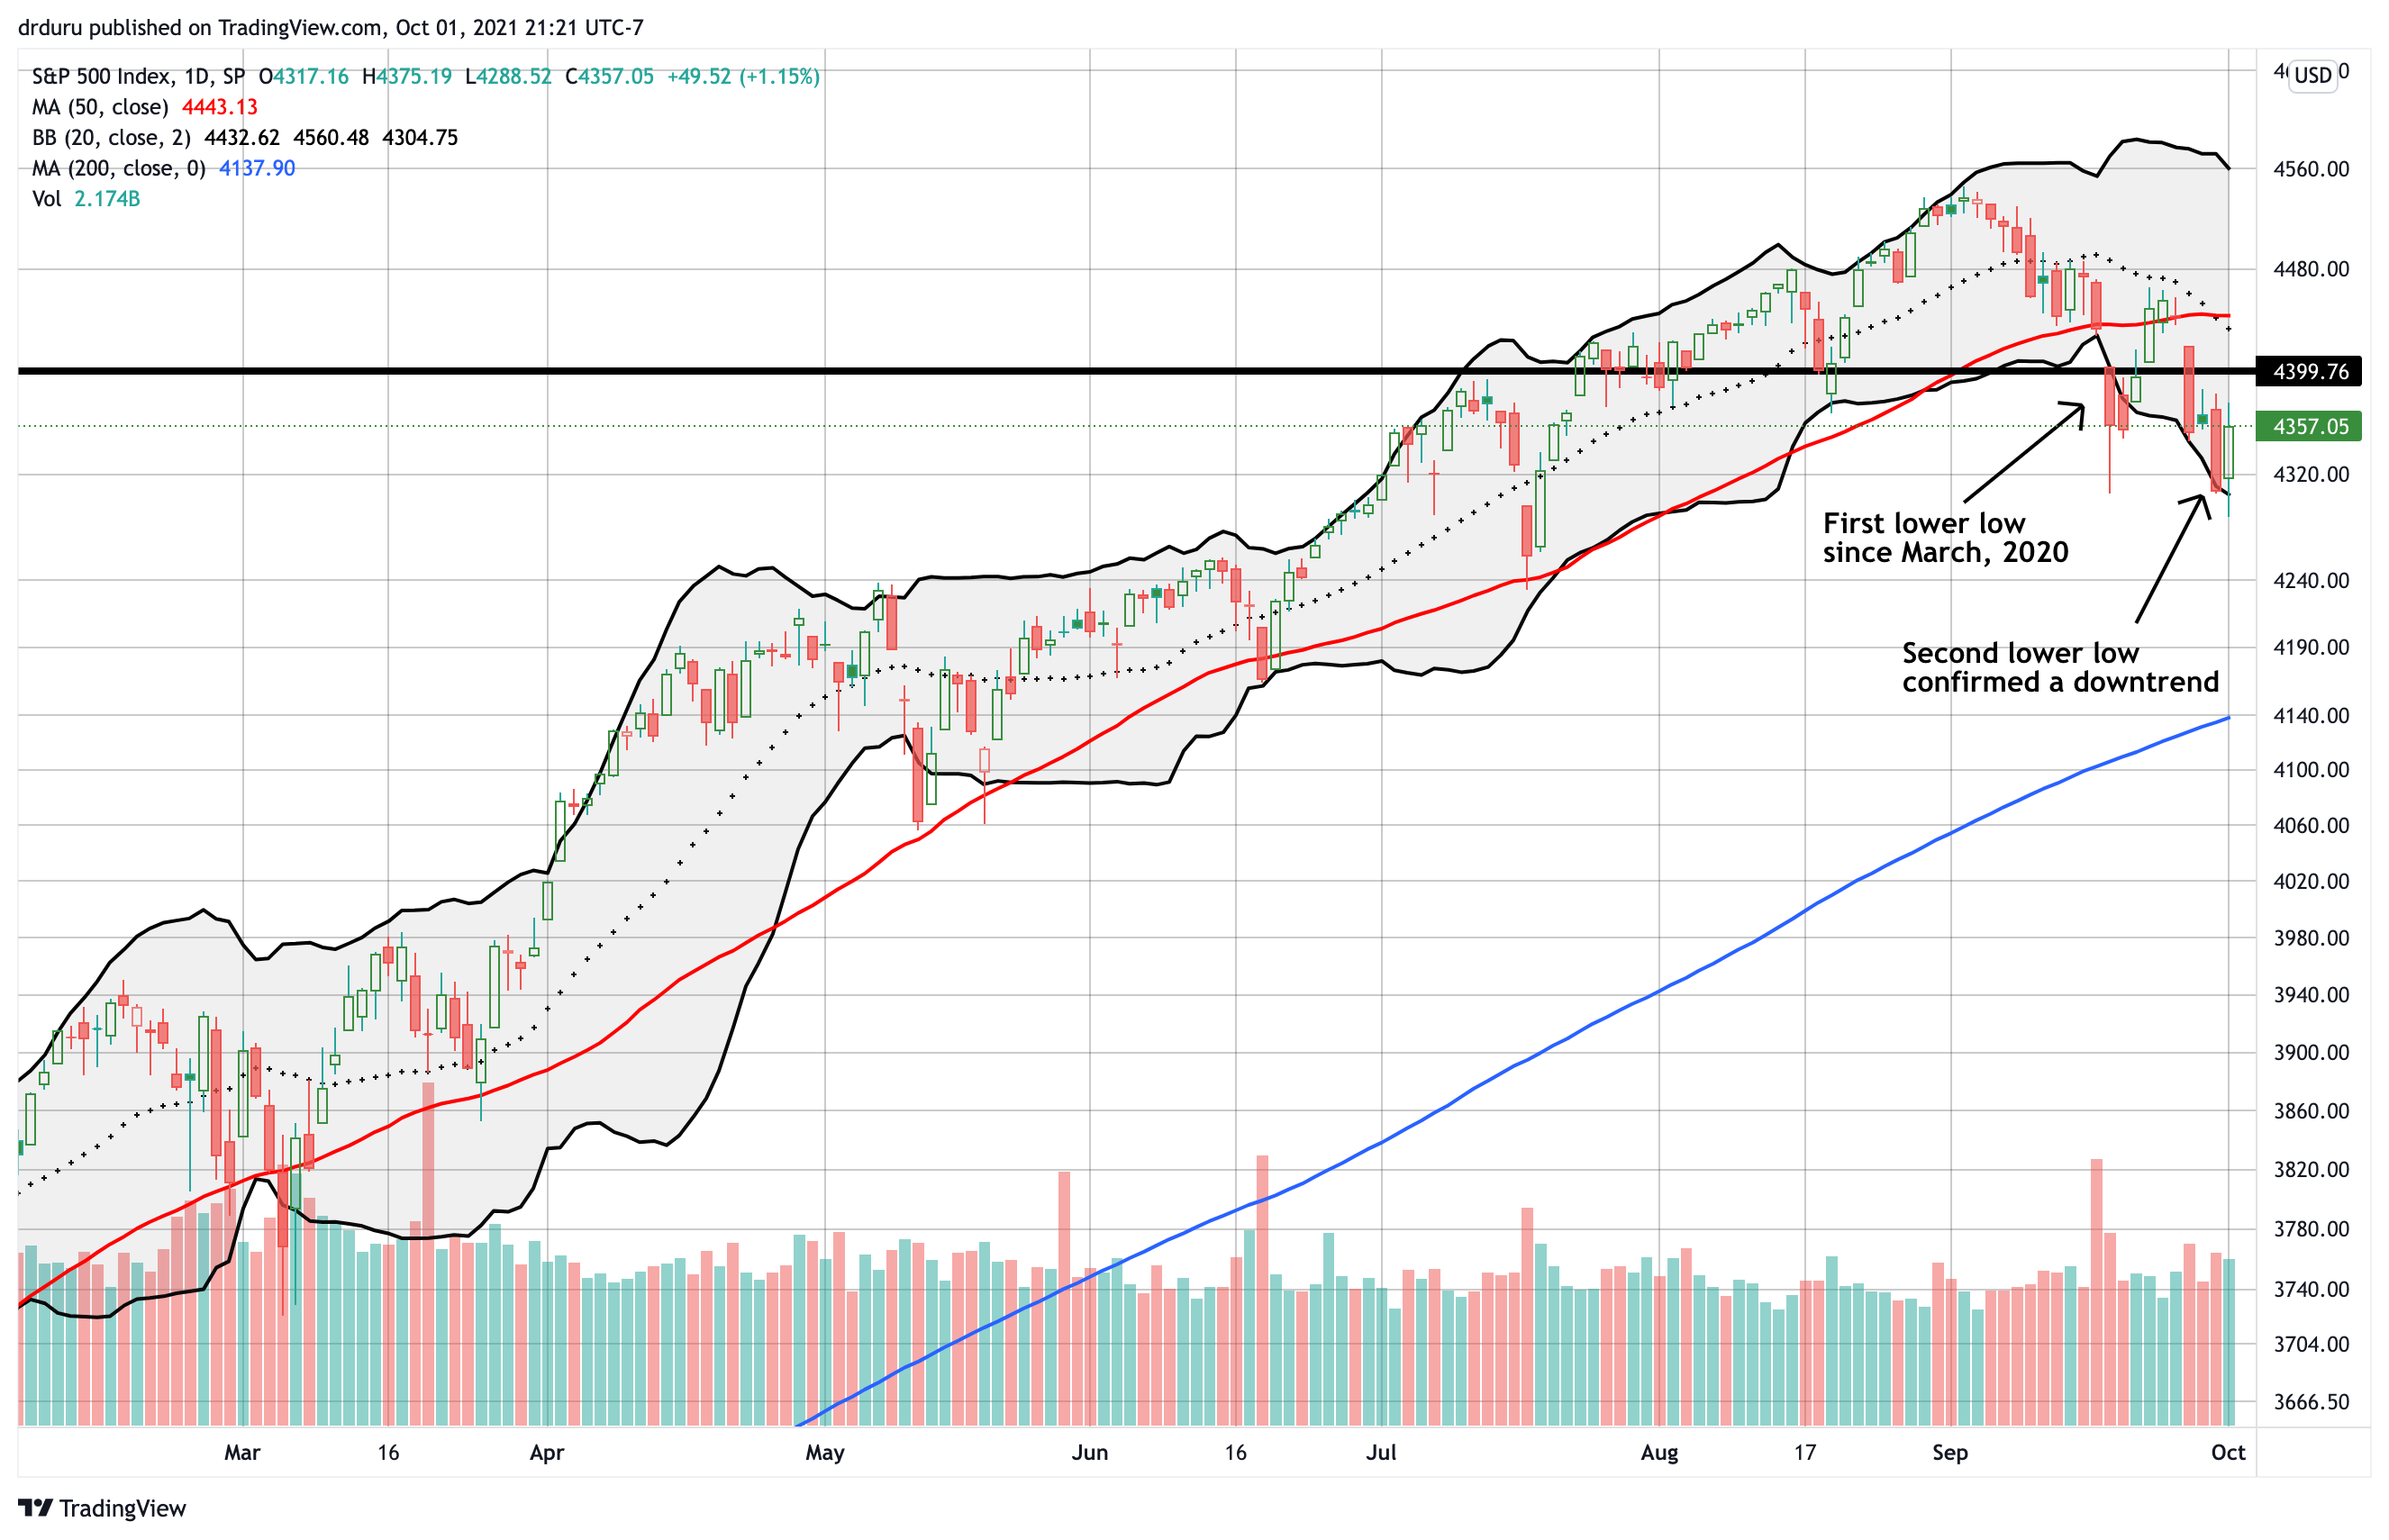
The strong start to September which characterized the persistent complacency in the stock market soon gave way to the kind of selling that characterizes one of the most dangerous months of the year. September came to a bearish end with a 4.8% loss on the month for the S&P 500. The index performed worse than last September’s 3.9% drop. The index also logged its first lower lows since the March, 2020 collapse in the stock market; March, 2020 was also the last month that performed worse than September, 2021. The trading action represents an ominous setup for the last of the three most dangerous months of the year.
The Stock Market Indices
The selling that plagued the previous week had a happy ending almost like nothing happened. The S&P 500 went from a breakdown below its 50-day moving average (DMA) (the red line below) to a new 50DMA breakout. The index looked ready to follow through on one of the most predictable patterns in the stock market: the uptrend defined by few closes below the 50DMA. Last week, that pattern came to a bearish end as sentiment shifted in favor of the sellers with a second lower low and a confirmed 50DMA breakdown. To start October the index kept hope alive with another predictable pattern: the presumed flows of passive money at the beginning of a month and a new quarter. The S&P 500 gained 1.2% on the day.
The NASDAQ (COMPQX) avoided a lower low in the previous week. Last week’s change in sentiment proved too much even for the mighty tech-laden index. Big cap tech stocks once again turned into a source of funds until Friday’s 0.8% gain.
Suddenly, the iShares Trust Russell 2000 Index ETF (IWM) is the relative out-performer. While the 2021 trading range has defined the life of the index of small caps, the 200-day moving average (DMA) is now the more interesting story. In August, IWM cracked 200DMA support for the first time since the stock market collapse. September delivered two more 200DMA breakdowns. Each breakdown motivated buyers to come rushing back. However, the rallies off of support are looking more tepid. Fortunately for IWM, the bottom of the trading still awaits if the 200DMA gives way completely. IWM still has a way to go to bring a bearish end to its predictable pattern defined by the trading range.
Stock Market Volatility
Taking a step back, I see the technicals on the volatility index (VIX) creating a major bottoming pattern. A rounded bottom starting in March transitioned the VIX from mainly lower highs to higher highs. While the predictable fades continue to bring the VIX down after 1-2 days, the VIX looks like it is becoming a coiled spring. I am looking for a surge that finally gives a serious challenge to the VIX’s highs of the year.

The Short-Term Trading Call After A Bearish End to September
- AT50 (MMFI) = 42.1% of stocks are trading above their respective 50-day moving averages
- AT200 (MMTH) 48.1% of stocks are trading above their respective 200-day moving averages
- Short-term Trading Call: cautiously bearish
AT50 (MMFI), the percentage of stocks trading above their respective 50DMAs, hit a closing low of 39.0% last week. While the downtrend remains in place, AT50 may be at the start of a trading range. AT200 (MMTH), the percentage of stocks trading above their respective 200DMAs, clearly remains within a downtrend. Accordingly, AT200 is the most immediate reminder of the underlying deterioration of the stock market’s health.
In true October-style, I am looking for oversold conditions at some point within the next 3 weeks or so. Perhaps earnings season will provide the catalyst. For example, last week the market finally cared about the well-known soaring costs and broken supply chains plaguing retailers. The coming earnings season should be full of inflation-related narratives. Maybe the market will care about the fiscal and political issues of the Federal government that continue to threaten the viability of an infrastructure bill. Perhaps the market will choose to care about the scale and timing of the coming tapering from the Federal Reserve. This stock market is still in a bull market, so it is not easy to know what the market will choose to use as an excuse to bring a bearish end to complacency.
The Promise of An Anti-Viral Drug Treatment for COVID-19
One market wildcard comes from a successful drug trial from Merck & Company (MRK) on a COVID-19 treatment. Friday’s news sent reopening plays soaring and brought positive sentiment for October. I even bought a January call spread on MRK. However, upon closer review of the news, I realized that broadly bullish reaction may get ahead of itself. First, the Merck & Company trial news:
“At the interim analysis, molnupiravir reduced the risk of hospitalization or death by approximately 50%; 7.3% of patients who received molnupiravir were either hospitalized or died through Day 29 following randomization (28/385), compared with 14.1% of placebo-treated patients (53/377); p=0.0012. Through Day 29, no deaths were reported in patients who received molnupiravir, as compared to 8 deaths in patients who received placebo. At the recommendation of an independent Data Monitoring Committee and in consultation with the U.S. Food and Drug Administration (FDA), recruitment into the study is being stopped early due to these positive results. Merck plans to submit an application for Emergency Use Authorization (EUA) to the U.S. FDA as soon as possible based on these findings and plans to submit marketing applications to other regulatory bodies worldwide.”
Molnupiravir is a therapy not a prophylactic against COVID-19. Accordingly, the promise of this drug is a cheaper and more effective solution to existing therapies. The 50% reduction in hospitalization rates takes the rate from a low percentage to an even lower percentage. Whatever delta variant fears were weighing on consumer sentiment and the economy should not materially change just because of a better COVID-19 therapy. (Interestingly, it seems the study did not differentiate patients based on vaccination status. I saw multiple reports in the media that the study excluded vaccinated patients. I saw no mention of such a rule in the definition of the study).
In other words, the Merck news is welcome, but it does not fundamentally alter the calculus on consumer sentiment. Moreover, per a CNBC interview I watched featuring Wendy Holman CEO and co-founder of Ridgeback Bio, Merck is planning to have 10 million treatments ready by the end of the year. If consumers will change behavior thanks to Molnupiravir, they will do so after the treatment is widely available. Of course, the stock market is free to look far into the future and guess about better times ahead. Still, the technical setup is dramatically different from the Spring of 2020 when hope was the only catalyst available to lift the stock market out of a historic collapse. Now, the stock market is riding lofty gains built from 18 months of growing and nearly unabated optimism.
Stock Chart Video Review
Stock Chart Reviews – Below the 50DMA
Apple Inc (AAPL)
At its lows, Apple Inc (AAPL) looked ready to complete its destiny with 200DMA support well ahead of schedule. Buyers finally got interested 3 points above the 200DMA. The reversal was strong enough to deliver a 0.8% gain on the day. Despite the extreme downward move, I did not implement the weekly call buying strategy. As a reminder, I turned the strategy off after AAPL dove below its 50DMA.
Facebook (FB)
In retrospect, my dips into call options on Facebook (FB) made little sense. Not only is FB below its 50DMA, but also, and more importantly, the negative news headlines surrounding the company are as serious as ever. With big cap tech becoming a source of funds for investors, FB has a lot of headwinds working against it. At best, I should have made the FB calls part of a pairs trade strategy with puts on another big cap tech company or the QQQ.
Goldman Sachs Group, Inc. (GS)
Goldman Sachs (GS) is weighing on financials. Resistance at the 20-day moving average (DMA) (the dotted line below) stopped the last rebound cold. Last week GS confirmed another 50DMA breakdown and is trying to hold support at its September low. Like other latecomers to selling pressure, GS looks positioned for an eventual test of 200DMA support.
Best Buy (BBY)
Electronics retailer Best Buy (BBY) had a wild ride last week. A Piper Sandler upgrade with an extremely bullish $150 price target sent BBY soaring 5.2% on the day. That upgrade seemed so extreme that I bought put options on BBY. Sure enough, BBY faded and I took quick profits. The complete reversal of the pop fires off further red flags reminiscent of the lessons learned from the post-upgrade fade on Spotify Technology (SPOT).
Zoom Video Communications, Inc (ZM)
Zoom Video Communications, Inc (ZM) failed to hold its bottoming hammer. I also failed to take quick profits on my shares. I held and held through some churn and then flipped back to a paired position with an out-of-the-money put option. The cancellation of Zoom’s deal to buy Five9 (FIVN) helped send the stock up 2.3% on Friday. This pop puts a more critical line in the sand for the stock. Failure to hold the latest bottom will expose ZM to the risk of a much steeper sell-off. Zoom’s near-term future and competitiveness is also an issue without this deal holding out the promise of new growth areas.
QUALCOMM Incorporated (QCOM)
September was rough for QUALCOMM Incorporated (QCOM). The stock broke 50 and 200DMA support on its way to a 12.1% loss for the month. At its lows of the day, QCOM tested its May lows. QCOM looks poised to print new lows on the year based on the bearish end to its summer churn and current selling momentum.
Dominos Pizza (DPZ)
Even mighty Dominos Pizza (DPZ) had a rough September. DPZ lost 7.8% for the month. DPZ is still up 23.9% year-to-date, so investors who still hold profits for the year have plenty of money they can take off the table. Accordingly, DPZ looks poised for a test of 200DMA support. DPZ essentially reversed the 14.6% gain from what was supposed to be a very bullish earnings report.
Amazon.com (AMZN)
My trade on Amazon.com (AMZN), after its early September 50DMA breakout, completely failed. Like so many other stocks, AMZN spent the rest of September cracking key support levels. I am guessing AMZN will hold August support and just stay stuck in the trading range that began almost 15 months ago.
Nike, Inc. (NKE)
Nike, Inc. (NKE) looks like the tale of two earnings. A 15.5% post-earnings pop in June reassured the market that all was still well in retail, especially with the China-related supply chain. NKE broke out to all-time highs and rallied for another month. Sentiment turned from there and translated into selling going into September earnings. The 6.3% post-earnings loss sent NKE into a critical test of 200DMA support. A breakdown from here puts a complete reversal of June’s gap up on the table.
Biogen Inc (BIIB)
Speaking of reversals, Biogen Inc (BIIB) pulled off a massive reversal in September and looks ready to finish the job this month. In June, the market celebrated news of accelerated approval from the FDA for ADUHELM (aducanumab-avwa) with a 38.4% gain. BIIB gained as much as 71.9% before fading. That large fade was the first warning sign that buyers exhausted themselves. The second warning was a 50DMA breakdown the next month that BIIB failed to overcome. The 200DMA breakdown is the third and final warning. In the meantime, I am left scratching my head wondering why the market is suddenly treating June’s news like no big deal.
Splunk, Inc (SPLK)
Splunk, Inc. (SPLK) pulled off a (near) bullish reversal. SPLK entered bearish territory with a confirmed 200DMA breakdown that included a 6.3% loss. On Thursday, the stock moved contrary to a bearish market with a 5.2% jump which helped reclaim 200DMA support. Overhead resistance at the 50DMA and declining 20DMA still loom ominously.
Carmax (KMX)
Carmax (KMX) transitioned from all-time highs to a 12.6% post-earnings loss. On Friday, buyers defended 200DMA support. KMX is now in limbo. A close below Friday’s intraday low is bearish. A 50DMA breakout sets up the prospect for a fill of the post-earnings gap down.
3M Company (MMM)
The reversal in 3M Company (MMM) is symbolic of many of the recent troubles with cyclical, industrial names. MMM spent much of the summer topping out. March’s breakout is a distant memory. Thursday’s 3.0% loss further plunged MMM into bearish territory. MMM is now almost flat year-to-date.
Stock Chart Reviews – Above the 50DMA
Autonation, Inc. (AN)
Autonation, Inc. (AN) lost an all-time high in sympathy with KMX. Unlike KMX, AN remains in a bullish position with a successful test of 50DMA support. Accordingly, AN is a buy on a higher close.
Lucid Group, Inc (LCID)
Lucid Group, Inc is in production! The electronic vehicle (EV) maker is doing what so many other EV companies aspire to do: put cars into production to satisfy orders. While I am not buying these first cars, I still harbor dreams of owning one of these beauties when I “grow up.” In the meantime, I “only” own LCID stock. After an ugly 10.9% loss to start September, LCID moved contrary to the general market. LCID even gained 27.2% for the month. Given my bullishness on Lucid Group, I promptly bought the gap down as a bargain shopping opportunity.
ChemoCentryx, Inc. (CCXI)
I am still learning about ChemoCentryx (CCXI). The clinical-stage biopharmaceutical company suffered a steep setback in May. Sellers made little progress from there. The chart below clearly shows a pattern of accumulation at these “de-risked” prices. Buyers have followed the 20DMA higher. With my bearish flip on the stock market, I am not yet ready to buy into this impressive recovery. I am keeping CCXI on the shopping list for whenever and however October’s seasonal dangers resolve themselves.
Winnebago Industries, Inc. (WGO)
A bullish earnings report from competitor Thor Industries (THO) helped spring RV manufacturer Winnebago Industries, Inc. (WGO) to life. Friday’s 7.7% gain is a convincing confirmation of bullishness in WGO. The stock looks poised to run up into earnings sometime later this month.
Warner Music Group Corp. (WMG)
I have successfully traded in and out of Warner Music Group Corp. (WMG), but I sat out the current picture perfect bounce off uptrending 20DMA support. On September 22nd, WMG announced a stock offering priced at $44. The stock hung around the $44 level for about 2 days before dipping. After WMG dipped, the rule on trading secondary offerings tells me to leave the stock alone. The rebound on Thursday is particularly impressive given the selling in the stock market that day.
Electronic Arts Inc. (EA)
Electronic Arts (EA) is up 13.3% in 8 days. The stock rebounded quickly from a bearish breakdown below its prior 2021 lows. The selling started after a -5.3% reaction to a September 15th business update from Electronic Arts. EA gapped down to its 50DMA and closed below its 200DMA. I could not find news to explain why the market suddenly and sharply changed its mind on the stock. EA closed the week with a near complete reversal of the loss from the business update. Overall, EA is one messy chart loosely defined by overlapping trading ranges.
Be careful out there!
Footnotes
“Above the 50” (AT50) uses the percentage of stocks trading above their respective 50-day moving averages (DMAs) to measure breadth in the stock market. Breadth defines the distribution of participation in a rally or sell-off. As a result, AT50 identifies extremes in market sentiment that are likely to reverse. Above the 50 is my alternative name for “MMFI” which is a symbol TradingView.com and other chart vendors use for this breadth indicator. Learn more about AT50 on my Market Breadth Resource Page. AT200, or MMTH, measures the percentage of stocks trading above their respective 200DMAs.
Active AT50 (MMFI) periods: Day #366 over 21%, Day #8 over 31%, Day #2 over 41% (overperiod), Day #18 under 51%, Day #72 under 62%, Day #136 under 72% (as of September 24th, update TBD)
Source for charts unless otherwise noted: TradingView.com
Grammar checked by Grammar Coach from Thesaurus.com
Full disclosure: long UVXY call and call spread, long ZM shares and put, long LCID, long FB call, long SPY calendar call spread
FOLLOW Dr. Duru’s commentary on financial markets via StockTwits, Twitter, and even Instagram!
*Charting notes: Stock prices are not adjusted for dividends. Candlestick charts use hollow bodies: open candles indicate a close higher than the open, filled candles indicate an open higher than the close.