
Housing Market Intro and Summary
The housing market’s comfortable calm continued into September even as the stock prices of home builders raced downward. A general sell-off in the stock market ensnared housing-related stocks. Yet, the housing data reported in September showed little change from the prior month. While home builder stocks ignore the calm in the data, I look forward to buying into this dip in the coming month or so. The seasonally strong period for home builders begins by November.
Housing Stocks
The iShares Dow Jones US Home Construction Index Fund (ITB) is testing its lows from July despite the calm in the data. This test follows a large 2.9% 1-day loss at the end of September which completed ITB’s third reversal of the breakout rally from March to May. Moreover, that drop broke support at the 200-day moving average (DMA) (the blue line below) for the first time since June, 2020. ITB is also below its price from the Zelman downgrade in June that caused a brief bout of selling in housing-related stocks. If support gives way, ITB will next find support at the March lows. Such a pullback would provide an attractive opportunity to kick off the buying season for home builder stocks.
Housing Data
New Residential Construction (Single-Family Housing Starts) – August, 2021
Single-family home starts decreased to 1,076,000 which was 2.8% below July’s 1,107,000 starts (revised downward from 1,110,000). Starts were 5.2% above last year’s levels and essentially in-line with July’s year-over-year growth rate. The days of blistering growth like June’s 28.5% gain have given way to a calm in the data with comps getting more and ore difficult from here. The rate of year-over-year change has stayed positive for 14 straight months.
The downtrend remains from the 14-year high set in December, 2020. The longer-term trend from the 2011 trough remains upward. On balance, starts have settled down despite the apparent pressures of strong demand. The constrained supply chain exerts downward pressure.

August was a month of regional divergences as two of four regions experienced year-over-year declines in starts. Housing starts in the Northeast, Midwest, South, and West each changed +8.5%, -20.3%, +23.9%, -20.5% respectively year-over-year.
Existing Home Sales – August, 2021
July existing home sales finally registered two straight months of gains and the streak ended right there. The seasonally adjusted annualized sales in August of 5.88M decreased 2.0% month-over-month from the marginally upwardly revised 6.00M in existing sales for July. Year-over-year sales decreased 1.5%. Existing home sales continue to look like they are settling into a calm in the data.

(As of the March, 2018 data, the NAR further reduced historical data to just 13 months. For historical data from 1999 to 2014, click here. For historical data from 2014 to 2018, click here) Source for chart: National Association of Realtors, Existing Home Sales© [EXHOSLUSM495S], retrieved from FRED, Federal Reserve Bank of St. Louis, October 4, 2021.

August’s absolute inventory level of 1.29M homes decreased 1.5% from July. The return to month-over-month declines prompted the National Association of Realtors (NAR) to provide a familiar connection between sales and inventory: “Sales slipped a bit in August as prices rose nationwide…Although there was a decline in home purchases, potential buyers are out and about searching, but much more measured about their financial limits, and simply waiting for more inventory.”
Inventory dropped 13.4% year-over-year (compare to July’s 12.0%, June’s 18.8%, May’s 20.6%, April’s 20.5%, March’s 28.2%, February’s 29.5%, January’s 25.7%, December’s 23%, November’s 22%, October’s 19.8% year-over-year declines, unrevised). “Unsold inventory sits at a 2.6-month supply at the current sales pace, unchanged from July but down from 3.0 months in August 2020.” The on-going year-over-year decline in inventory is on a 27-month streak.
The average 17 days it took to sell a home tied the all-time record lows set in April, May, June, and July.
The median price of an existing home fell for a second straight month and pushed further back from June’s (revised) all-time high of $362,800. Prices have increased year-over-year for 114 straight months, and August’s price jump was a 14.9% year-over-year gain. The median price decreased from July by 0.8%.
First-time home buyers dropped to a 29% share of sales in August, down from 30% in July. The NAR’s 2017 Profile of Home Buyers and Sellers reported an average of 34% for 2017, 33% for 2018, 33% for 2019, and 31% for 2020. Investors stepped into the decline in first-timer share with a 15% share of sales, even with the (revised) 15% in July and up from 14% a year ago.
All regions declined in month-over-month and year-over-year sales. The regional year-over-year changes were: Northeast -2.7%, Midwest -2.1%, South -0.8%, West -1.6%.
All regions registered robust year-over-year price gains: Northeast +16.8%, Midwest +10.5%, South +12.8%, West +11.4%.
Single-family home sales decreased 1.9% from July and declined on a yearly basis by 2.8%. The median price of $367,000 was up 18.6% year-over-year.
California Existing Home Sales – August, 2021
California’s 2-track statewide housing market makes the aggregate numbers tricky to interpret. The California Association of Realtors (C.A.R.) reports that “home sales at the lower end of the market are underperforming due to a lack of supply and the economic uncertainty induced by the COVID resurgence.” At the same time, buyers at the higher end of the market seem to enjoy plenty of options with consistent double-digit growth in sales. Accordingly, this divergence pushes median house prices upward while at the same time creating a more dire picture of aggregate inventory and sales trends. The data demonstrated these effects yet again in August.
Existing homes sales continued to decline in California. Californian existing home sales dropped sequentially for the fourth month in a row. As a result, sales have now declined 7 out of the last 8 months and are at 14-month lows. For August, C.A.R. reported 414,860 in existing single-family home sales. Sales decreased 3.3% from July and decreased 10.9% year-over-year. At $827,940 the median price increased 2.1% month-over-month while gaining 17.1% year-over-year. At $395, the price per square foot set a new all-time high for California by $1. Accordingly, over 67% of homes sold above asking price.
Inventory remained at 1.9 months of sales in August. Inventory decreased year-over-year from 2.1. Active listings managed to drop month-over-month and year-over-year. C.A.R. reported that the yearly decline was the lowest in two years.
It is easy to interpret the protracted decline in sales as supporting the persistent theme of an exodus from California. However, chronically tight inventories and soaring prices tell a different story. Many households are staying put and are as yet not enticed by the steadily climbing prices to cash in.
New Residential Sales (Single-Family) – August, 2021
The prior boom times are a fading memory for new home sales as a calm in the data settles down. New home sales of 740,000 in August were up 1.5% from July but down 24.3% year-over-year.

The median home price stayed at an all-time high at $390,500. Year-over-year the median price was up 20.1%.
The monthly inventory of new homes for sale declined slightly from 6.2 to 6.1 months of sales. The absolute inventory level of 378,000 ended four straight months of declines.
Sales in all regions declined significantly year-over-year. The Northeast plunged sharply for the third month in a row with a 37.0% drop. The Midwest plunged 46.9%. The South dropped 23.0%. The West declined 16.3%.
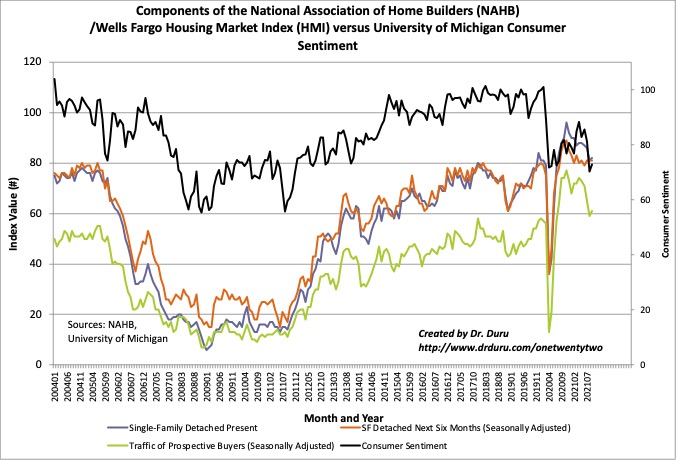
Home Builder Confidence: The Housing Market Index – September, 2021
After a 5-point drop in July, the NAHB/Wells Fargo Housing Market Index (HMI) from the National Association of Home Builders (NAHB) looked like trouble. However, I claimed that the decline simply represented some long overdue normalization. This month, the NAHB agreed with me: “The single-family building market has moved off the unsustainably hot pace of construction of last fall and has reached a still hot but more stable level of activity, as reflected in the September HMI.” Two of three of the HMI components gained a single point while the SF Detached Next Six Months (Seasonally Adjusted) remained flat for the third month in a row. This component has remained at 81 four of the last five months.
Source for data: NAHB
Two of four regions gained for the second month in a row. Despite the flattish nature of the overall HMI, the regions made wide swings. After hitting a 3-month high in August, the Northeast fell to its lowest level of the entire pandemic recovery. The Midwest and the South gained 5 and 3 points respectively. Like the Northeast, the West plunged to its lowest level since the trough of the pandemic. The NAHB offered no explanations for these wide disparities. I will be looking for significant revisions in the October numbers.
Home closing thoughts
The Resistance to Affordable Housing
The state of Texas is known for its anti-regulation style of living and openness to wide expanses of housing development. Yet, when it comes to building affordable housing, Austin, Texas provides today’s example of the unity existing neighborhoods can bring to bear in opposition to affordable housing.
The key opposing points from this case in Austin over a single lot ring familiar in so many other battles over affordable housing across the country. Trey Jackson is the lawyer for the neighbors: “This part of Austin floods during heavy rains…adding a house could make it worse…the lot is too small; that second reason has to do with what are called deed restrictions, or restrictive covenants.”
Amazingly, the city of Austin has owned the lot for over 50 years and has been trying to build an affordable home on the land since early 2020.
For more on the various ways neighborhoods fight against change and support exclusion for their neighborhoods see EconTalk’s “Katherine Levine Einstein on Neighborhood Defenders.”
Be careful out there!
Full disclosure: no positions