
Stock Market Commentary
Sellers beat a hasty retreat from the stock market as another bearish signal enjoyed a fleeting existence. The last bearish period lasted about three days. The previous bearish period barely survived a day. The stock market’s ability to quickly wipe away bearish signals is impressive. The buying force over the last week made the stock market almost overbought. As if to emphasize the fresh bullish wave, the percentage of stocks trading above their respective 200-day moving averages (DMAs) hit a level last seen over 11 years ago.
The Stock Market Indices
The S&P 500 (SPY) pushed slightly through 50DMA support (uptrending red line below) at the end of the previous week. The move was part of follow-through to the resolution of a bearish divergence. A gap up and 1.7% gain to start last week’s trading began the end of the bearish signals. The S&P 500 gained every day of the week to end at an all-time high and squashed my put spread that expired last Friday.
The NASDAQ (COMPQX) never even got close to its 50DMA support before rebounding. The tech-laden index’s move preserved the uptrending 20DMA (the brownish/purplish line) as support. The NASDAQ ended the week at an all-time high.
The iShares Trust Russell 2000 Index ETF (IWM) followed the path of the NASDAQ. However, the index of small cap stocks also managed to stretch above its upper Bollinger Band. IWM sailed on robust buying force.
The Select Sector SPDR Trust Financial (XLF) tried to follow the lead of the other indices but came up a bit short. XLF closed the week with a flat performance on Friday. Still, the ETF looks impressive after overcoming two breaches of 50DMA support in three trading days at the end of January.
Stock Market Volatility
The volatility index (VIX) gained 61.6% on January 27th. When I called the extreme move unsustainable, I did not anticipate such a swift and complete reversal! Since then, the VIX managed just one up day on its way to nearly hitting a post-pandemic low. Toward the end of Thursday’s trade, I climbed back into ProShares Ultra VIX Short-Term Futures ETF (UVXY) March 5 call options. Either the VIX holds support above 20 yet again or the previous week’s volatility surge represents a last gasp of fear for the stock market.
The Short-Term Trading Call: Assessing the Follow-Through
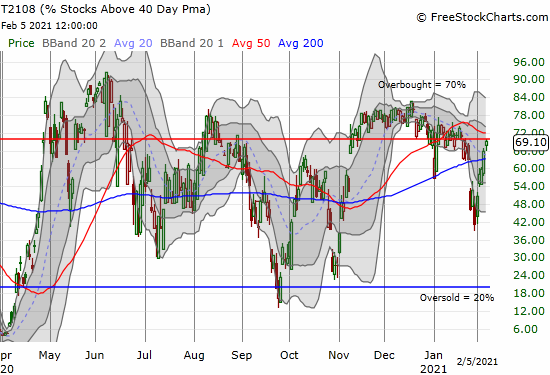
- AT40 = 69.1% of stocks are trading above their respective 40-day moving averages
- AT200 = 90.0% of stocks are trading above their respective 200-day moving averages (TradingView’s calculation) – 11 1/2 year high!
- Short-term Trading Call: neutral
AT40 (T2108), the percentage of stocks trading above their respective 40DMAs, surged along with the stock market last week. My favorite indicator ended the week almost overbought at 69.1% (the threshold is 70%). The steepness and persistence of the rise confirms the broad-based buying power in the market last week.
I flipped the short-term trading call right back to neutral in the face of the renewed buying. As a reminder, I set the 20DMA as the threshold for invalidating the bearish call. Moreover, at the end of January, I stated the following:
“…I am bracing for churn in the outlook for sentiment in the stock market. The upward momentum is likely over but the path downward likely already experienced its swiftest moment…at least until the VIX cools off and forms a fresh launching pad…”
The upward momentum is not over, but the churn in the short-term trading call is in full effect. While the trading call will not flip to some flavor of bullish if the market continues to rise, it will flip right back to (cautiously) bearish if the overbought threshold holds as resistance for AT40. The S&P 500 needs to breach its 20DMA support as confirmation of a fresh bearish signal from the overbought trading rules.
AT200, the percentage of stocks trading above their respective 200DMAs, is an even bigger story. This longer-term indicator of stock market breadth hit 90.0%! The last time AT200 hit this part of the stratosphere was April, 2009. Unlike 2009, AT200 took considerable time to reach this milestone after the last oversold period came to an end. AT200 even consolidated for 2 months before making this run. Note well that this kind of extreme does not define a top. Instead, it underlines the current strength of the buyers. When other bearish signals appear again, AT200 will transition to an indicator of how far the market could fall while remaining longer-term bullish.
Stock Chart Video Review
Stock Chart Reviews – Below the 50DMA
iShares 20+ Year Treasury Bond ETF (TLT)
Although the January jobs report failed to meet expectations for job-creation and December job losses were revised further downward, the report was strong enough to make the bond market more confident in the economic recovery. The iShares 20+ Year Treasury Bond ETF (TLT) lost 0.8% and closed at its lowest point since TLT finished its plunge last March. So far, the steady rise in long-term yields is not disturbing the stock market one bit. Both markets are looking ahead to better and better economic performance.
U.S. Steel (X)
Count U.S. Steel (X) as another industrial company lagging the stock market’s recent performance. While X gained 1.9% post-earnings, sellers pressured the stock thereafter. An upsized secondary stock offering sealed the deal with a 50DMA breakdown and 7.8% loss. Now, U.S. Steel clings to the bottom of a bearish head and shoulders technical pattern.
Harley-Davidson (HOG)
When motorcycle manufacturer Harley-Davidson (HOG) broke below its 20DMA, I described my conditions for taking profits on my long shares. HOG triggered a sale the next day. The stock went on to successfully test 50DMA support and eventually trade even higher. Last week, earnings took HOG down 17.1% and created a bearish 50DMA breakdown. HOG looks like it resumed its downtrend from the pullback off November highs. I am eyeing a re-entry if HOG tests its 200DMA.
Spotify Technology (SPOT)
Post-earnings trading took Spotify Technology (SPOT) down 8.1%. Sellers followed up with a confirmation of the 50DMA breakdown. A close below last month’s intraday low makes SPOT a short play (with a stop above the 50DMA).
Clorox (CLX)
The 200DMA breakout for Clorox (CLX) was a fake-out, a BIG fake-out. Buyers followed through on the breakout confirmation with a subsequent 4.3% gain. After that last burst of buying, the story fell apart. CLX dropped right back to its 200DMA the next day. The selling has yet to stop. A 6.3% post-earnings loss plunged CLX right back to my original bearish thesis. Note that the original downtrend is also back in play.
Stock Chart Reviews – Above the 50DMA
Alphabet (GOOG)
The poster child for last week’s bullish surge was Alphabet (GOOG). The stock gained 7.4% post-earnings and managed to gain another 1.7% on Friday. The stock closed above its upper-BB and hit an all-time high. It goes without saying that GOOG is a buy on the dips from here. GOOG confirmed last month’s breakout with this post-earnings launch higher.
Apple (AAPL)
The weekly call option trade in Apple (AAPL) has exprienced a rough year so far. I believe the trade has had just one week of success. The gains from that week fall far short of the total loss. Post-earnings selling pressure off the all-time high transitioned into under-performance last week. Notably, the fresh excitement over an Apple car is typically the kind of news that drops first thing Monday morning and propels the weekly call trade into the winner’s column. Regardless, I decided to give the trade at least one more try in anticipation of a catch-up move for AAPL.
Century Communities (CCS)
Several home builders have delivered lukewarm to poor earnings results and/or responses in recent weeks. So the 19.5% post-earnings pop in Century Communities (CCS) caught me completely off-guard. I have no trade here except to stick to the script of the seasonal trade on home builders.
Dick’s Sporting Goods (DKS)
I ended the trading rotation in Dick’s Sporting Goods (DKS) several months ago (mainly using covered call positions). I eyed a near breakout at the end of November as a fresh opportunity. DKS fell back before I made a move. The real breakout came a month ago with the stock off my radar. DKS now trades at an all-time high. As with any other similar stock chart, DKS is a buy on the dips from here (down to the last breakout point).
L Brands Inc (LB)
An all-time high is still a double away for L Brands Inc (LB). Still, the apparel retailer trades impressively. LB suffered a 50DMA breakdown late last month but bounced right back. Last week, LB gained 9.4% after releasing upside Q4 earnings guidance alongside an announcement of the CFO’s retirement. LB looks to maintain this upside momentum going into earnings on February 24th. From the press release:
“Due to strong January results, the company is raising its earnings guidance for the fourth quarter from $2.70 to $2.80 per share to $2.95 to $3.00 per share. The company expects to report a fourth quarter comparable sales increase of 10 percent, consisting of a 22 percent increase at Bath & Body Works and a 3 percent decrease at Victoria’s Secret.”
Match Group Inc (MTCH)
I thought an 8.0% post-earnings drop in Match Group (MTCH) would start a set-up for me to finally get a piece of the stock. Before I could blink, MTCH gapped up and closed the post-earnings gap the very next day. Two analysts came to the rescue with upgrades on MTCH and fresh price targets of $165 and $175. With a $159.82 close on Friday, the stock is clearly on a mission to get to those targets as soon as possible.
Walgreens Boots Alliance (WBA)
When Walgreens Boots Alliance (WBA) announced Rosalind Brewer as the company’s new CEO, I immediately dropped my bearish bias on WBA. The stock traded as high as $56 on the news before fading to a 4.0% close. WBA went on to reverse all the gains from the initial excitement. Still, I plan to start nibbling on shares this week. WBA pays a healthy 3.75% dividend.
Warner Music Group (WMG)
I have spent a LOT of time streaming music during the pandemic. While I enjoy the extremely low cost of listening to almost any kind of music at anytime and anywhere, I often wonder how music artists can survive these new economics. For example, my monthly subscription costs less than a single album. Before the pandemic, I understood that artists shifted their emphasis to earning money from live performances. But now what? As I see more and more music videos in recent months, I wonder even more how these productions get funded without live performances in parallel. Thus my interest in earnings from Warner Music Group (WMG).
WMG went public (a spin-off) last June and understandably went nowhere from there. November earnings kindled some kind of fire ahead of a month-long buying spree. WMG is stalled again and even a 7.0% post-earnings pop last week was not enough to break the grip of the current (wide) trading range. I am a buyer on a breakout. From the Seeking Alpha transcript of the earnings call:
“…we are very fortunate that our core streaming business remains as strong as ever and that music has a rapidly growing presence in new and diverse applications. In fact, Q1 was the highest revenue quarter in our 17-year history as a standalone company. Our revenue grew 4% year-over-year from our previous record high in Q1 of 2020, an achievement that we are especially proud of given that we accomplished this during the pandemic.
The strong double-digit revenue growth in digital more than offset the continued disruption in Recorded Music’s artist services and expanded rights revenue and Music Publishing’s performance revenue. Excluding revenue from those areas, our year-over-year revenue growth in Q1 would be approximately 8%…
…the pandemic has accelerated consumer adoption in areas like in-home digital fitness, video gaming, live streaming, and social media. These platforms rely heavily on music, and we are at the forefront of helping them invent and evolve new commercial opportunities.”
Something tells me that the music distributors maintain the lion’s share of the gains from the boom in music streaming.
I also learned that WMG took a stake in the popular gaming platform Roblox. I want to get a piece of WMG before Roblox goes public one day soon.
Zoom Video Communications Inc (ZM)
Zoom Video Communications (ZM) no longer looks so toppy. ZM made a clean break of 50DMA resistance with a 7.6% pop on Friday. The stock looks poised to at least finish reversing its post-earnings gap down from December 1st. I am a buyer with a stop below the 50DMA.
Be careful out there!
Footnotes
“Above the 40” (AT40) uses the percentage of stocks trading above their respective 40-day moving averages (DMAs) to measure breadth in he stock market. Breadth indicates the distribution of participation in a rally or sell-off. As a result, AT40 can identify extremes in market sentiment that are likely to reverse. Above the 40 is my alternative name for “T2108” which was created by Worden. Learn more about T2108 on my T2108 Resource Page. AT200, or T2107, measures the percentage of stocks trading above their respective 200DMAs.
Active AT40 (T2108) periods: Day #80 over 20%, Day #64 above 30%, Day #63 over 40%, Day #5 over 50%, Day #2 over 60% (overperiod), Day #11 under 70%


Red line: Overbought threshold (70%); Blue line: Oversold threshold (20%). Source: FreestockCharts
Source for charts unless otherwise noted: TradingView.com
Full disclosure: long UVXY shares and calls, long SPY put spreads, long AAPL calls
FOLLOW Dr. Duru’s commentary on financial markets via StockTwits, Twitter, and even Instagram!
*Charting notes: FreeStockCharts stock prices are not adjusted for dividends. TradingView.com charts for currencies use Tokyo time as the start of the forex trading day.