
Stock Market Statistics
AT40 = 43.5% of stocks are trading above their respective 40-day moving averages (DMAs)
AT200 = 44.9% of stocks are trading above their respective 200DMAs
VIX = 25.8
Short-term Trading Call: cautiously bearish
Stock Market Commentary
Tech stocks led the way up, and now they are leading the way down. The top 1% of the S&P 500 (SPY) are weighing heavily on the index. Yet much of the stock market refuses to follow the lead. A tech stock breakdown continues to unfold even as much of the rest of the stock market yawns. The effective rotation is burying tech stocks in the weeds of the garden and fertilizing the growth of other promising crops in commodities, transports, industrial, and even small cap plays.
The Stock Market Indices
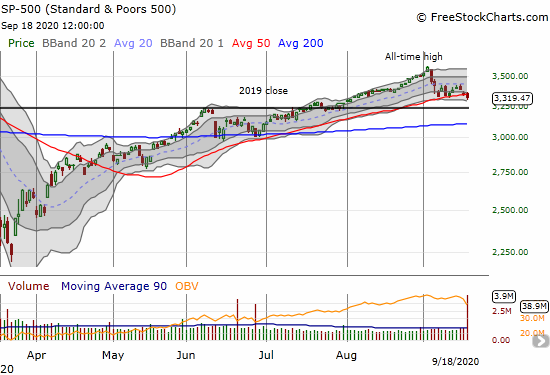
The S&P 500 (SPY) lost 1.2% and finally broke down below support at its 50-day moving average (DMA). September’s pullback to-date erased almost all of August’s gains. The 50DMA held as support since April’s sharp rebound from the March stock market crash. Next support sits close by at the 2019 close.
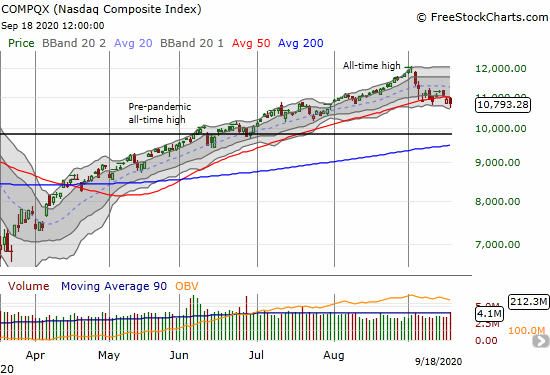
The NASDAQ closed the previous week with a 50DMA breakdown as a definitive confirm of the tech stock breakdown. The tech laden index ended last week with a confirmed 50DMA breakdown. August’s gains were fully reversed by the intraday low on Friday. The next line of “natural” support sits at the pre-pandemic all-time high. Such a move has triple significance. Firstly, that support sits just below a 20% pullback from the all-time high. A pullback that large signals a bear market, but it also marks a point where “bargain hunters” and dip buyers get really interested. Secondly, 200DMA support is converging on the pre-pandemic all-time high. Thirdly, NASDAQ 10,000 sits right in the middle of this mix calling out for a retest.
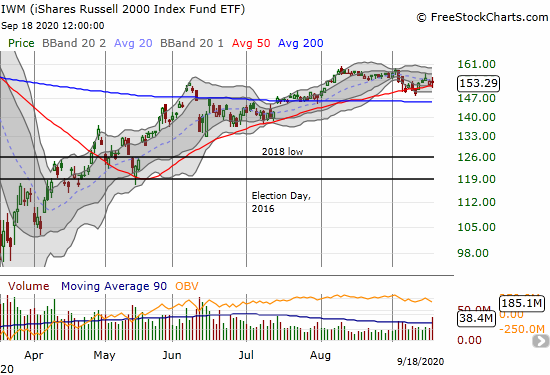
In the middle of this tech stock breakdown, small caps yawn. The iShares Russell 2000 Index Fund ETF (IWM) printed a gain for the week and held 50DMA support. This out-performance is rare and represents a new divergence in fortunes in the stock market. Still, upside looks limited for IWM as the August highs hold firm as resistance.
Stock Market Volatility
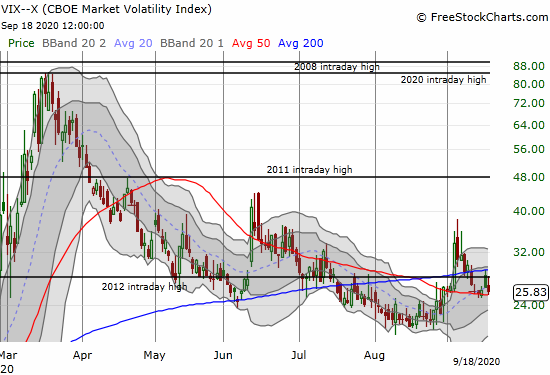
The yawns in the face of the tech stock breakdown are loudest with the volatility index (VIX). The VIX managed to fade sharply from its Thursday gap open and lost 2.4% on Friday. The large one-day surge from September 3rd is almost a distant memory. Traders are clearly quite willing to treat the sell-off in the land of tech as a rotational dynamic rather than a warning sign for the rest of the stock market.
The Short-Term Trading Call for This Tech Stock Breakdown
AT40 (T2108), the percentage of stocks trading above their respective 40DMAs, also yawned in the face of the tech stock breakdown. My favorite technical indicator closed at 43.5% which is three percentage points higher than the previous Friday’s close. Thus, a slight bullish divergence is bubbling under the surface of the pullback in the S&P 500 and the NASDAQ. This bullish divergence is tantalizing because the 50DMA breakdowns in these indices further confirmed my earlier switch to a (cautiously) bearish bias on the stock market.
Instead of following the bullish divergence, I pushed myself to get more aggressive on bearish tech bets in the wake of 50DMA breakdowns. I bought calendar and vertical put spreads on the Invesco QQQ Trust (QQQ). I placed expirations in October in deference to the potential of a reflex rebound in the coming week. More selling from here gets me incrementally more bearish. Note that my seasonal analysis of summer trading in the S&P 500 points to 3265 as the index’s likely low for the month – just another 2% down from here. In fact, Friday’s close was just marginally lower than the close on the first day of post-summer trading.
On balance, my trading call stays at cautiously bearish. Given how well the 20DMA capped the S&P 500 since summer trading ended, I will stay bearish until/unless the index closes above that line of resistance.
The stock charts below provide numerous examples of the dilemma of a bullish divergence running in parallel with fresh bearish breakdowns in the S&P 500 and the NASDAQ. The stock charts show a healthy mix of strength, weakness, and tantalizingly bullish setups right at natural support points. As a result, I waver between pressing the issue on the tech stock breakdown and speculating on bullish setups.
Stock Chart Reviews: Video Summary
Stock Chart Reviews – Below the 50DMA
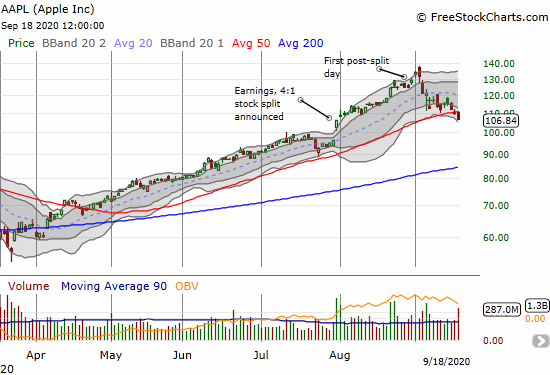
Apple (AAPL)
Six months ago I lamented the 200DMA breakdown on Apple (AAPL) as a meaningful loss for the stock market. AAPL’s 3.2% loss and 50DMA breakdown on Friday is almost as meaningful. The AAPL sell-off looks like a major cool-down from a startling run-up presumably accelerated by the announcement of a stock split. The execution of that stock split almost perfectly marked the top for AAPL. Now, AAPL has worked off all its gains following the first day of post-earnings trading. Current momentum and the bearish breakdown suggest more downside remains with a complete reversal of the post-earnings breakout serving as next support.
Note that, per rule, I bought weekly AAPL calls despite the ugliness. Naturally, I am looking to take profits if Monday or Tuesday offers up the typical rebound gains for AAPL.
Chegg Inc (CHGG)
On-line education company Chegg (CHGG) closed near a 3-month low. Earnings on August 3rd immediately preceded the all-time high. The 50DMA breakdown created a head and shoulders top. The 200DMA is in-play as the next line of support.

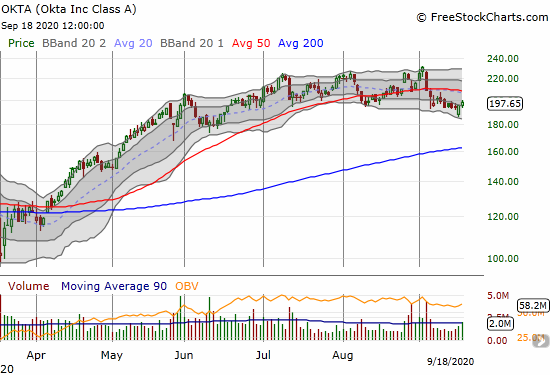
Okta (OKTA)
Okta (OKTA) was one of many high-tech momentum darlings coming off the March lows. The three peaks from July to September gave the appearance of continued momentum. Now, with a confirmed 50DMA breakdown as a part of the tech stock breakdown, the loss of momentum is clearer. OKTA has effectively gone nowhere since late May. The stock looks ready for a slow grind to 200DMA support.
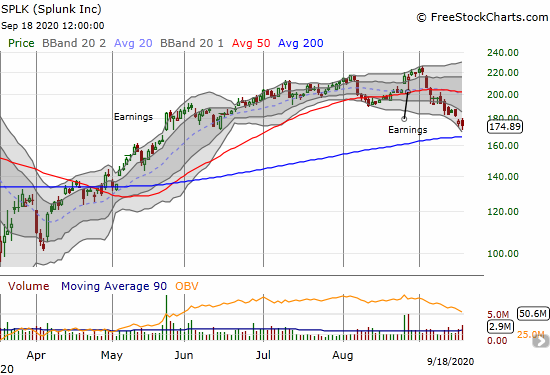
Splunk (SPLK)
Earnings provided one last spark for big data software company Splunk (SPLK) before the stock sputtered this month. SPLK’s confirmed 50DMA breakdown erased gains going back to May’s post-earnings pop. Support at the 200DMA is right around the corner. SPLK is a poster child for the tech stock breakdown.
Spotify Technology (SPOT)
Spotify (SPOT) may be running out of exciting press releases about new podcasts. Now the company is trying to pick an anti-trust fight with Apple over its new services bundle. Music streaming and podcasting is a highly competitive and crowded space. Accordingly, I do not understand Spotify’s premium stock price. The Apple One bundle is one more reminder that profits will get squeezed in this space over time. I am expecting SPOT in due time to completely reverse the June breakout.

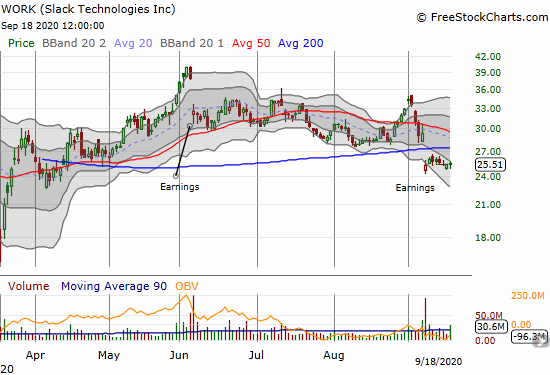
Slack Technologies (WORK)
On-line messaging company Slack Technologies (WORK) delivered another post-earnings disappointment this month. This time, WORK suffered a bearish 200DMA breakdown likely accentuated by the tech stock breakdown. Slack has had a good run and competition is coming after them from Microsoft Teams (when will Zoom Technologies roll out a messaging platform?). Slack’s current popularity makes it easy to forget that messaging services and companies have come and gone in rapid cycles since the birth of the internet. Believe it or not, in the next few years or so, there will be another corporate messaging fad that pushes Slack to the side.
Recall that WORK opened at $38.50 after its direct listing in June, 2019. The stock went nearly straight down for the next 5 months. WORK became a popular pandemic trade on the new digital economy for three months. June earnings burst that momentum just as WORK printed a new all-time high.
Borg Warner (BWA)
Borg Warner (BWA) caught my attention as a potential play on the rotation out of high-tech and into cyclical industrial sectors. The company specializes in auto parts including combustion engines, hybrid vehicles, and electric vehicles. Unfortunately, BWA confirmed a 50DMA breakdown last week. So I am content to keep watching this one for now.

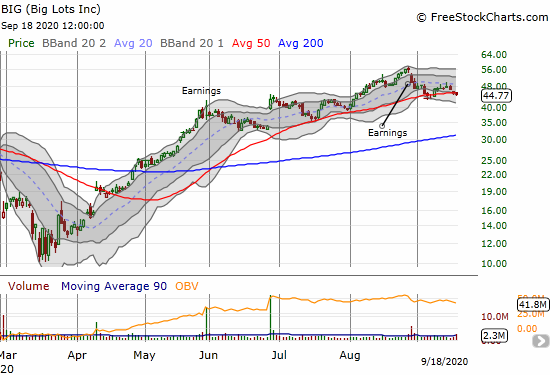
Big Lots Inc (BIG)
Discount retailer Big Lots (BIG) is a big winner with the pandemic trade. Despite two earnings report in a row that generated selling, the stock held onto 50DMA support…until Friday. BIG is only in the clear after it closes above $50 and above the latest churn in the stock. Continued bearish momentum should put the 200DMA support in play in short order.
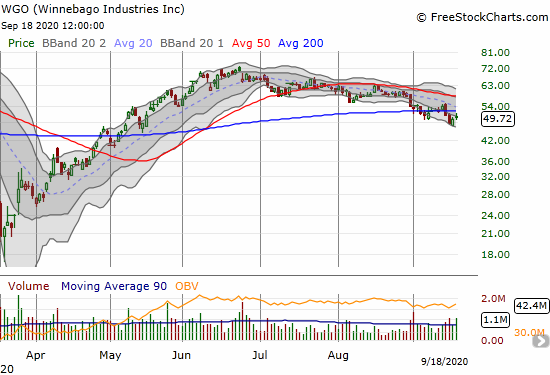
Winnebago Industries Inc (WGO)
The outdoor trade recently diverged between the RV makers and sporting goods retailers. Winnebago Industries (WGO) peaked back in June with a subsequent trail including 50DMA breakdowns, confirmed 50DMA resistance, and now a confirmed 200DMA breakdown. The stock is a short with a stop above the declining 50DMA and could be a decent hedge against my trade in Camping World Holdings (CWH).
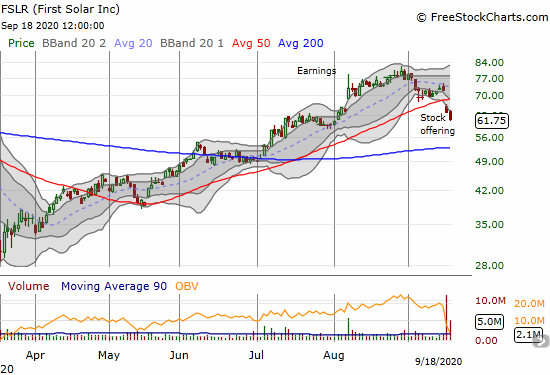
First Solar (FSLR)
At the end of August, I described a multi-year breakout on First Solar (FSLR). The setup was so enticing that I made an exception to my bearish call on the stock market. I bought a covered call position (long shares, short call option). FSLR peaked at that point and added insult to injury by announcing a stock offering last week. The stock promptly broke down below its 50DMA. I set up a long-term play by shorting a January call, so at this point, I am just bracing for a test of 200DMA support.
Forterra Inc (FRTA)
A stock offering took out pipe-maker Forterra (FRTA) last week. The news was whiplash after Forterra announced a bigger than expected paydown of long-term debt. The stock soared 16% on that news. Investors were so unhappy with the offering that not only did sellers force a 50DMA breakdown but also closed the stock 16% below the offering price. FRTA lost 2 1/2 months of gains and faces a test of 200DMA support.
This severe trading action looks overdone although it is consistent with a less forgiving market. I am watching for a test of 200DMA support. I want to buy FRTA as an industrial play that will find favor again sometime soon.

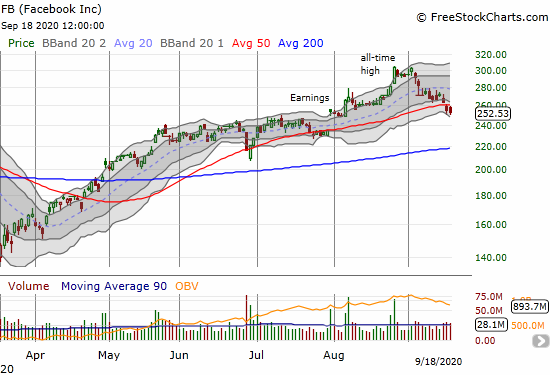
Facebook (FB)
I targeted Facebook (FB) last week with put options. The company is beset with bad news that investors and traders consistently ignore and even buy. That complacency receded this month with the latest news about boycotts taking Facebook into a 50DMA breakdown. With Friday expirations I took profits on my put options; I am looking to reload this week.
Stock Chart Reviews – Above the 50DMA
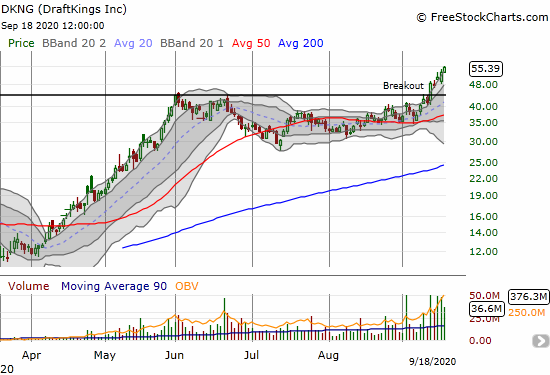
Draft Kings (DKNG)
Daily fantasy sports platform Draft Kings (DKNG) is riding an impressive breakout to a series of all-time highs. The stock is a buy on the dips down to the breakout line.
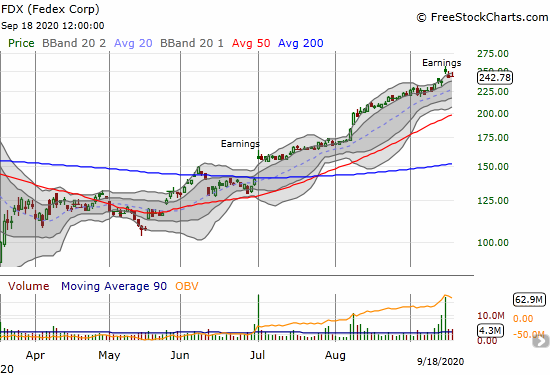
Federal Express (FDX)
Federal Express (FDX) is on an incredible run. The resurrection of FDX symbolizes a growing belief that the economy will soon recover back to “normal.” FDX was a dog after peaking at an all-time high in January, 2018. The stock now trades at a 2-year high. Having said all that, a post-earnings abandoned baby top on FDX provides a big yellow flag of caution. An abandoned baby top features a gap up followed by a gap down at the end of an uptrend. The move “abandons” the buyers of the gap up.
FDX is guilty of a major top until proven innocent with a new post-earnings high.
iPath Dow Jones UBS Cocoa Total Return Sub Index ETN (NIB)
The iPath Dow Jones UBS Cocoa Total Return Sub Index ETN (NIB) is holding a 200DMA breakout. I have a major focus on commodities with the Federal Reserve targeting higher inflation numbers. I neglected to play NIB on this 200DMA breakout, but I am now primed to get back to my buy-the-dip strategy on NIB.

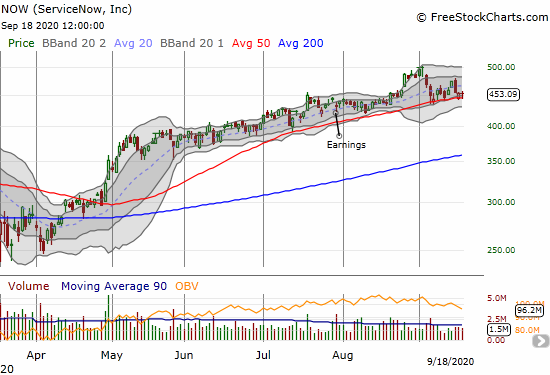
ServiceNow, Inc. (NOW)
Cloud software company ServiceNow (NOW) is one of those tantalizing tech stock sitting on a perfect setup as it tries to lean against the tech stock breakdown. Since tumbling from $500, NOW has tested 50DMA support six times. I am resisting the temptation to buy off support and instead am primed to chase NOW downward if softened support at the 50DMA finally gives way.
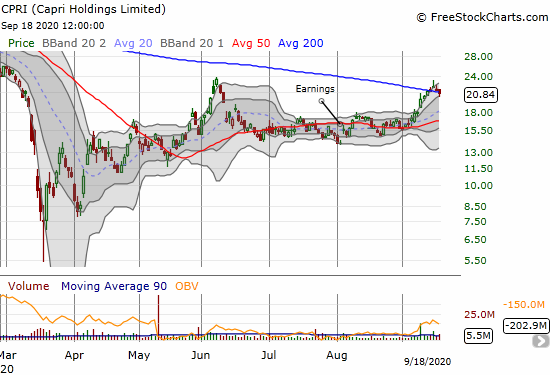
Capri Holdings Limited (CPRI)
Capri Holdings Limited (CPRI) is a stock I bought simply because of a recommendation by Steve Grasso on CNBC’s Fast Money. The stock was still below its 200DMA but Grasso’s long-term case for this luxury retailer made sense to me…not to mention Grasso has a keen trader’s sense. The 200DMA breakout looked like validation but it was short-lived. Note well that, like me, Grasso is overall bearish on the stock market. He is expecting a full-out 20% correction.
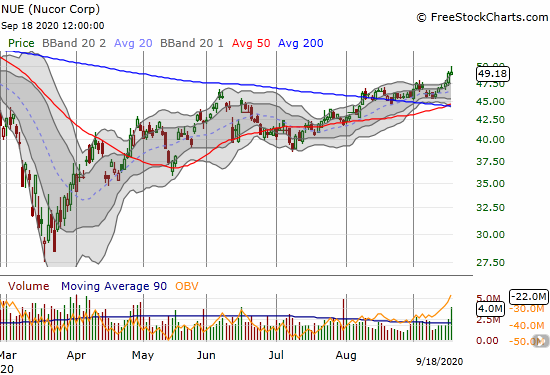
Nucor Corp (NUE)
Steel company Nucor Corp (NUE) is one of my long-term holdings. NUE was one of the few holdings I retained through my bearish call in February. Last month, NUE broke out above its 200DMA and is one of the many industrial plays moving in bullish form.
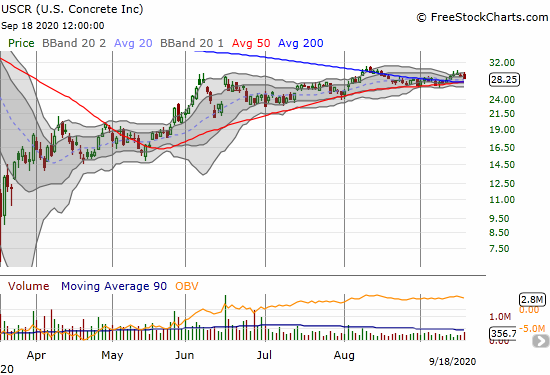
U.S. Concrete Inc (USCR)
U.S. Concrete (USCR) is another industrial company holding up well against the bearish momentum in the stock market. I took profits on my last position last month on the test of 200DMA resistance. I am a buyer again on a breakout above last month’s high. Otherwise, I will buy into the next big sell-off in the stock.
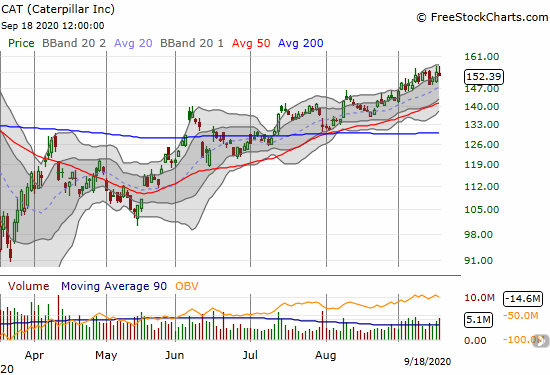
Caterpillar Inc (CAT)
Caterpillar (CAT) is one of the best signs that industrial companies are diverging from the tech stock breakdown. CAT has yawned all month long. Before Friday, CAT even looked poised for a major breakout. I am not a buyer, but I am watching CAT for signs of the durability of the rotation to industrial trades.
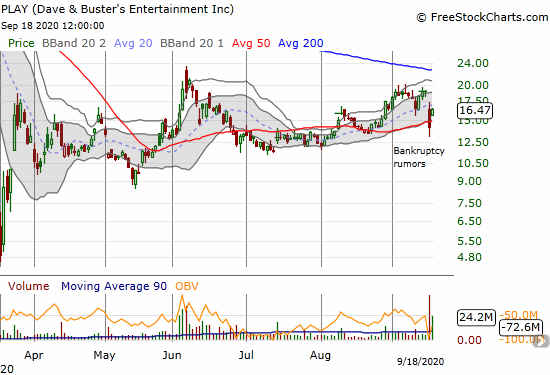
Dave & Busters Entertainment (PLAY)
Dave & Busters Entertainment (PLAY) lost 26.1% in the wake of bankruptcy rumors. Denials popped the stock right back for a 16.6% gain on Friday.
Dave & Busters is in a tough spot. The company’s status depends on local public health regulations. I randomly checked out locations to see that in Southern California D&B is open for outdoor dining, three locations in the San Francisco Bay Area remain closed, and locations in Alabama, Texas, and Ohio are open “for fun.” The big question is whether enough people are willing to take the risk to game indoors for hours at a time. Play lost 8.3% after reporting earnings on September 10th but bounced right back along with the rotation out of tech plays. Overall, the risk/reward looks poor.
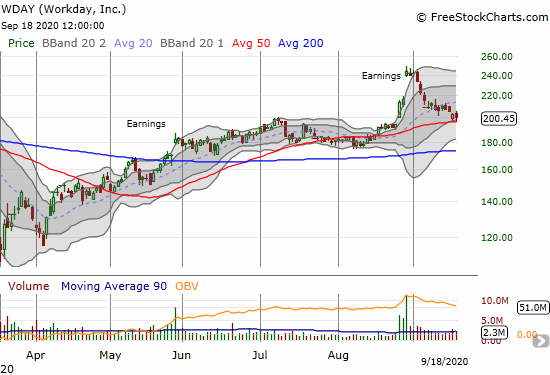
Workday, Inc (WDAY)
I have long been a fan of human resources software company Workday (WDAY). As a result, this pullback in the stock looks particularly enticing. WDAY is another tech stock where the recent sell-off wiped out an important set of gains. WDAY lost all its post-earnings gains and then some with this test of 50DMA support. My next move depends on the NASDAQ. I am willing to buy call options as a quick counter-speculation for a 50DMA bounce. I doubt I will chase a 50DMA breakdown on this one.
NVIDIA Corporation (NVDA)
NVIDIA Corporation (NVDA) announced a $40B buyout of ARM Holdings from Softbank. The company will use cash and stock for the purchase. The stock market promptly awarded NVDA with about half the money it needs for the deal with a 5.8% pop in the stock. This deal and the subsequent price action is exactly the kind of thing I expect to see at a major top for high tech.
Traders took two days to reverse the post-deal gains. While NVDA continues to levitate above its uptrending 50DMA support, I like a speculative short here with a tight stop above $535 which marks clearance above the recent churn. I am targeting October put options.

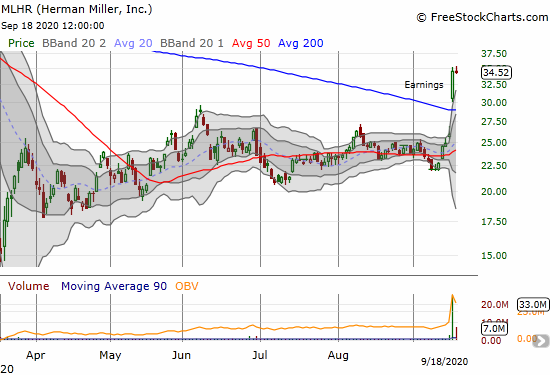
Herman Miller, Inc. (MLHR)
Furniture company Herman Miller, Inc. (MLHR) soared 33.5% post-earnings last week. The 200DMA breakout is very bullish and represents some pent-up buying interest. Even with the housing market soaring in the pandemic, MLHR was left behind to churn in a multi-month trading range. I assume the business in office furniture is (was) performing poorly given the work-from-home (WFH) response to the pandemic. MLHR closed at a 6-month high.
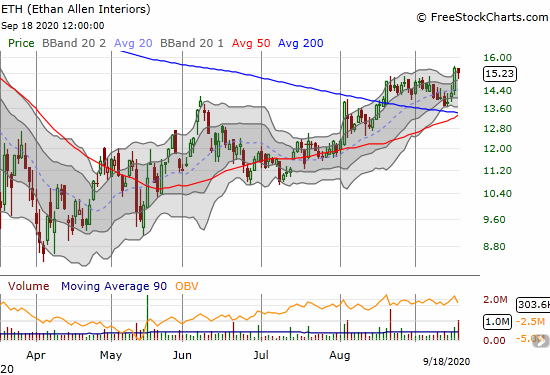
Ethan Allen Interiors (ETH)
Home furnishings company Ethan Allen Interiors (ETH) jumped 8.3% in sympathy with MLHR. ETH pulled off a bullish 200DMA breakout last month as an impressive follow-up to initial post-earnings weakness on August 5th. ETH has immediate upside to $17 or $18 on a continued rotation out of tech and into on-=tech laggards like ETH.
Nutanix (NTNX)
Nutanix (NTNX) delivered a bullish 200DMA breakout last month, and I celebrated the 29% breakout. After one more day of buying, the sellers showed up. Buyers have yet to reappear as the rotation out of tech took its toll on NTNX. Still, I decided to jump back into the fray on the test 200DMA support. The bearish momentum in tech was just too much. NTNX gave up that support and last week gave up 50DMA support as well. The gains from the August breakout are gone.

— – —
FOLLOW Dr. Duru’s commentary on financial markets via email, StockTwits, Twitter, and even Instagram!
“Above the 40” uses the percentage of stocks trading above their respective 40-day moving averages (DMAs) to assess the technical health of the stock market and to identify extremes in market sentiment that are likely to reverse. Abbreviated as AT40, Above the 40 is an alternative label for “T2108” which was created by Worden. Learn more about T2108 on my T2108 Resource Page. AT200, or T2107, measures the percentage of stocks trading above their respective 200DMAs.
Active AT40 (T2108) periods: Day #111 over 20%, Day #105 over 30%, Day #50 over 40% (overperiod), Day #9 under 50% (underperiod), Day #11 under 60%, Day #14 under 70%
Daily AT40 (T2108)
")
Black line: AT40 (T2108) (% measured on the right)
Red line: Overbought threshold (70%); Blue line: Oversold threshold (20%)
Weekly AT40 (T2108)

*All charts created using FreeStockCharts unless otherwise stated
The T2108 charts above are my LATEST updates independent of the date of this given AT40 post. For my latest AT40 post click here.
Be careful out there!
Full disclosure: long AAPL calls, long QQQ put spread and calendar put spread, long UVXY, long SPOT put, long FSLR shares and short call, long CPRI, long NUE, long NTNX shares and calls, short CWH put
*Charting notes: FreeStockCharts stock prices are not adjusted for dividends. TradingView.com charts for currencies use Tokyo time as the start of the forex trading day. FreeStockCharts currency charts are based on Eastern U.S. time to define the trading day.