
Stock Market Statistics
AT40 = 42.5% of stocks are trading above their respective 40-day moving averages (DMAs) (2-month low)
AT200 = 42.1% of stocks are trading above their respective 200DMAs (2 1/2 week low)
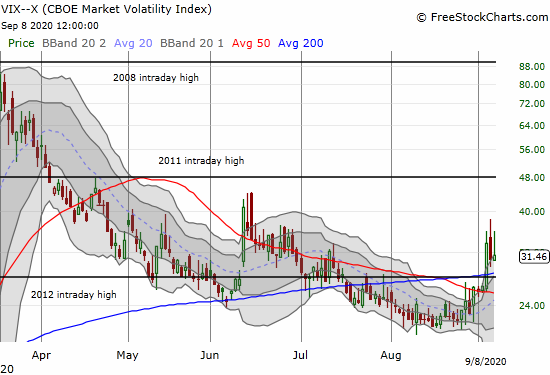
VIX = 31.5
Short-term Trading Call: cautiously bearish
Stock Market Commentary
The swift stock market sell-off took a fresh turn for the worse. AT200 (T2107), the percentage of stocks trading below their respective 200-day moving averages (DMAs), finally dropped out of an extended period of churn. At 42.1%, AT200 closed at a 2 1/2 week low. This drop means a small group of stocks finally succumbed to a very bearish breakdown. Accordingly, I am assuming this stock market sell-off is just getting started.
When the stock market started to climb out of the collapse in March, I pointed out the promising green shoots. Now, I see more and more weeds in the garden. Sure, the Federal Reserve stands ready to do more gardening. Perhaps even Softbank has reserve funds to keep chasing market makers into pushing big cap tech higher. However, the moment of exhaustion has arrived. The harvest gets harder from here as the field hands will get more interested in enjoying the fruits of their labor.
The Stock Market Indices
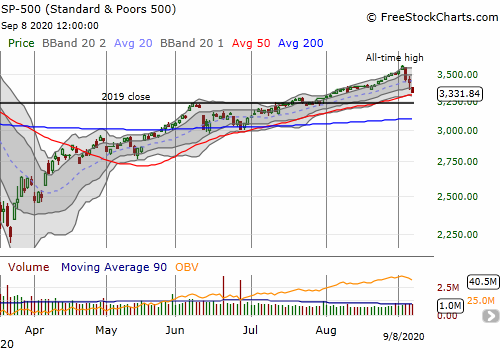
The S&P 500 (SPY) lost ground for the third day in a row. The last 3-day bout of selling ended at 5.9% in one big swoosh on June 11th. This round of selling started with a 3.5% drop. The index is now hovering over a test of its uptrending 50DMA support. The last time the index closed below this critical moving average was in April.
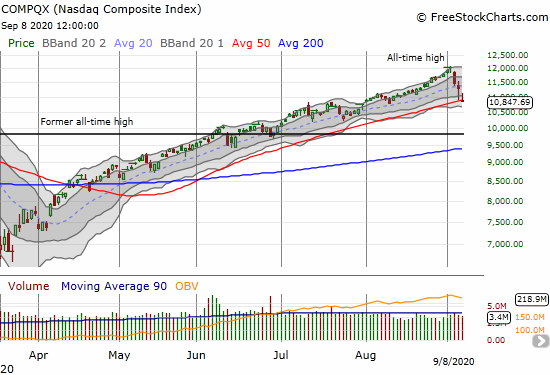
The NASDAQ (COMPQX) led on the way up. The tech laden index is leading the way down. The NASDAQ lost 4.1% and closed a hair below its 50DMA. The NASDAQ and a key group of its constituent stocks accumulated enormous profits since the pandemic, so it makes sense that traders and investors are moving fast against tech stocks to lock in profits. Today’s close also finishes a complete reversal of the August breakout.
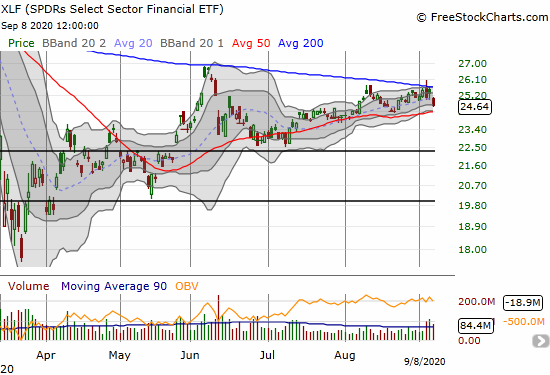
Financial stocks added to the weeds in the garden by confirming resistance at its 200DMA. The SPDRs Select Sector Financial ETF (XLF) lost 2.6% and is threatening another test of 50DMA support.
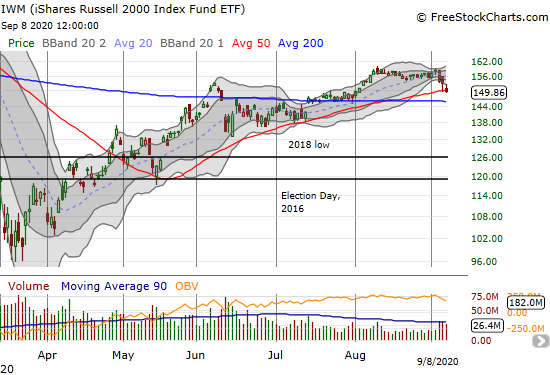
Small caps struggled to clear the weeds for a month going into this stock market sell-off. The iShares Russell 2000 Index Fund ETF (IWM) closed right at 50DMA support. This support has held solidly since April. I am not expecting such good fortune here. However, the 200DMA waits close by to provide another opportunity for support. Regardless, IWM looks like it carved out a top for the time being.
Stock Market Volatility
In recent posts I described the bottoming action in the volatility index (VIX) and then the breakout. However, despite the continued selling in the stock market, the VIX is wavering. On Friday, the fear gauge lost 8.5%. Next, faders managed to push the VIX from an initial surge to a mere 2.3% gain.
This action is a positive signal for the stock market. However, this sign is not bullish; these fades do not clear the weeds. Note that after June’s surge, the S&P 500 churned for the rest of the month until the VIX finished reversing that big one-day gain. Even the powerful NASDAQ did not achieve a fresh and clear breakout until July 2nd. In other words, fade the rallies until further notice (preferably at points of resistance).
The Short-Term Trading Call for This Stock Market
AT40 (T2108), the percentage of stocks trading above their respective 40-day moving averages (DMAs), closed at a 2-month low at 42.5%. Given the severity of the selling in the stock market, I half expected my favorite technical indicator to close near the oversold threshold of 20%. Still, the 12 percentage point drop represents a lot of fallout.
Now that the sell-off is obvious and the stock market is visibly wavering, the stakes on bearish plays increase. A 50DMA breakdown on the S&P 500 and especially the NASDAQ will be “obvious” bearish signals which could attract contrarian players in this liquidity-driven market. Moreover, the Federal Reserve comes into play next week. Accordingly, Chairman Jay Powell is sure to offer the markets soothing words if needed.
The short-term trading call stays at cautiously bearish until either AT40 drops to the low 30s or the S&P 500 manages to print a new high. For both cases, I will flip to neutral. In the former case, I will flip to prepare my mind for a potential plunge into oversold territory. In the latter case, I will prepare my mind for the next signal to flip right back to bearish.
Stock Chart Reviews – Below the 50DMA
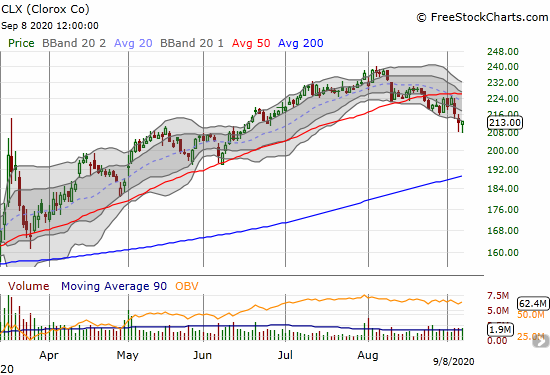
Clorox (CLX)
Clorox (CLX) looked like such a clear case for a short that I featured the stock in late August. After confirming 50DMA resistance, the stock is already making a case for a bottom with “long tails” from buyers picking up the stock off intraday lows two days in a row. Thus, CLX is in neutral territory with a bearish case clearing up again on a break of the intraday lows and/or a fresh test (and failure) at 50DMA resistance.
Moderna (MRNA)
I rushed into Moderna (MRNA) put options on Friday after seeing an NPR story raising fresh questions about insider stock sales. In a bearish market, these kind of headlines suddenly matter. I cannot confirm that today’s 13.2% loss came from NPR’s story about the bio-tech company whose one product is a coronavirus vaccine in clinical trials, but I took profits as the stock traded well below its lower Bollinger Band (BB). Such a move represents an over-extended move in price.
In after hours, MRNA gained back a bit on news that AstraZeneca Pharmaceuticals (AZN) and Oxford suspended a highly heralded clinical trial for a coronavirus vaccine. The race for vaccines is important, but the investing and trading dynamics in this space are treacherous. The competition is fierce in what promises to be a market fraught with political churn, public hesitancy to take a vaccine rushed out to market, and poor economics.

United States Oil Fund LP (USO)
For months the United States Oil Fund LP (USO) essentially lay dormant. I did not even notice last week’s wavering. Sellers piled on today and forced USO down 6.2% as oil prices plunged. A fresh collapse in oil prices would bring a more serious and more fundamental concern to a stock market sell-off.

Stock Chart Reviews – Above the 50DMA
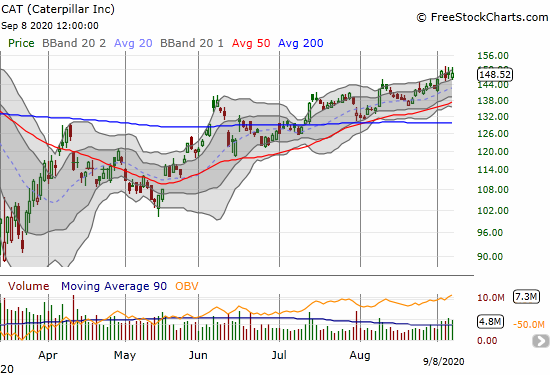
Caterpillar Inc (CAT)
Caterpillar (CAT) is usually my go-to play for put options either to hedge bullish bets or to get on a bearish bandwagon. CAT has not wavered this month, and I still see no point in getting bearish on CAT until/unless it at least drops below its 50DMA.
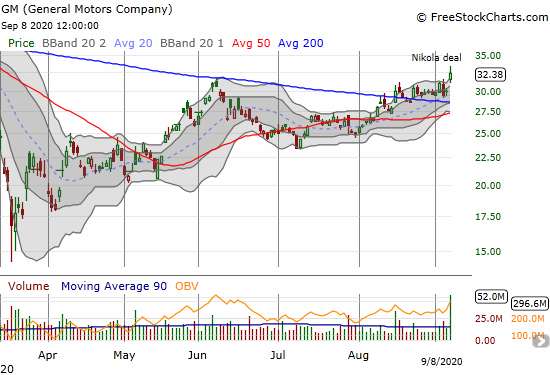
General Motors (GM)
General Motors (GM) was a bullish breakout feature at the end of August. GM’s 7.9% surge in a bearish stock market provides even more convincing evidence of the importance of this signal. GM soared on news of striking a deal with zero-emissions truck company Nikola (NKLA). From the press release:
“Nikola will exchange $2 billion in newly issued common stock for the in-kind services and access to General Motors’ global safety-tested and validated parts and components. General Motors will be subject to a staged lock-up provision beginning in one year and ending in June 2025. General Motors will engineer, homologate, validate and manufacture the Nikola Badger battery electric and fuel cell versions.”
GM suddenly rose up in rank on my shopping list for a bullish stock market. GM has little to lose in this deal and gets a LOT of potential upside.
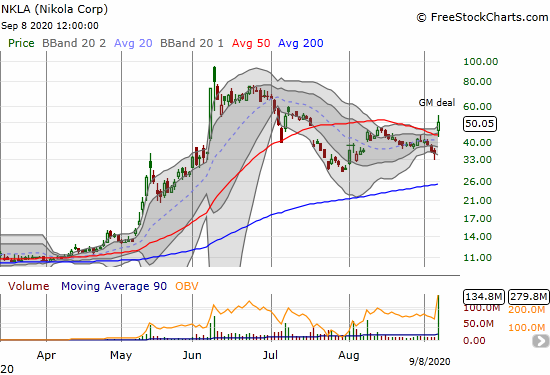
Nikola (NKLA)
I made the case for buying Nikola (NKLA) a month ago. At that time, the CEO gave a tease about a pending deal with a major manufacturer. I assumed the news would come with the company’s earnings release later that week. Ironic that the news came in the middle of a sharp sell-off in the stock market that is slamming speculative stocks particularly hard.
NKLA soared a mind-boggling 40.8% on the news even though such an announcement should have been well-anticipated. Moreover, the two billion shares GM earned reads like massive dilution (free money for NKLA) even if the cash-out events are pushed out far into the future.
For now, NKLA just gained a lot of credibility and scored points with the stock market. My trade on NKLA, a collared position around shares, now looks more conservative than ever! I will now look to lock in profits ahead of the October expiration of the put side of the trade.
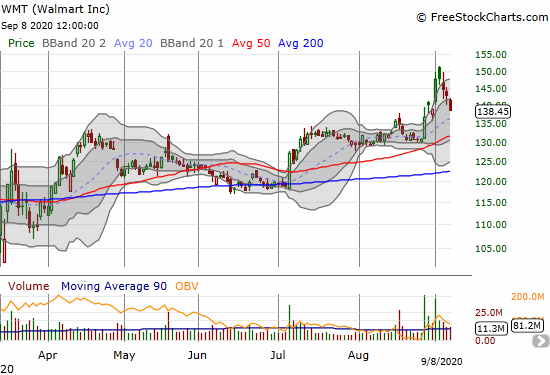
Walmart (WMT)
Walmart (WMT) keeps experiencing bouts of tech-like trading. News about the company partnering with Microsoft to buy TikTok helped propel the stock straight up. After a gap and crap last week at all-time highs, WMT went straight back down. Even a stalwart like WMT must pay the price for parabolic moves!
— – —
FOLLOW Dr. Duru’s commentary on financial markets via email, StockTwits, Twitter, and even Instagram!
“Above the 40” uses the percentage of stocks trading above their respective 40-day moving averages (DMAs) to assess the technical health of the stock market and to identify extremes in market sentiment that are likely to reverse. Abbreviated as AT40, Above the 40 is an alternative label for “T2108” which was created by Worden. Learn more about T2108 on my T2108 Resource Page. AT200, or T2107, measures the percentage of stocks trading above their respective 200DMAs.
Active AT40 (T2108) periods: Day #103 over 20%, Day #97 over 30%, Day #42 over 40% (overperiod), Day #1 under 50% (ending 37 days over 50%) (underperiod), Day #3 under 60%, Day #6 under 70%
Daily AT40 (T2108)
")
Black line: AT40 (T2108) (% measured on the right)
Red line: Overbought threshold (70%); Blue line: Oversold threshold (20%)
Weekly AT40 (T2108)

*All charts created using FreeStockCharts unless otherwise stated
The T2108 charts above are my LATEST updates independent of the date of this given AT40 post. For my latest AT40 post click here.
Be careful out there!
Full disclosure: long NKLA shares, short a call, long puts; long CLX shares, long puts, long calendar put spread
*Charting notes: FreeStockCharts stock prices are not adjusted for dividends. TradingView.com charts for currencies use Tokyo time as the start of the forex trading day. FreeStockCharts currency charts are based on Eastern U.S. time to define the trading day.