
Stock Market Statistics
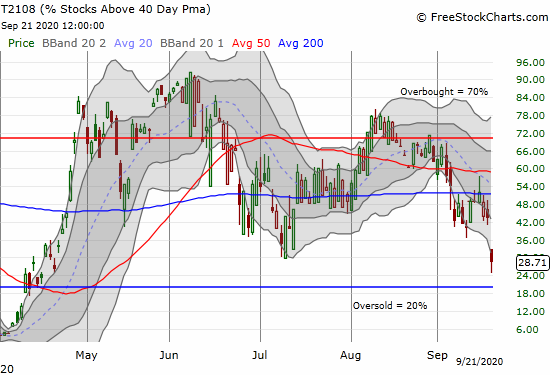
AT40 = 28.7% of stocks are trading above their respective 40-day moving averages (DMAs). (traded as low as 24.8%)
AT200 = 40.0% of stocks are trading above their respective 200DMAs
VIX = 27.8 (traded as high as 31.1)
Short-term Trading Call: neutral (changed from cautiously bearish)
Stock Market Commentary
For a brief moment the entire stock market seemed to be in bearish agreement with gap-downs dominating indices across the board. After the dust settled, traders scrambled for the high tech playbook. In some cases, the dip buying was furious. In other cases, the rebound was gradual. The net result was a sudden end to the rotation away from tech and into industrial-type stocks. The high tech playbook created successful tests of support and even some breakouts. The trading action also created a close call with oversold trading conditions.
The Stock Market Indices
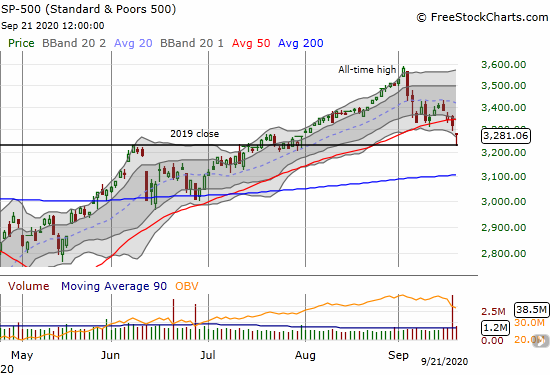
In my last Above the 40 post, I pegged the 2019 close as the likely limit of the sell-off in the S&P 500 for the month (3265 specifically). The S&P 500 (SPY) covered that ground in just one more day. The gap down caught me by surprise because it took the S&P 500 well below its lower Bollinger Band (BB) – an over-extended condition that is not likely to last in a bull market. With the high tech playbook in full effect featuring eager dip-buying, traders helped the S&P 500 (SPY) rebound perfectly off the 2019 close as support. While the resulting hammer pattern looks promising as a bottom, the S&P 500 still confirmed a bearish 50DMA breakdown.
The NASDAQ already confirmed its 50DMA breakout last Friday. When the tech-laden index tapped the lower bound of its Bollinger Band, the high tech playbook created a particularly impressive rebound. The NASDAQ closed the day effectively flat on the day.

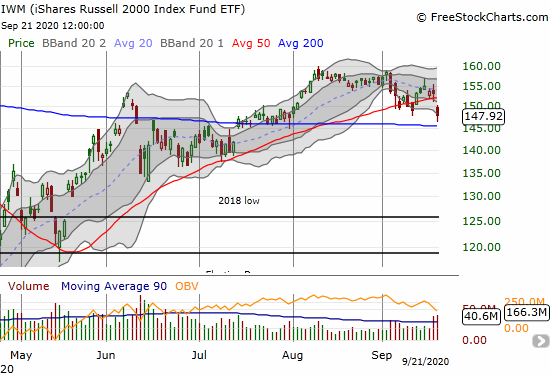
Small caps yawned last Friday in the face of Friday’s high tech breakdown, but the iShares Russell 2000 Index Fund ETF (IWM) was shocked into attention with a 50DMA breakdown and near test of 200DMA support. IWM lost 3.5%.
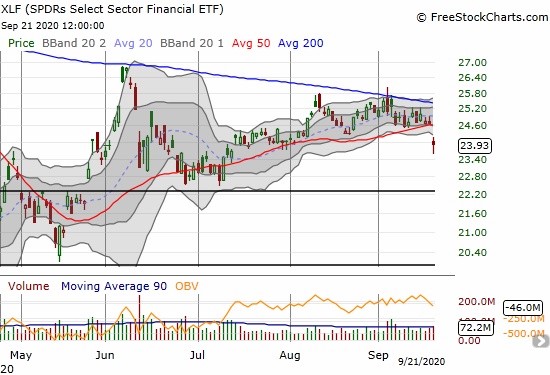
The trading action pushed financials over the ledge. The SPDRs Select Sector Financial ETF (XLF) suffered a 50DMA breakdown and a 3.0% loss which further confirmed overhead resistance at its 200DMA. The poor technicals in (traditional) financials is troubling.
Stock Market Volatility
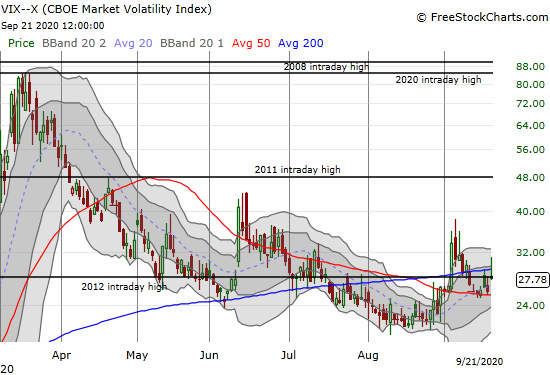
The yawns on Friday were loudest on the volatility index (VIX) as it pulled back despite the breakdown in tech. The surge to 31 looked like a major wake-up call. However, the return to the high tech playbook brought back the regular volatility faders. The VIX closed with a much smaller gain at 27.8.
The Short-Term Trading Call for This Return to the High Tech Playbook
AT40 (T2108), the percentage of stocks trading above their respective 40DMAs, also yawned last Friday. It led the way in creating a wake-up call by trading as low as 24.8% before bottoming. This near encounter with oversold trading conditions is enough to shake me out of my bearish short-term trading call. I switched back to neutral to get my self mentally ready to buy true oversold conditions or buy fresh breakouts above important 50 and 200DMA lines of resistance (I strongly prefer buying oversold).
I covered some short positions into Monday’s big gap down, but I left intact several put options including the spreads on Invesco QQQ Trust (QQQ). With October expirations I am fine using these positions as hedges on getting more active on the long side of the market.
The return to the high tech playbook was so abrupt and covered so much ground from the day’s lows that I do not expect buying follow-through right away. Indeed, at the time of writing the Australian dollar versus the Japanese yen (AUD/JPY) is selling off again and flagging a quick return to risk aversion. I also remain more interested in the industrial plays that were soaking up the money fleeing high tech in September. I remain skittish about the high tech playbook beyond quick trades (like the weekly Apple (AAPL) call trade).
Stock Chart Reviews – Below the 50DMA
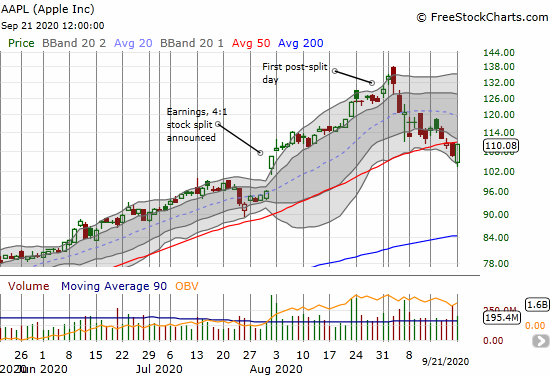
Apple (AAPL)
Apple (AAPL) symbolized a rapid return to the high tech playbook, especially for big caps. After trading down as much as 3.5%, AAPL rocketed back to a 3.0% gain. AAPL closed just below its 50DMA, so it needs one more nudge higher to suggest that a major dip buying opportunity is underway.
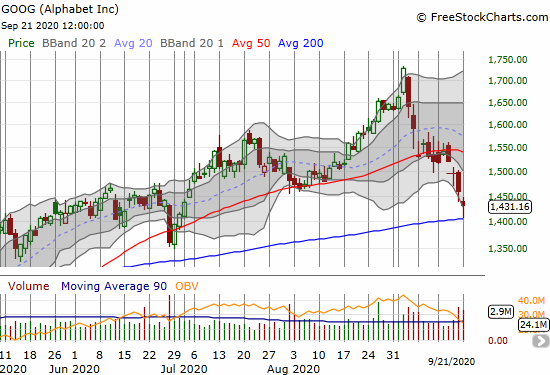
Alphabet (GOOG)
Alphabet (GOOG) is one of the big cap tech stocks already testing support at its 200DMA. GOOG last traded below 200DMA support in late April. I jumped into a GOOG weekly call spread (1450/1480) as an early bet on fresh gasp of life for the high tech playbook.
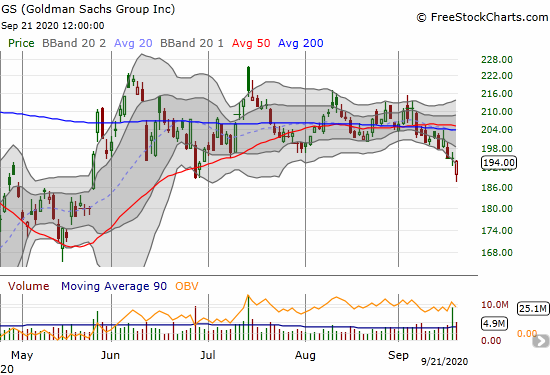
Goldman Sachs (GS)
I meant to write about Goldman Sachs (GS) in the last Above the 40 post. While GS closed flat on the day after rebounding from an over-extended move below its lower Bollinger Band (BB), the stock looks like it is in the middle of a larger breakdown. I want to fade rallies.
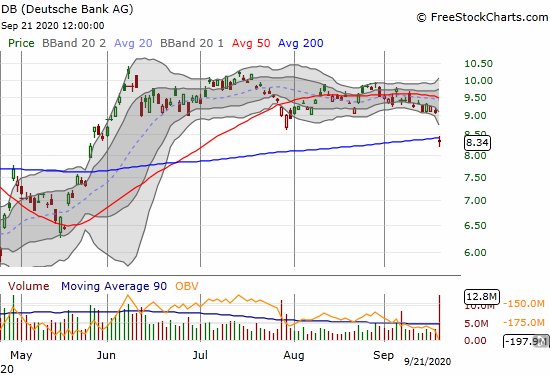
Deutsche Bank (DB)
Deutsche Bank (DB) was in a slow motion loss of momentum until today’s large gap down below 200DMA support. An alarming report claiming DB and JPMorgan Chase (JPM) engaged in moving large sums of “suspicious” money created an apparent cascading sell-off in financials…and perhaps the stock market in general.
Stock Chart Reviews – Above the 50DMA
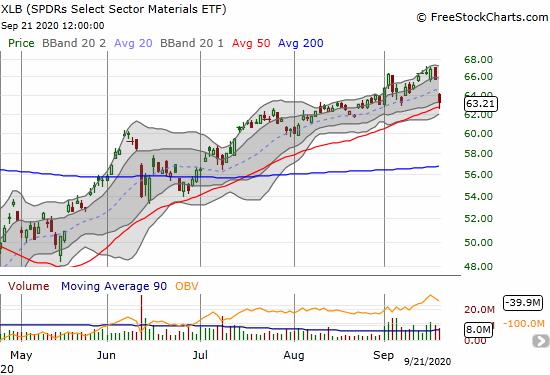
SPDRs Select Sector Materials ETF (XLB)
SPDRs Select Sector Materials ETF (XLB) tumbled from an all-time high all the way back to its uptrending 50DMA support. XLB was one of the most visible victims of the rapid rotation out of industrial type names and right back to the high tech playbook.
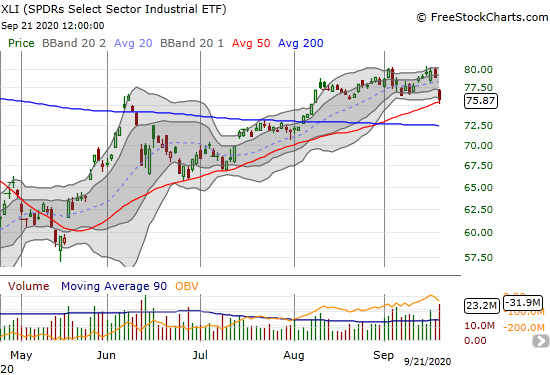
SPDRs Select Sector Industrial ETF (XLI)
The SPDRs Select Sector Industrial ETF (XLI) was slammed just like XLB. The rotation back to the high tech playbook took XLI down from its recent highs right to a test of uptrending 50DMA support.
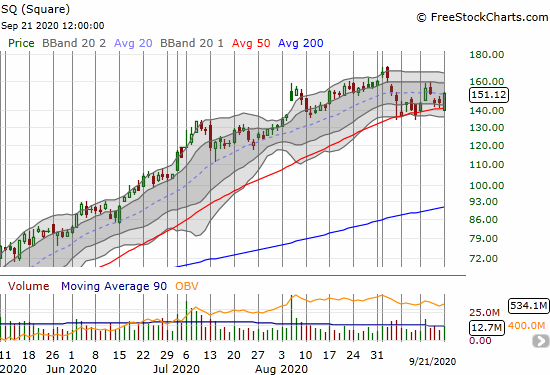
Square (SQ)
Square (SQ) benefited immediately from the rotation back into the high tech playbook. SQ gapped down slightly to 50DMA support and buyers took over immediately. SQ ended the day with a 4.2% gain. The stock is a buy if tech momentum continues. I strongly prefer triggering on a clearance of $160 which conquers the most immediate overhead resistance.
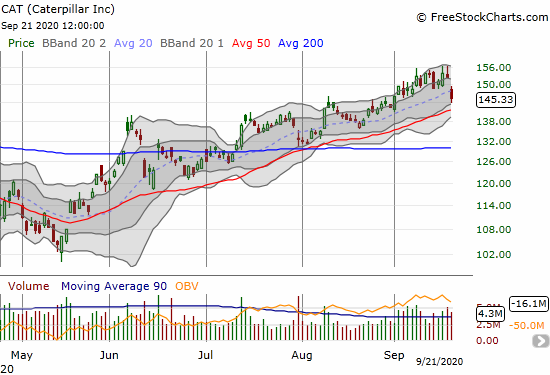
Caterpillar (CAT)
I just finished describing Caterpillar (CAT) as a poster child of the rotation into industrial names. Sellers were nearly relentless in CAT. The stock barely backed off its intraday low for a 4.6% loss on the day.
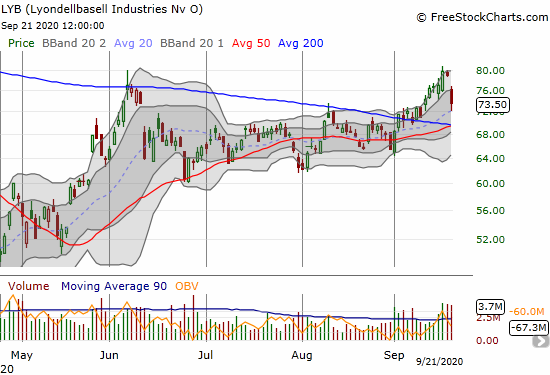
Lyondellbasell Industries (LYB)
Chemical company Lyondellbasell Industries (LYB) lost a whopping 7.0% as it suffered particularly poorly from the rotation out of industrial names. LYB notched a convincing 200DMA breakout earlier this month, so I am looking to buy on a successful test of converged 50 and 200DMA support.
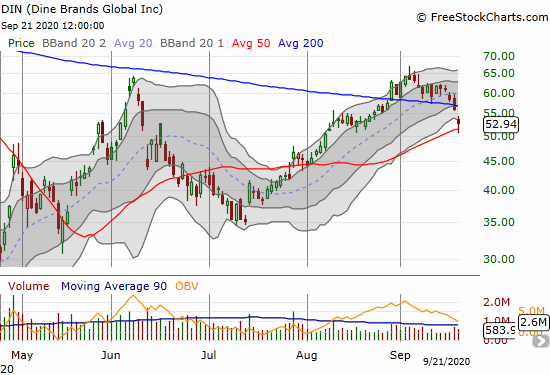
Dine Brands Global Inc (DIN)
Casual dining restauranteur Dine Brands Global Inc (DIN) almost lasted a month trading above its 200DMA breakdown. Unfortunately, today’s gap-down and 5.6% loss confirmed a 200DMA breakdown. The bounce off 50DMA support holds promise for an fresh 200DMA breakout at some point soon.
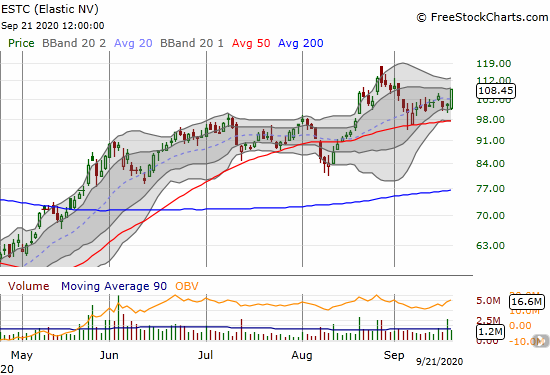
Elastic NV (ESTC)
Tech buyers wasted no time with Elastic NV (ESTC). The stock cleared overhead resistance and gained a convincing 5.1%. The stock is a buy with a stop below the 50DMA.
— – —
FOLLOW Dr. Duru’s commentary on financial markets via email, StockTwits, Twitter, and even Instagram!
“Above the 40” uses the percentage of stocks trading above their respective 40-day moving averages (DMAs) to assess the technical health of the stock market and to identify extremes in market sentiment that are likely to reverse. Abbreviated as AT40, Above the 40 is an alternative label for “T2108” which was created by Worden. Learn more about T2108 on my T2108 Resource Page. AT200, or T2107, measures the percentage of stocks trading above their respective 200DMAs.
Active AT40 (T2108) periods: Day #112 over 20%, Day #1 under 30% (underperiod ending 105 days over 30% and 50 days over 40%), Day #1 under 40%, Day #10 under 50%, Day #12 under 60%, Day #15 under 70%
Daily AT40 (T2108)
")
Black line: AT40 (T2108) (% measured on the right)
Red line: Overbought threshold (70%); Blue line: Oversold threshold (20%)
Weekly AT40 (T2108)

*All charts created using FreeStockCharts unless otherwise stated
The T2108 charts above are my LATEST updates independent of the date of this given AT40 post. For my latest AT40 post click here.
Be careful out there!
Full disclosure: long QQQ put spread and calendar put spread, long UVXY, long GOOG call spread
*Charting notes: FreeStockCharts stock prices are not adjusted for dividends. TradingView.com charts for currencies use Tokyo time as the start of the forex trading day. FreeStockCharts currency charts are based on Eastern U.S. time to define the trading day.