
This blog takes a particular interest in studying and learning from stock market extremes. This year, 2020, is full of stock market extremes with the summer and the first day of post-summer trading delivering their own extremes.
Summer vs Post-Summer Performances and Stock Market Extremes
Measuring summer as the first trading day of June to the last trading day before Labor Day (the first Monday in September), the S&P 500 (SPY) gained an extreme 12.1% over this span in 2020. Since 1950, only 1955 beat out this year’s summer performance. Measuring the first day of post-summer trading as the day after Labor Day, the S&P 500 delivered an extreme 2.8% loss. Since 1950, only 2002 delivered a worse performance.
Given these stark numbers from stock market extremes, I wondered whether the performance of summer and post-summer trading are correlated. The answer is no. Since 1950, the two performances are perfectly uncorrelated, meaning completely random, with a correlation of 0.04. Since 1982, this correlation only improves to -0.19 which is an insignificant inverse relationship.
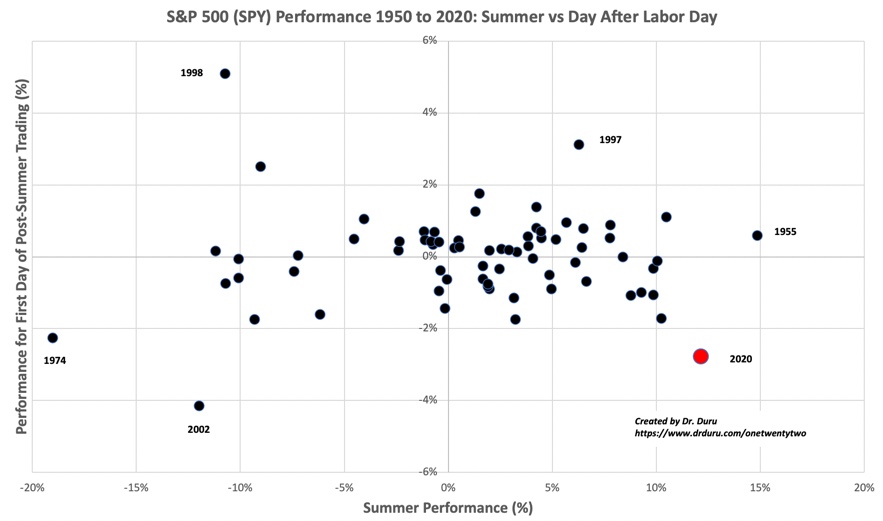
The chart makes the overall randomness clear . (Can you also see how silly the “Sell in May and go away” adage is? Forty-five of these seventy-one summers, or 63%, generated positive returns on the S&P 500). However, the extremes tell interesting stories. Past strong summers, say gains of 8.0% or better, precede a negative start to post-summer trading. Traders moved to lock in some of those juicy gains. Since 1950, extremely good summers preceded negative post-summer one-day returns seven of ten years. Five of those seven years delivered performances from -1.0% to this year’s -2.8%.
On the flip side, extremely bad summers, say -5% or worse, sustained their negative momentum. Since 1950, seven of twelve years with extremely bad summers preceded negative starts to post-summer trading. Note that the extremes of post-summer trading were balanced between upside and downside: two years with one-day gains of +2.5% and +5.1% and two years with performances of -2.3% and -4.2%.
Trading Implications for the Rest of September
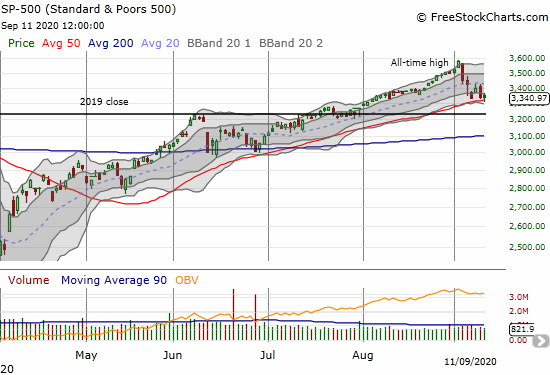
The correlations between the first day of post-summer trading and the rest of September are positive but very small. Since 1950, the correlation is 0.3 and since 1982 the correlation is 0.26. The years 1974 and 2002, the years with the worst starts to post-summer trading before 2020, were VERY bad years for the rest of September. In 1974, the S&P 500 declined 9.9% for the rest of September. In 2002, this performance was little better with a decline of 7.1%. If 2020 behaves like other years that were not quite as bad as this year’s start to post-summer trading, then the rest of the month will lose no more than 2%. So far, the S&P 500 is essentially flat with the close from the first day of post-summer trading.
More data and charts to come in a coming post (including a link to the raw data and analysis).
Be careful out there!
Full disclosure: no position