
Stock Market Statistics
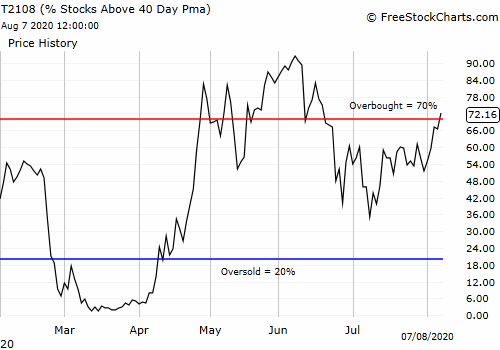
AT40 = 72.2% of stocks are trading above their respective 40-day moving averages (DMAs) (1st day overbought)
AT200 = 42.3% of stocks are trading above their respective 200DMAs
VIX = 22.2
Short-term Trading Call: cautiously bullish
Stock Market Commentary
The last overbought period ended in June. The volatility index (VIX) did not drop much as is typical for such a bullish extreme. I examined the historical data and concluded this overbought period was still a bullish event. I focused on the next buying opportunity to come with a push “close enough” to oversold conditions.
The “close enough” moment for AT40 (T2108), the percentage of stocks trading above their respective 40-day moving averages (DMAs), was 34.9% on July 9th. As luck would have it, the stock market dropped into a bearish divergence that distracted me from the larger context of my historical analysis. Perhaps predictably, the bearish divergence was short-lived. The S&P 500 (SPY) drifted higher from there, yet I left my short-term trading call at neutral. Along the way nagging bearish signals prevented me from flipping back to bullish even as I focused on 200DMA breakout trades and avoided almost all shorting opportunities.
On Friday, AT40 closed above 70% and flipped back to overbought trading conditions. A bullish divergence accompanied this milestone. While the S&P 500 (SPY) struggled to close flat on the day, and the NASDAQ pulled back from an all-time high, the rally in the stock market broadened elsewhere.
The Stock Market Indices
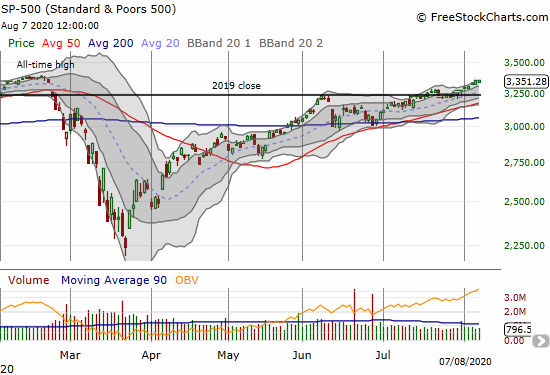
The S&P 500 (SPY) is in a slow motion rally. The index is toying with its all-time high after confirming a fresh breakout above the 2019 close.
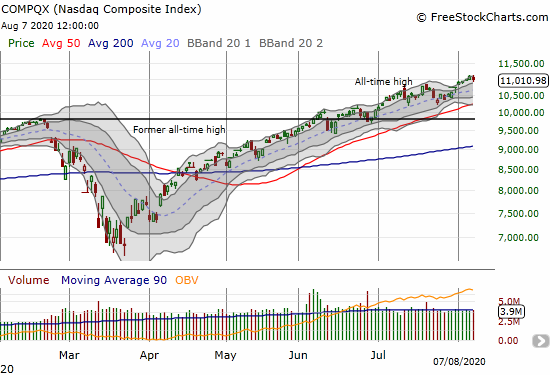
The NASDAQ (COMPQX) pulled back from an all-time high. Its uptrend remains well intact.
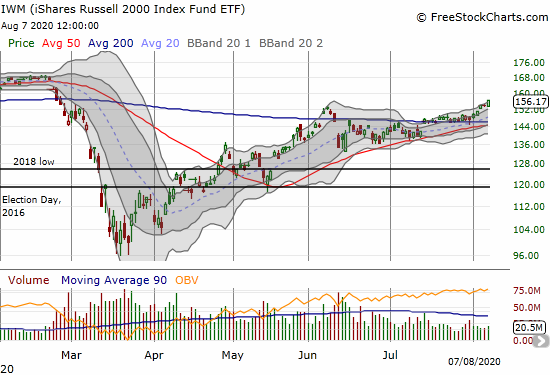
Small-cap stocks are no longer straining to gain fresh momentum. The iShares Russell 2000 Index Fund ETF (IWM) finally broke free of the June high and now looks poised to finish recovering all its losses from the February 50DMA breakdown.
Volatility
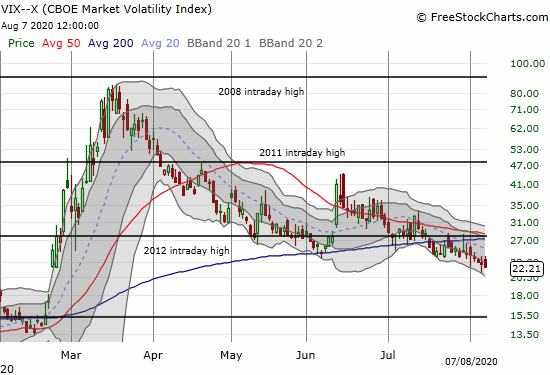
The volatility index (VIX) resumed its slow motion collapse. The VIX closed the week right at its gap up open on February 24th. A gap fill is now officially in play.
The Short-Term Trading Call
The neutral short-term trading call was boring and safe, but it is no longer appropriate. A cautiously bullish short-term trading call more accurately reflects my trading and expectations.
Overbought

The flip to overbought conditions (AT40 greater than 70%) happened with lagging sectors rallying. IWM surged as well as financials and even oil patch plays. These lagging sectors diverged notably with the S&P 500 and the NASDAQ and contributed to the bullish divergence between AT40 and the S&P 500.
Even if money quickly rotates back to big cap tech, last week (re)confirmed that the stock market is content levitating on the liquidity from the promises of the Federal Reserve and emergency fiscal funds. Investors and traders are more focused on the green pastures over the covid-19 horizon than the salient risks of the here and now. The question for financial markets is not whether trillions are coming, but how many trillions. This tide of liquidity is sufficient for now and can easily support another round of extended overbought trading conditions.
The slow healing in the labor market is an added bonus for financial markets. The July jobs report showed “total nonfarm payroll employment rose by 1.8 million in July, and the unemployment rate fell to 10.2 percent…”
If overbought conditions come to a quick end, I will stay cautiously bullish until/unless key support at the 50DMA breaks without AT40 dropping into oversold conditions (below 20%).
Stock Chart Reviews: Video Summary
Stock Chart Reviews – Below the 50DMA
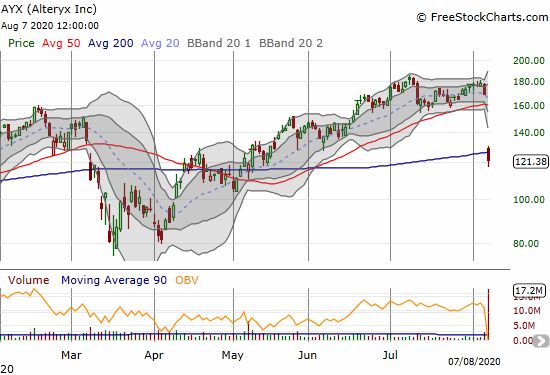
Alteryx (AYX)
Alteryx (AYX) makes business intelligence (BI) and analytics software. Alteryx disappointed investors with fiscal year revenue guidance that came under “expectations.” The result was a 28.2% loss and a 200DMA breakdown. Given the strength of the stock market, I am looking to buy into this mishap on the first close above the 200DMA. Bears can short this stock here but expect a very tight window of success. AYX is an extremely expensive stock at 25.6 price/sales and a short interest 17.8% of float (from Yahoo Finance). In a more “normal” market, AYX would and should trade a LOT lower.
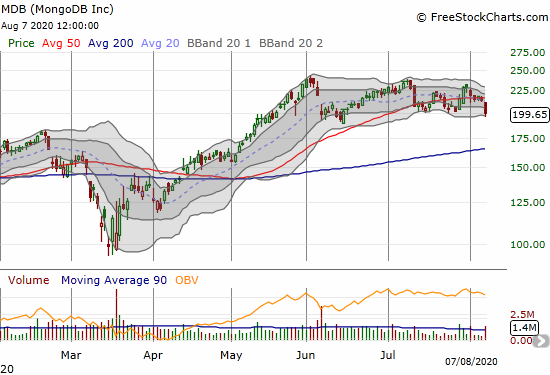
MongoDB (MDB)
I keep checking in on MongoDB (MDB) for a buying opportunity. After each view I see a stock that looks like it is slowly topping out. MDB has gone nowhere for almost three months. Over the last month MDB spent more time trading below its 50DMA than above.
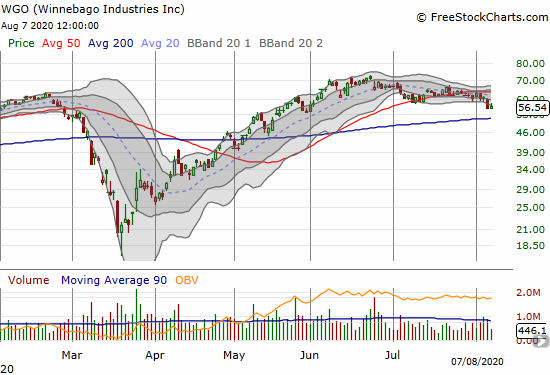
Winnebago Industries Inc (WGO)
Recreational vehicle (RV) manufacturer Winnebago Industries Inc (WGO) topped out in June. Slowly but surely the stock slid into a 50DMA breakdown. Thursday’s 7.5% loss put 200DMA support in play. I am keeping a close eye on WGO as the outdoor and alternative vacation space has been a strong area of the market. The depths of an historic recession seems like an odd time for consumers to spend $100K+ for a rolling home, but this two-speed economy means the folks with money are still willing to spend.
Stock Chart Reviews – Above the 50DMA
Carvana (CVNA)
E-commerce used car company Carvana (CVNA) broke out to fresh all-time highs in June. The pandemic apparently has boosted business. Consumers are flocking to used cars as a substitute for public transport and as a cheaper option than new cars. Buying a car from a “vending machine” is a mind-boggling concept. Buying a used car remotely for delivery like an Amazon package perhaps even more mind-boggling. Yet $1.12B in revenue last quarter suggests the model works in this economy.
CVNA soared a stunning 28.1% post-earnings. Sellers stepped in the next day to deliver a 13.9% haircut. The parabolic post-earnings move makes this stock hard to trade until the dust settles a bit. The steady uptrend from the ashes of the March stock market crash is the guide. The stock is only a short after the uptrend fails. Still, bears have crowded into CVNA to the tune of 41.4% of float. Something tells me Thursday’s post-earnings surge was mainly about a massive blow-out of short-covering.

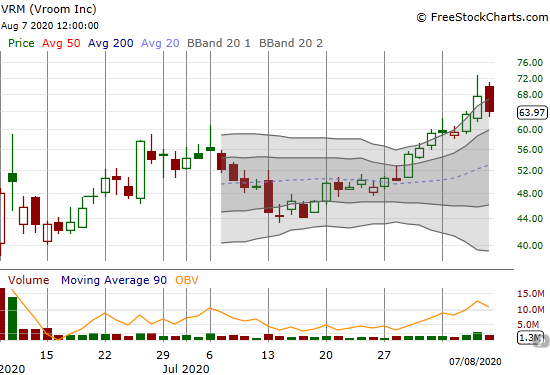
Vroom (VRM)
Taking cues from the popularity of buying used cars online, I have traded in and out of Vroom (VRM) since its IPO in June. I only participated partially in the current run-up as I did not expect a breakout to new all-time highs. I am now waiting to see the results from August 12th earnings before deciding on a fresh entry point.
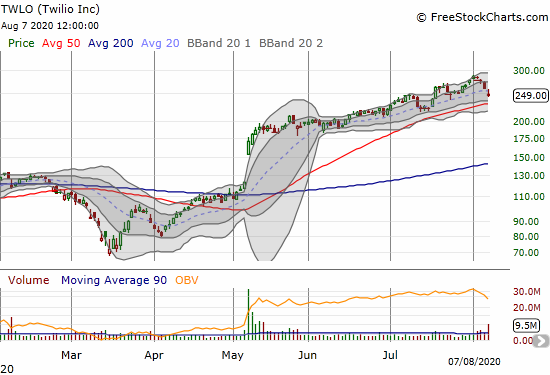
Twilio (TWLO)
Despite selling off for three straight days post-earnings, Twilio (TWLO) still looks very bullish given a tremendous post pandemic run-up. On Friday evening, TWLO priced a massive stock offering of 5,060,729 shares at $247. I would normally treat this $1.25B withdrawal from the stock market as a bearish event: past stock offerings served as topping signals in the past. This time, I am more measured. I am looking to see what happens with uptrending 50DMA support. A breakdown would be bearish.
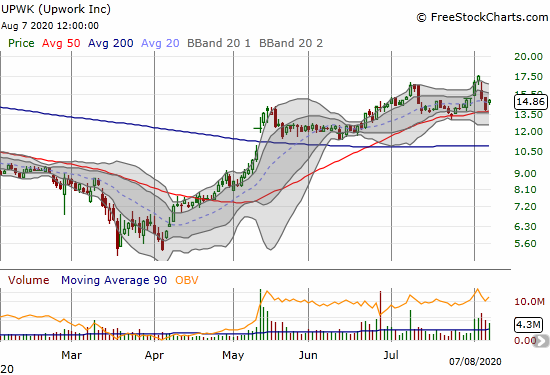
Upwork (UPWK)
Almost a month ago I noted very bullish developments for Upwork (UPWK). The stock ran up sharply into earnings where my natural reflexes took over: I took profits on my August $20 call options. Upwork ended up disappointing and sold off hard post-earnings for a 13.8% loss. My remaining solace is the August $17.5 call option I sold against the position. Support at the 50DMA is one more point of solace. UPWK provided another example of a stock that betrays options action.
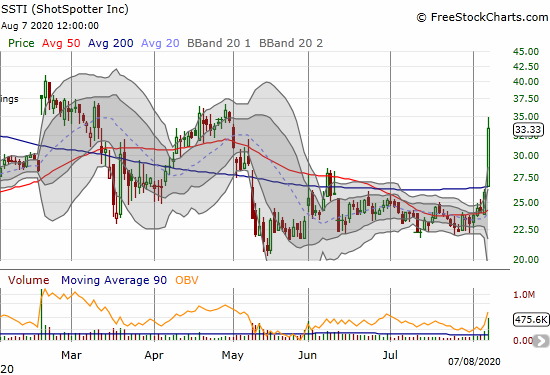
ShotSpotter Inc (SSTI)
ShotSpotter (SSTI) blew me away on Friday with a 28.3% post-earnings surge. My perma-bull status on SSTI was particularly hard to maintain the past three months but patience paid off. I added to my remaining position in the wake of the May selling, so I decided to take profits on this post-earnings move.
For the first time since I first started investing in SSTI, I have no position. It was a great run especially since I was able to ride on house’s money two times over. I will say more about ShotSpotter after I review the earnings report. I remain bullish and look forward to getting back to buying the dips.
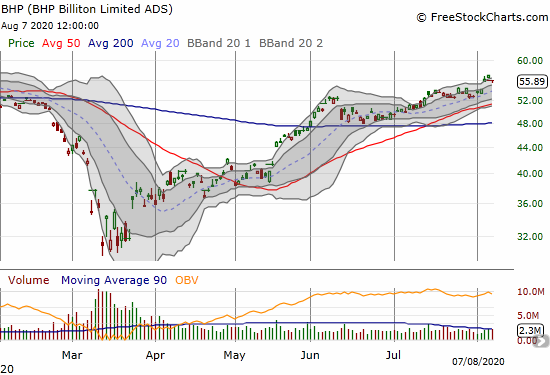
BHP Group Limited (BHP)
After a small pullback from July’s high, I thought I lost my opportunity to profit from my call options in BHP Group Limited (BHP). Last week’s surge to highs for 2020 gave me another profit-taking opportunity. Commodities remain a key play as the U.S. dollar (DXY) gets crushed. The dollar stabilized a bit last week and could drive a fresh dip to buy in commodity plays.
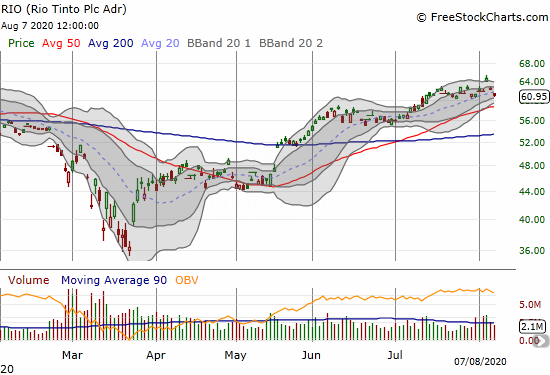
Rio Tinto Plc (RIO)
I sold my call options in Rio Tinto Plc (RIO) at the same time I sold my BHP call options. RIO pulled back sharply from that point, so I am already considering a new entry point. I believe RIO is suffering from company-specific factors including a mishap blowing up an ancient site of historical and cultural significance to Aboriginal peoples in Australia.
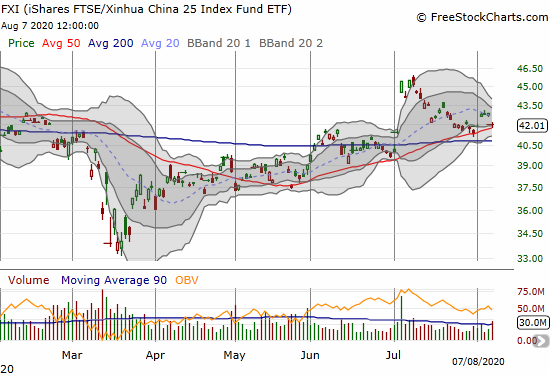
iShares FTSE Xinhua China (FXI)
OK. NOW I am truly done dabbling in Chinese stocks. The iShares FTSE Xinhua China (FXI) is still maintaining 50DMA support, but the economic war between the U.S. and China is simply too hot for comfort for me. I also think the stock market is not taking this escalating war seriously enough. The macro-economic risks weigh on my short-term trading call.
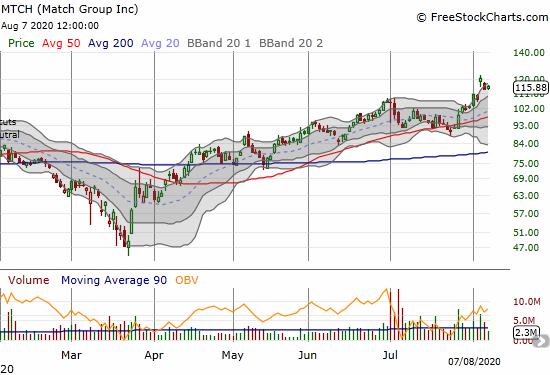
Match Group Inc (MTCH)
Match Group (MTCH) was one of the few short ideas I thought made sense even in the depths of the stock market crash. I bought put options as a small hedge against long positions. That moment was THE bottom in MTCH. MTCH gained 12.2% in one day last week to hit a fresh all-time high. I should have known better. People are not going to let a pandemic interfere with dating, love, and relationships. From last week’s earnings conference call (Seeking Alpha transcript):
“People are certainly adapting their dating behaviors to the pandemic and lockdowns, and based on the stories we’re hearing, some of the more popular dates these days are “walks in the park”, “picnics” and “backyard barbecue”. We’ve continued to hear more and more stories about super interesting video dates and even video and live streamed weddings which might become a trend.”
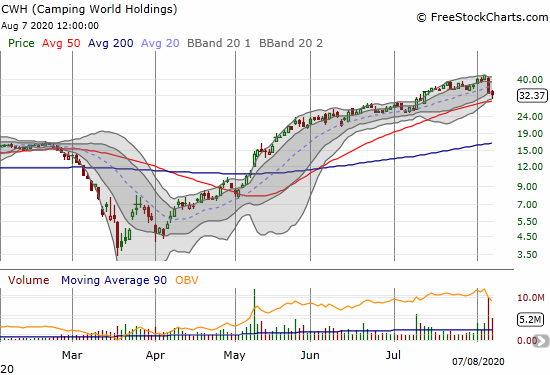
Camping World Holdings (CWH)
Ahead of earnings, Camping World Holdings (CWH) was trading over 10x its March low. In mid-July I explained I had more risk than reward continuing to hold a short put position. CWH surged even more into earnings and subsequently collapsed. I need to review Camping World Holdings earnings to decide whether it makes sense to remain bullish. CWH is part of the outdoors and alternative vacation theme so popular in this coronavirus, COVID-19 pandemic.
Stock Chart Spotlight – Bullish Breakout
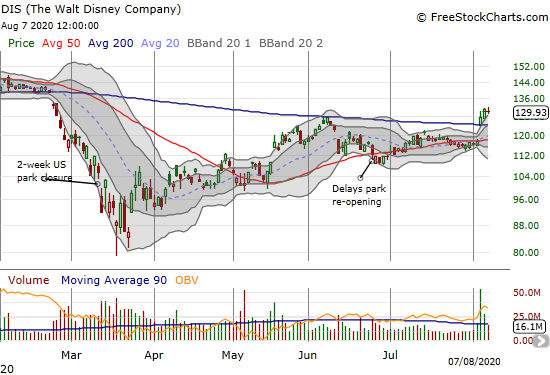
The Walt Disney Company (DIS)
The Walt Disney Company (DIS) surprised post earnings and delivered a solid 200DMA breakout. Buyers confirmed the breakout the next day. I am looking to buy back in on the very next dip.
— – —
FOLLOW Dr. Duru’s commentary on financial markets via email, StockTwits, Twitter, and even Instagram!
“Above the 40” uses the percentage of stocks trading above their respective 40-day moving averages (DMAs) to assess the technical health of the stock market and to identify extremes in market sentiment that are likely to reverse. Abbreviated as AT40, Above the 40 is an alternative label for “T2108” which was created by Worden. Learn more about T2108 on my T2108 Resource Page. AT200, or T2107, measures the percentage of stocks trading above their respective 200DMAs.
Active AT40 (T2108) periods: Day #82 over 20%, Day #76 over 30%, Day #21 over 40%, Day #17 over 50%, Day #3 over 60%, Day #1 over 70% (overbought)
Daily AT40 (T2108)
")
Black line: AT40 (T2108) (% measured on the right)
Red line: Overbought threshold (70%); Blue line: Oversold threshold (20%)
Weekly AT40 (T2108)

*All charts created using FreeStockCharts unless otherwise stated
The T2108 charts above are my LATEST updates independent of the date of this given AT40 post. For my latest AT40 post click here.
Be careful out there!
Full disclosure: long UVXY, long UPWK shares and short call
*Charting notes: FreeStockCharts stock prices are not adjusted for dividends. TradingView.com charts for currencies use Tokyo time as the start of the forex trading day. FreeStockCharts currency charts are based on Eastern U.S. time to define the trading day.
A note about WGO: fuel prices dominate the use costs of the “giant rolling home” RVs, and thus influence their resale value, and thus the demand for new ones. Those costs look to stay reasonably low for a time… but I think that time is at most a couple more years due to well-established oil price cyclicality.
One more reason RVs should be doing well!