
AT40 = 47.7% of stocks are trading above their respective 40-day moving averages (DMAs)
AT200 = 54.9% of stocks are trading above their respective 200DMAs
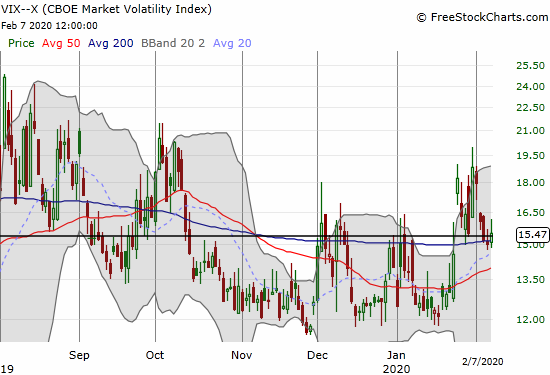
VIX = 15.5
Short-term Trading Call: bearish (from cautiously bearish)
Stock Market Commentary
The major indices managed to swing to all-time highs last week, but I still see signs of a topping pattern. In previous posts, I noted I would retreat from my cautiously bearish call if/once the S&P 500 reclaimed an all-time high. However, at the time I did not envision an all-time high occurring so quickly and with such a dramatic deviation in other indicators I watch. So instead of going to neutral, I downgraded my short-term trading call further to bearish.
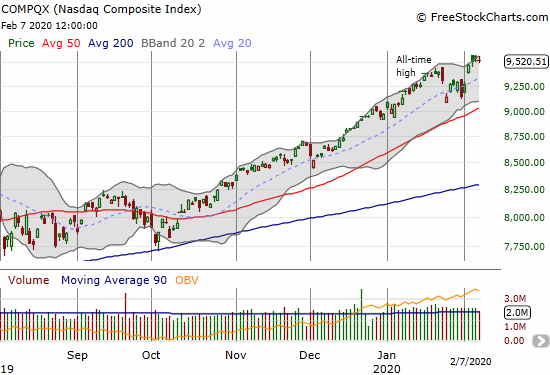
I expected the major indices to gap down last Monday and instead they gapped up and barely looked back from there until a small decline on Friday. The S&P 500 (SPY) was particularly impressive in rebounding sharply from going negative for the year and nearly testing its support at the uptrending 50DMA. On Friday, the S&P 500 (SPY) and the NASDAQ (COMPQX) each lost 0.5%.
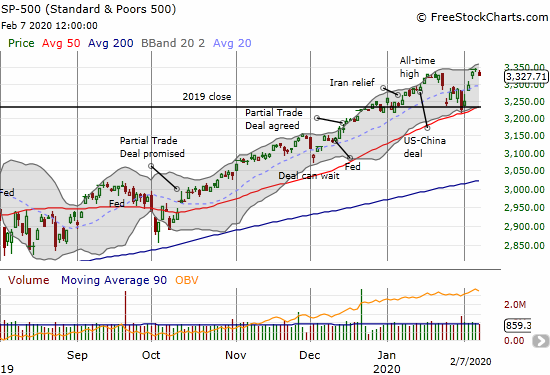
Friday’s small pullback looks completely harmless on the surface. Underneath, AT40 (T2108), the percentage of stocks trading above their respective 40-day moving averages (DMAs), failed to confirm the new upward momentum in the S&P 500. As the S&P 500 hit a marginal all-time high on Wednesday, AT40 closed at a mere 54.3%. The last all-time high occurred on January 17, 2020 with AT40 closing at 69.6% and pulling back from a 1-day overbought period (above 70%). In other words, the rebound in the major indices left behind a whole host of stocks. On the other hand, the rebound demonstrated that AT40 in the 30s remains “close enough” to oversold to warrant bullish speculation in these resilient indices.
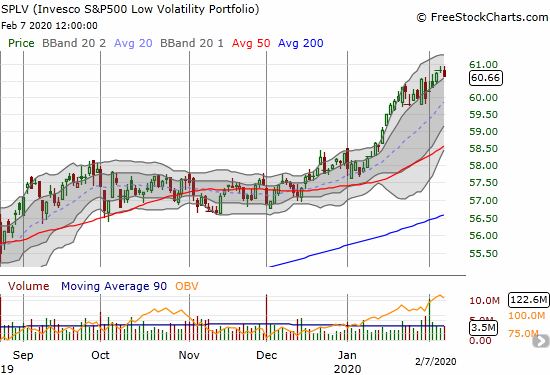
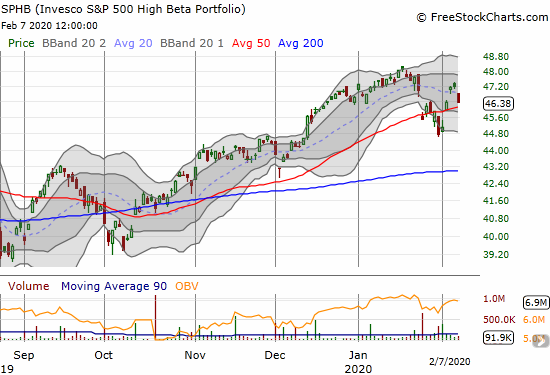
The deviation or dichotomy in the S&P 500 is on display between the Invesco S&P 500 Low Volatility ETF (SPLV) and the Invesco S&P 500 High Beta ETF (SPHB). The market is once again showing a preference for “safety” in the low volatility components of the S&P 500. The high beta components from SPHB failed to make a new all-time high last week and pulled back sharply on Friday. SPHB components are getting left behind. SPHB looks like it has topped out for now, and it will over time provide a drag on the S&P 500 (and presumably the NASDAQ as well).
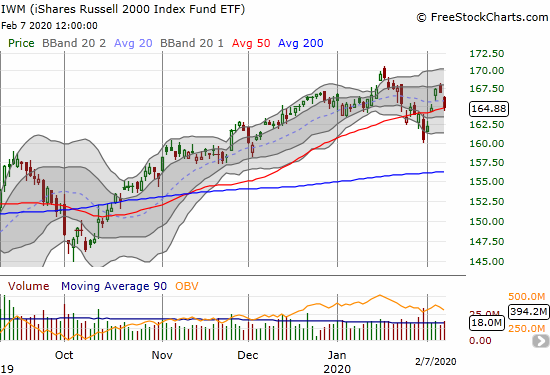
The rebound in the iShares Russell 2000 Index Fund ETF (IWM) was particularly impressive given it included a recovery from a bearish 50DMA breakdown. However, IWM also lost momentum a day ahead of the S&P 500. The index of small cap stocks returned to its 50DMA to close the week. I took profits on my IWM call options after the 50DMA breakout to make sure I netted out to a small loss with my bearish collection of options positioning on SPY and QQQ.
Volatility
The volatility index (VIX) dutifully continued to fall from the 20 level it hit intraday two Fridays ago. The 15.35 pivot held up as support so conditions are in place for the fear gauge to jump past 20 as I expect will happen eventually. If the VIX slices through the 15.35 pivot, then I will reset the clock on the cycle and look for 12 to provide approximate support again.
The Short-Term Trading Call
When I downgraded from neutral to cautiously bearish, I noted the many months my trading call sat at neutral. A reader was kind enough to give me a list of dates when I switched my trading call. I next labelled posts going back almost a year with changes in my trading call with the tag “trading call change.” I was last outright bearish in mid-April, 2019 just ahead of the big sell-off in May. Of course, I have no idea whether a similar sell-off lays ahead, but I am preparing for one. Ironically, the resilience of the stock market forced me to reluctantly flip neutral a week ahead of the final peak. Last year’s experiences helped motivate me to bias myself toward staying neutral (I hate churning the short-term trading call). I am looking to be a resilient as the stock market for this cycle.
“Resilience” in my trading call means I will be making very few bullish trades, and I will be inclined to fade rallies. I go into the current week looking for an entry point to add to my latest tranche of SPY puts and refresh a tranche of QQQ puts.
Stock Chart Reviews – Below the 50DMA
Caterpillar (CAT)
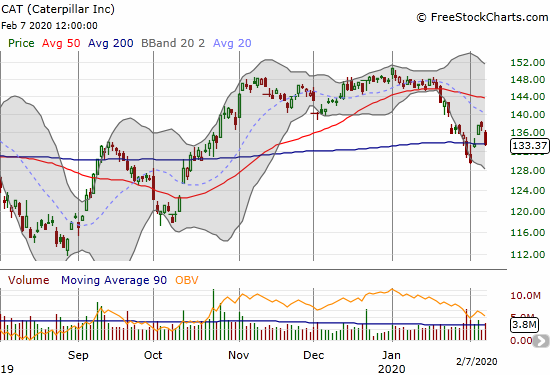
Caterpillar (CAT) participated in last week’s rally for two of the three days. I used the rally to buy put options: first when it closed at its 200DMA and then two days later. CAT closed at its 200DMA on Friday and looks poised to resume its breakdown from its 50DMA. If CAT rebounds from here, I will be much less inclined to jump into (more) SPY and QQQ puts just yet.
Aimmune Therapeutics (AIMT)
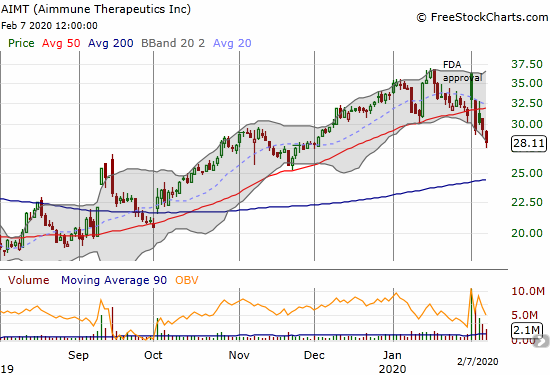
Aimmune Therapeutics (AIMT) promises to greatly improve the quality of life for people suffering from food allergies. I was excited to see the FDA approve Aimmune’s treatment for peanut allergies. I assumed this breakthrough would mark a sustained lift in the stock. Instead, sellers immediately jumped on the gap up and by the next day a 50DMA breakdown forced me to take profits. Clearly, something is “not quite right” – whether it is the company’s narrative or the interpretation of the market. I know the treatment is not a cure, but I think of this company as making progress in the right direction. I will be studying more closely in the coming days or weeks to understand whether the market is having one of its classic moments of inefficiency that opens up great upside potential. I definitely want to start buying again on a test of 200DMA support.
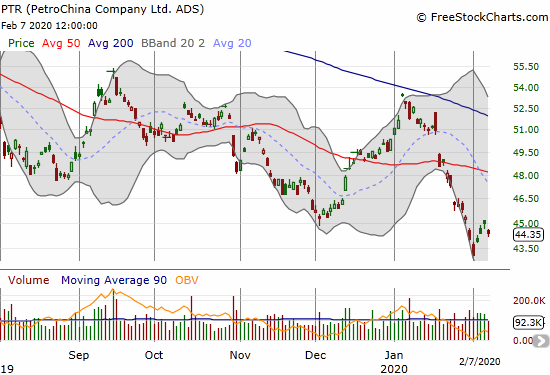
PetroChina Company Ltd (PTR)
PetroChina Company Ltd (PTR) is on an epic losing streak. I last looked at this chart years ago, so I was taken a bit aback when I realized PTR just hit a near 16-year low. Clearly, THIS is the stock to fade on the next rally in China-related stocks! The downward trending 200DMA is providing particularly stiff resistance.
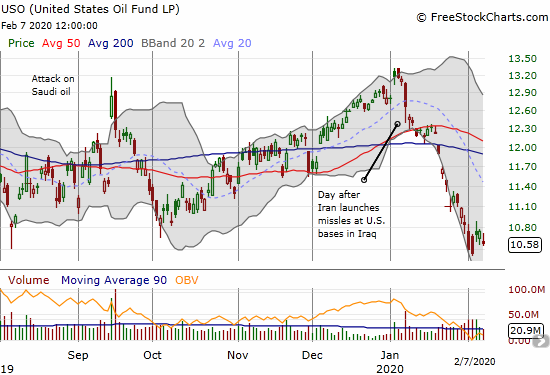
United States Oil Fund (USO)
Speaking of oil, the United States Oil Fund (USO) went nearly straight down in January. My contrarian play for 2020 got even MORE contrarian. I hit the reset button and bought some July $11.50 call options.
Stock Chart Reviews – Above the 50DMA
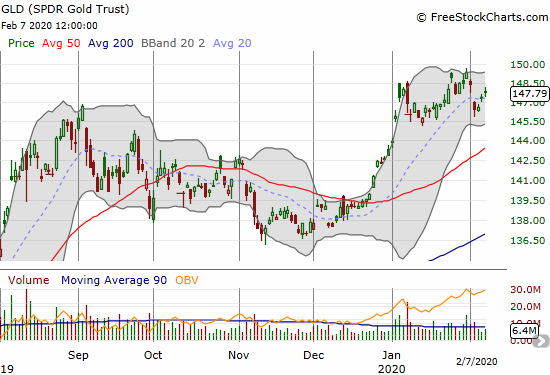
SPDR Gold Trust (GLD)
Last week I added another March $150 SPDR Gold Trust (GLD) call option to my core GLD shares. I will accumulate more calls throughout this month if they get cheaper (down to the uptrending 50DMA). In general, I am primed to get more aggressive on bullish bets on gold (which is an indirect bearish call on the stock market). I am looking for a momentous breakout above $150.
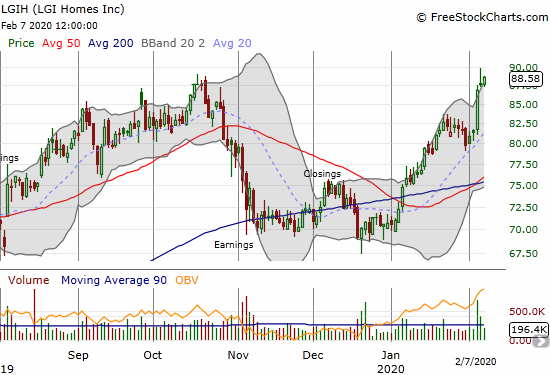
LGI Homes (LGIH)
LGI Homes (LGIH) burst out last week. I took profits on my shares the day after the outburst. The home builders will always be the corner of the market where I focus on buying opportunities. My monthly Housing Market Reviews and periodic review of earnings reports are the places to keep tabs on my positioning in the sector.
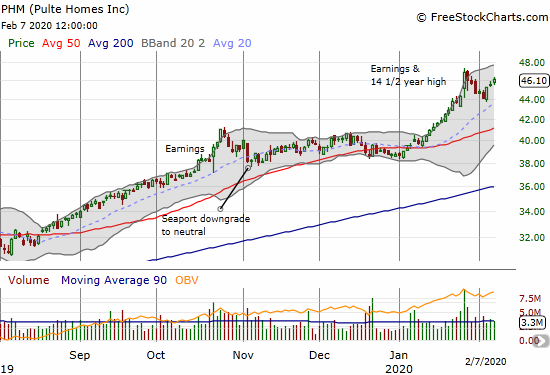
Pulte Homes (PHM)
Pulte Homes (PHM) managed to soar to a post-earning 14 1/2 year high, but sellers reversed all the gains over the next 5 trading days. I neglected to jump on the buying opportunity last week, but I now have PHM on my very small shopping list of buys.
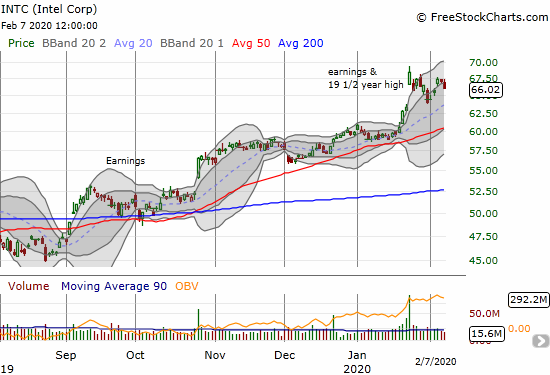
Intel (INTC)
I was trying to stay patient with my first between earnings trade on Intel (INTC), but the stock sharply rebounded from the near complete reversal of its post-earnings gains. I dipped my toe into April $70 calls last week. INTC is another small corner of the market where I focus on buying opportunities almost no matter the context.
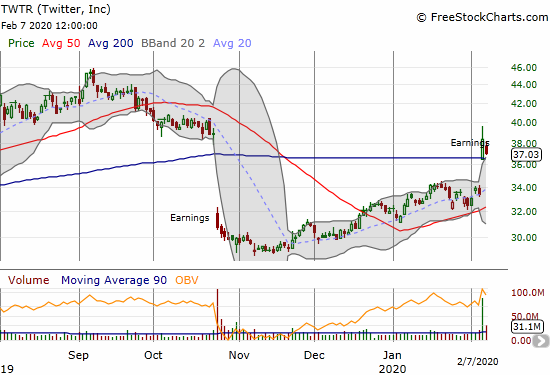
Twitter (TWTR)
Twitter (TWTR) is a long-term holding. Last week’s earnings rewarded my patience. However, I will be looking to sell call options against my position. I do not expect much more upside from here in the short-term.
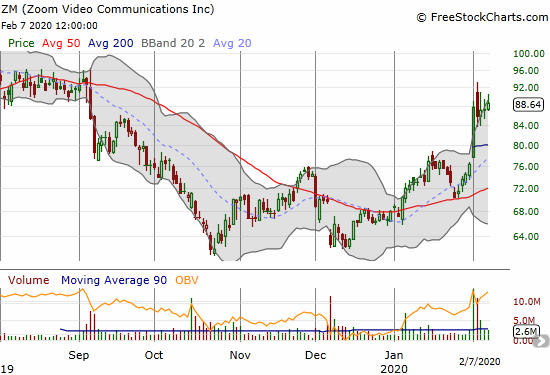
Zoom Technologies (ZM)
Zoom Technologies (ZM) broke out last week and looks like a buy on dips. I bought into the 50DMA breakout in early January with a small “no regrets” position. Unfortunately, I got too “cute” in selling those shares into the subsequent rally. I next missed the chance to buy right back in on the late January retest of 50DMA support. I call these mistakes the price I pay for leaning bearish on the stock market at this moment.
— – —
FOLLOW Dr. Duru’s commentary on financial markets via email, StockTwits, Twitter, and even Instagram!
“Above the 40” uses the percentage of stocks trading above their respective 40-day moving averages (DMAs) to assess the technical health of the stock market and to identify extremes in market sentiment that are likely to reverse. Abbreviated as AT40, Above the 40 is an alternative label for “T2108” which was created by Worden. Learn more about T2108 on my T2108 Resource Page. AT200, or T2107, measures the percentage of stocks trading above their respective 200DMAs.
Active AT40 (T2108) periods: Day #264 over 20%, Day #103 over 30%, Day #5 over 40% (overperiod), Day #10 under 50% (underperiod), Day #11 under 60%, Day #15 under 70%
Daily AT40 (T2108)
")
Black line: AT40 (T2108) (% measured on the right)
Red line: Overbought threshold (70%); Blue line: Oversold threshold (20%)
Weekly AT40 (T2108)

*All charts created using FreeStockCharts unless otherwise stated
The T2108 charts above are my LATEST updates independent of the date of this given AT40 post. For my latest AT40 post click here.
Be careful out there!
Full disclosure: long VIXY calls, long INTC calls, long CAT puts, long SPY puts, long TWTR, long GLD shares and calls, long USO calls
*Charting notes: FreeStockCharts stock prices are not adjusted for dividends. TradingView.com charts for currencies use Tokyo time as the start of the forex trading day. FreeStockCharts currency charts are based on Eastern U.S. time to define the trading day.