
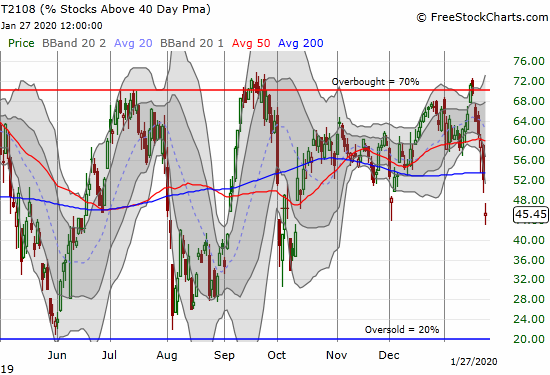
AT40 = 45.5% of stocks are trading above their respective 40-day moving averages (DMAs)
AT200 = 55.3% of stocks are trading above their respective 200DMAs
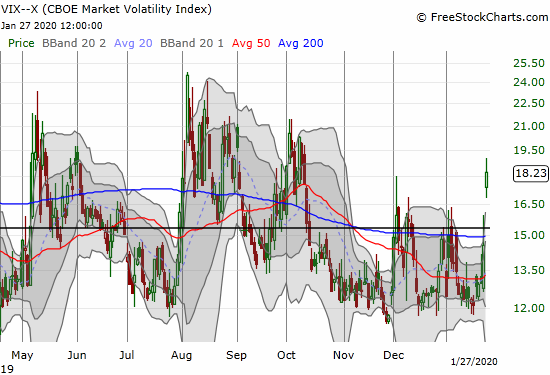
VIX = 18.2
Short-term Trading Call: cautiously bearish
Stock Market Commentary
I am so accustomed to the stock market’s resilience that I am already looking ahead to the rebound scenarios from the stock market’s current pullback. On Wednesday, the Federal Reserve will announce its latest pronunciations on monetary policy in the middle of a newly troubled market. The nervous Fed will thus be tempted to offer up salves to calm the nerves and start the healing. I am not expecting a surprise rate cut, but I fully expect the Fed to talk as dovishly as pssobile. If the Fed fails to save the day, I then fully expect the stock market to hurtle toward oversold conditions in a week or less. This tension that pivots around the Fed sits at the core of my dual, competing views of this stock market.
AT40 (T2108), the percentage of stocks trading above their respective 40-day moving averages (DMAs), best shows the steepness of the current sell-off. My favorite technical indicator plunged from overbought (over 70%) to 45.5% in just 6 days. AT40 closed at levels last seen as the stock market lifted out of its October blues. This kind of move represents what I like to call “quasi-oversold.” The swiftness and severity sets up the conditions for “bargain shoppers” to scoop up individual stocks that suddenly find themselves breaking down sharply toward and below critical points of support. A dovish Fed sparking into such kindling can ignite a sharp, even if short-lived, rally.
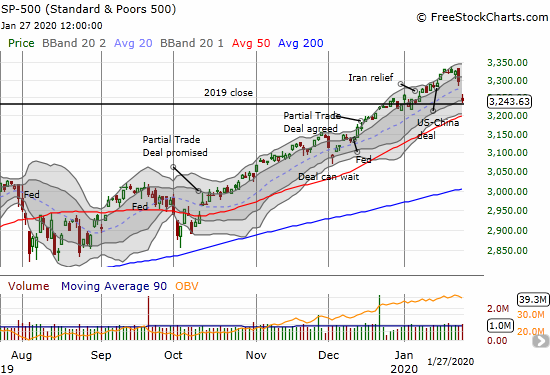
The S&P 500 (SPY) took a few days, but on Friday the index finally gave in to the pressures of a bearish divergence. Monday delivered the follow-through with a 1.6% loss that effectively wiped out the year-to-date gains for the S&P 500. It took three weeks to make it and just two days to sweep it away. SPY closed at $323.50, near its low of the day, and below my $326 bear/bull line.
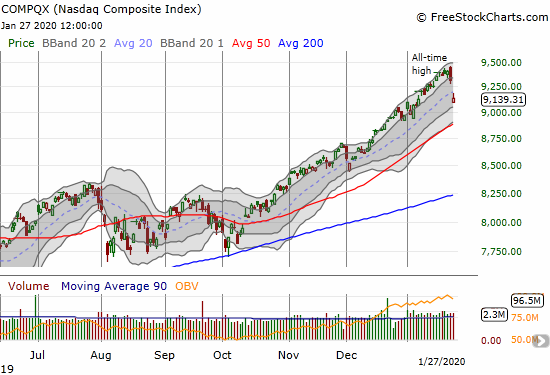
The NASDAQ (COMPQX) confirmed its bearish engulfing topping pattern. indicative of a top after an uptrend. The NASDAQ is still holding on to a 1.9% year-to-date gain. A complete reversal is in play along with a test of 50DMA support. This downside bias runs directly counter to the market’s rapid drop toward oversold conditions.
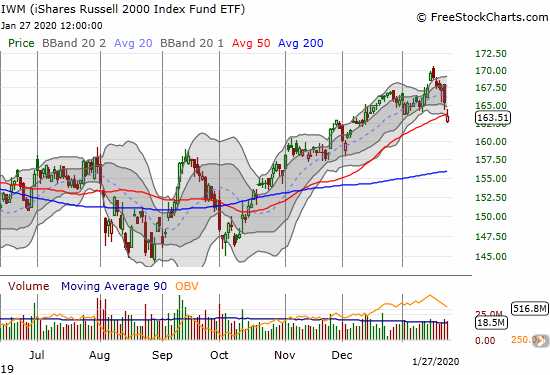
The iShares Russell 2000 Index Fund ETF (IWM) did the S&P 500 one better with a close at a 5-week low and a 50DMA breakdown. IWM’s last run-up now looks like an over-extended move in the rear-view mirror. If buyers fail to hold the line here, the next firm level of support is between $157.50 and $160, the location of the launch pad for November’s bullish breakout.
Volatility
The volatility index (VIX) is a perfect partner to AT40. The sharp, 25.2% 1-day gain is very extended. History says these kinds of surges are not sustainable. Even if the latest fear cycle takes the VIX even higher, it could easily pull back before gathering enough energy to hit 20 and above. Again, there is a bear/bull tension here with a stock market whose sentiment has turned abruptly and sharply fearful.
The Currency Market Speaks
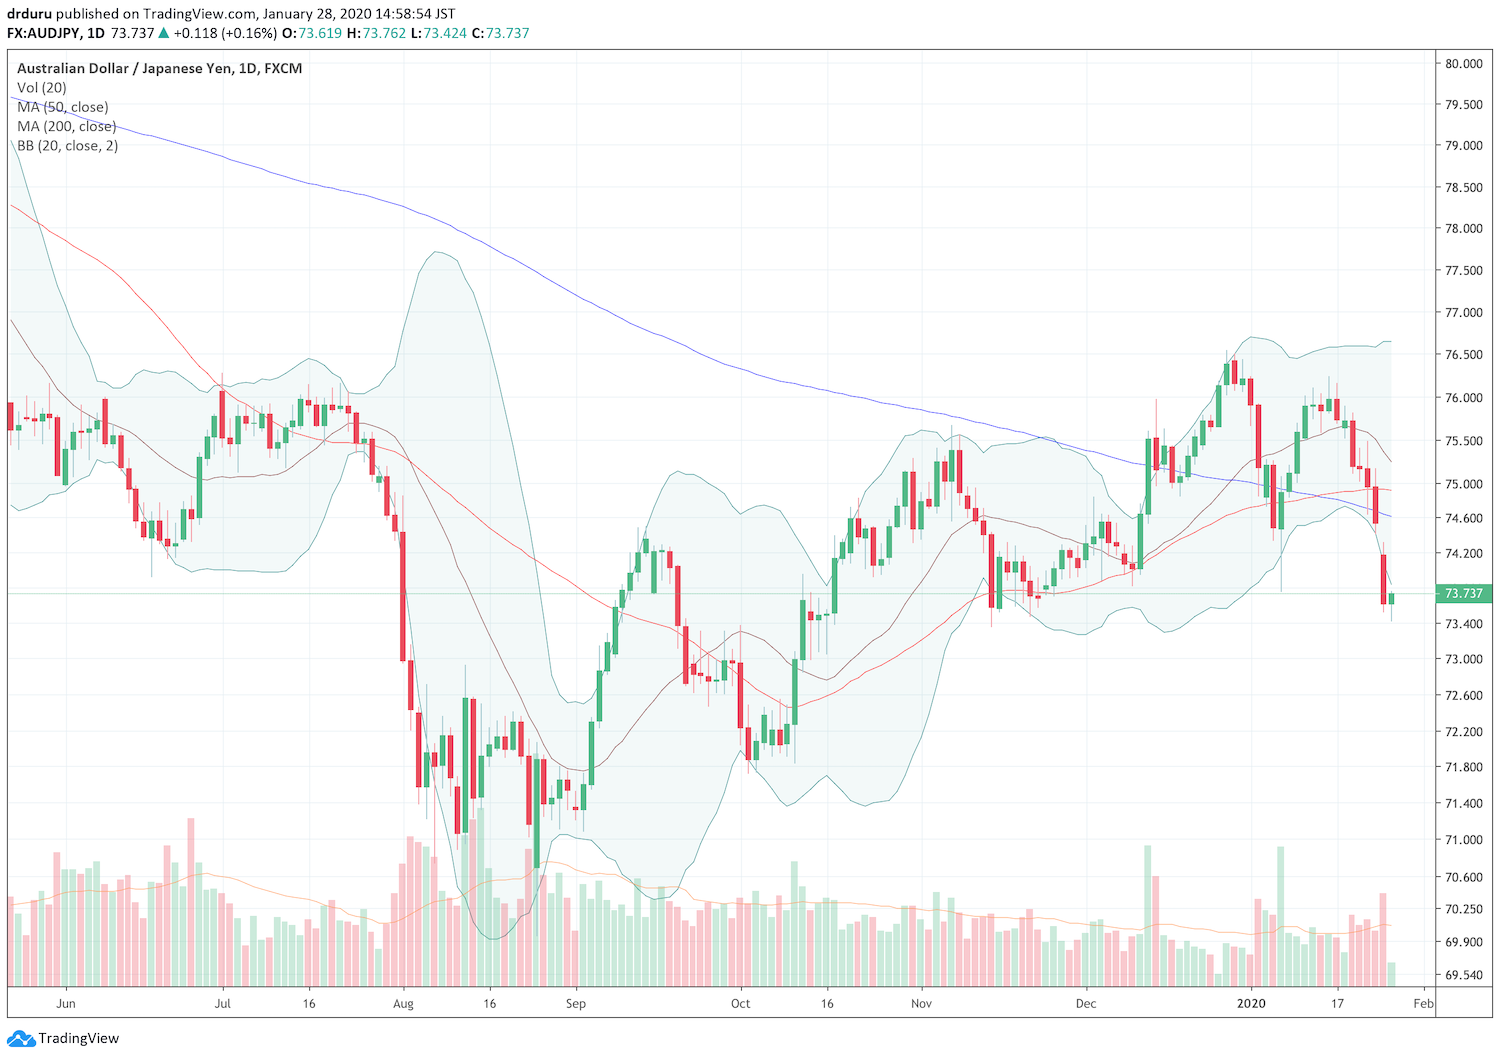
The Australian dollar (FXA) versus the Japanese yen (FXY) delivered as a reliable check of the market’s underlying risk sentiment. Now AUD/JPY looks like it is stabilizing. I am looking to AUD/JPY to help me resolve my assessments of the bear/bull tensions. Note well that a rebound in AUD/JPY will likely hit stiff resistance at the 50 and/or 200DMAs given the recent double false breakouts since December.
The Short-Term Trading Call
My trades on the day reflected the bear/bull tensions I see in the technicals. I expected buyers and volatility faders to put on their typical performance and rush into the gap. Soon after the open, I finished taking profits on my remaining put options. I next looked for buying opportunities. I added to my Tesla (TSLA) pre-earnings play. I bought a few IWM February call options (hoping for a quick rebound). I added to my Apple (AAPL) weekly calendar call spread (which also becomes a pre-earnings play). With the market still languishing, I decided I was over-weighted bullishly too early. Moreover, SPY was already trading below my $326 bear/bull line.
My final moves were bearish. I bought an SPY put calendar spread to use this week’s premium to help pay for going long February monthly puts. I “backstopped” the position with put options at a lower strike expiring on Wednesday. With my remaining (March) VIXY call options still so far out of the money, I bought some nearer dated February VIXY call options. I plan to add to these one more time on a VIX pullback and take profits quickly on an even higher surge.
My strategy for dual positioning will keep me rotating quickly through positions if possible.
Despite the tensions and the potential for the Fed to (try to) save the day, I downgraded my short-term trading call from neutral to cautiously bearish. The S&P 500’s drop below support, and the topping pattern in the NASDAQ tipped me into the downgrade. I will stay cautiously bearish until/unless AT40 flips oversold (goes below 20%) or the S&P 500 closes at a new all-time high…which I do not expect anytime soon.
Stock Chart Reviews – Below the 50DMA
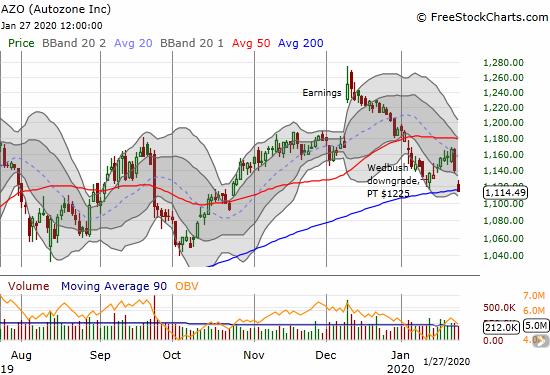
Autozone (AZO)
The chart says it all. My stubborn refresh on the Autozone (AZO) trade looks like a fresh bust in the making. AZO is going through a critical test of 200DMA support.
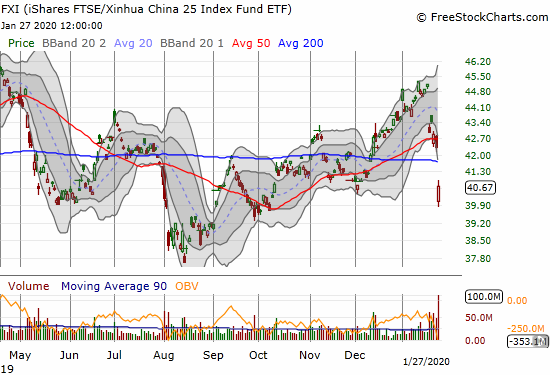
iShares FTSE/Xinhua China 25 Index Fund ETF (FXI)
Last week, watching the trade action in the iShares FTSE/Xinhua China 25 Index Fund ETF (FXI) made me wonder why the S&P 500 was so resilient. Today, the huge gap down and loss in FXI made me marvel that the U.S. stock market did not suffer bigger losses (China-related names DID suffer bigtime). FXI has suffered a lot of damage in quick order during a time Chinese markets are closed for the Lunar New Year. Look out for the Chinese government to come out of the holiday (extended by decree to deal with the outbreak of the corona virus) with the guns of monetary policy blazing away. I am hoping to nibble on some fresh China plays in time to benefit from such a move.
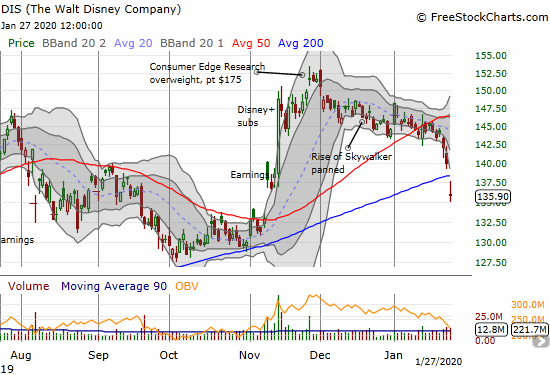
Disney (DIS)
I did not think I would get this chance to buy Disney (DIS) at these levels. With the stock gapping down well below its lower Bollinger Band (BB) and 200DMA, I bought a February call option. On further declines, I will start accumulating shares.
Stock Chart Reviews – Above the 50DMA
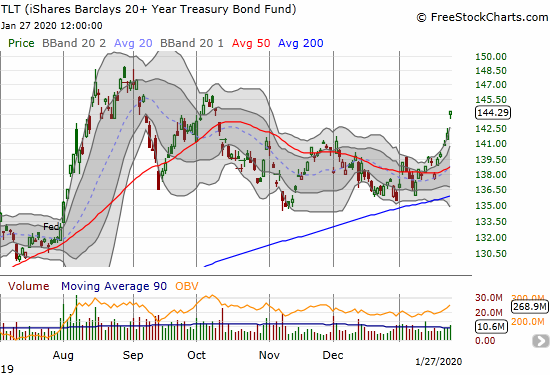
iShares Barclays 20+ Year Treasury Bond Fund (TLT)
I am glad I stubbornly stuck to my position that iShares Barclays 20+ Year Treasury Bond Fund (TLT) would go higher. The last 50DMA breakout was a another key tell for the shift in market sentiment. TLT has now gone parabolic and gapped up well above its upper Bollinger Band (BB). I used the surge to lock in profits on my call spread. I will buy the dips from here. I think of TLT, and bonds in general, as offering a much better risk-adjusted reward than the stock indices at this juncture. Central banks are hard-pressed to stoke inflation and are ever fearful of the next recession: this combination is a potent recipe for ever lower rates over time.
— – —
FOLLOW Dr. Duru’s commentary on financial markets via email, StockTwits, Twitter, and even Instagram!
“Above the 40” uses the percentage of stocks trading above their respective 40-day moving averages (DMAs) to assess the technical health of the stock market and to identify extremes in market sentiment that are likely to reverse. Abbreviated as AT40, Above the 40 is an alternative label for “T2108” which was created by Worden. Learn more about T2108 on my T2108 Resource Page. AT200, or T2107, measures the percentage of stocks trading above their respective 200DMAs.
Active AT40 (T2108) periods: Day #255 over 20%, Day #94 over 30%, Day #69 over 40%, Day #1 under 50% (underperiod ending 35 days over 50%), Day #2 under 60%, Day #6 under 70% (corrected from previous post)
Daily AT40 (T2108)
")
Black line: AT40 (T2108) (% measured on the right)
Red line: Overbought threshold (70%); Blue line: Oversold threshold (20%)
Weekly AT40 (T2108)

*All charts created using FreeStockCharts unless otherwise stated
The T2108 charts above are my LATEST updates independent of the date of this given AT40 post. For my latest AT40 post click here.
Be careful out there!
Full disclosure: long VIXY calls, long AZO call spread, long SPY puts and put calendar spread, long TSLA call spreads and calendar call spread and short shares, long DIS call, long IWM calls, long AAPL calendar call spreads
*Charting notes: FreeStockCharts stock prices are not adjusted for dividends. TradingView.com charts for currencies use Tokyo time as the start of the forex trading day. FreeStockCharts currency charts are based on Eastern U.S. time to define the trading day.