
AT40 = 49.7% of stocks are trading above their respective 40-day moving averages (DMAs)
AT200 = 48.1% of stocks are trading above their respective 200DMAs
VIX = 15.0
Short-term Trading Call: neutral
Stock Market Commentary
One Obvious Pattern to Another
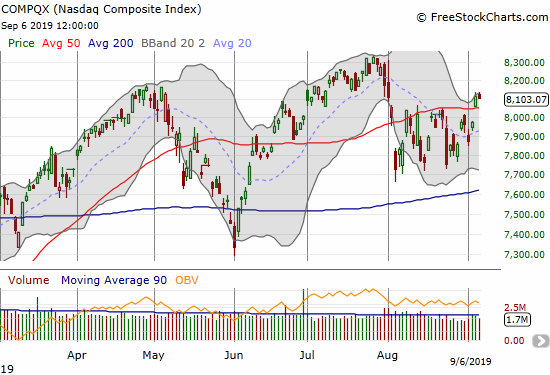
The S&P 500 (SPY) and the NASDAQ (COMPQX) transitioned from an obvious trading range to an obvious breakout. While the breakout has not yet received follow-through buying, the writing looks like it is on the wall for an imminent (marginal) new all-time high for the major indices.
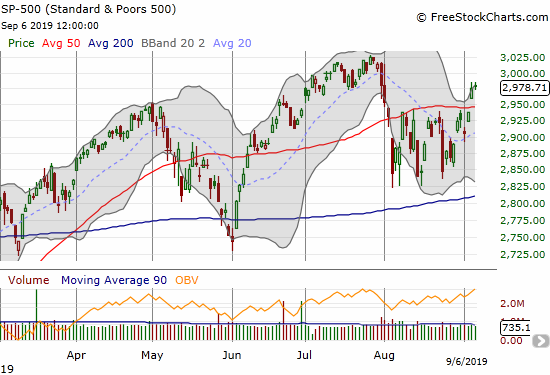
AT40 (T2108), the percentage of stocks trading above their respective 40DMAs, closed the week at 49.7%. My favorite technical indicator is now in a “neutral” zone and does not say much. I will be watching its behavior as it approaches the overbought threshold at 70%. Until then, my trading call stays at neutral as the total potential upside on the S&P 500 from current levels is not worth a switch. However, my bias will be to look for buying opportunities in stocks trading above their 50 and/or 200DMAs. I am also looking to load up on call options on SPY on dips until the next 50DMA breakdown.
The rest of the picture includes open questions
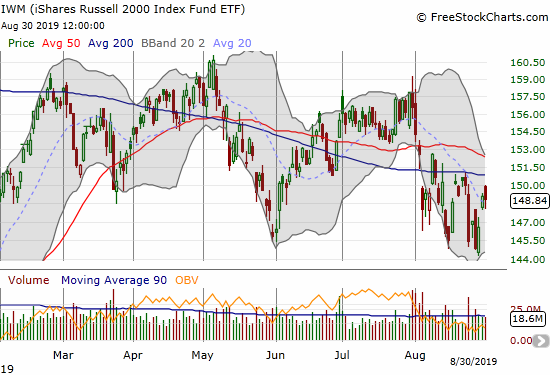
The iShares Russell 2000 Index Fund ETF (IWM) made a dramatic turnaround after the selling that began the holiday-shortened week. Yet, the index of small caps remains beneath both its 50 and 200DMAs while the S&P 500 (SPY) has left both behind. Until IWM breaks out, the freshly bullish stock market still has an open question. IWM will continue to look like a drag on the overall market outlook until it overcomes overhead resistance.
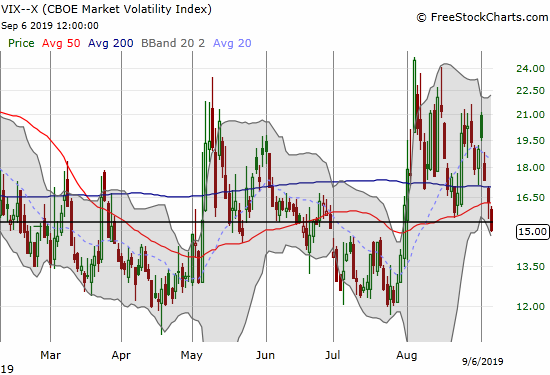
The volatility index (VIX) is flashing bullish signs after imploding from the intraday high of 21 last Tuesday. The VIX closed the week just below the 15.35 pivot point at 15. The fear gauge looks ready to ride this fresh round of complacency all the way to the July lows…and thus setup the next surge in fear.
The one big caveat and open question for bullish expectations ahead is September’s reputation for drawdowns. The average maximum drawdown for the S&P 500 in September since 1950 is 2.8%. It is the third worst month of the year. On a median basis, September is not as remarkable.
Stock Chart Reviews – Bearish
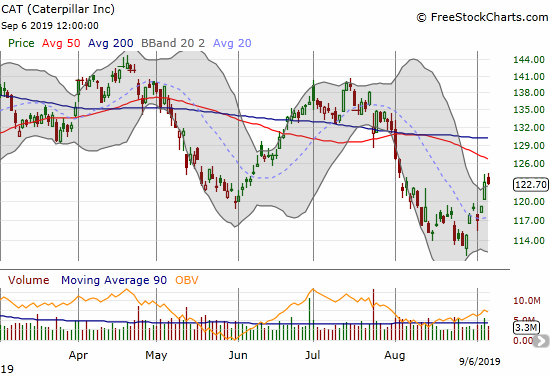
Caterpillar (CAT)
With hopes soaring again about the Trade War, Caterpillar (CAT) came back to life. CAT closed the week at a one-month high.
Stock Chart Reviews – Bullish
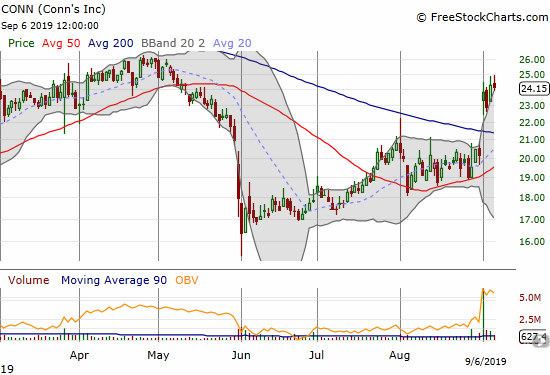
Conns Inc (CONN)
The market responded positively to Conns Inc (CONN) and its earnings report. CONN confirmed a clean 200DMA breakout which also confirmed support at the 50DMA. This stock is a buy on dips. With 36% of the float sold short, the upward momentum could continue through the next earnings report.
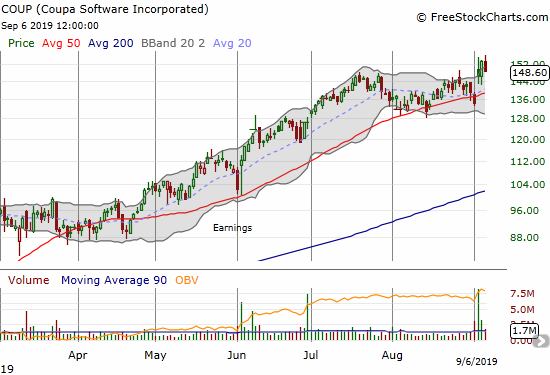
Coupa Software (COUP)
Coupa Software (COUP) looked like it was in a bit of trouble with a close below its 50DMA just ahead of earnings. The post-earnings gap up confirmed the upward momentum is well-intact.
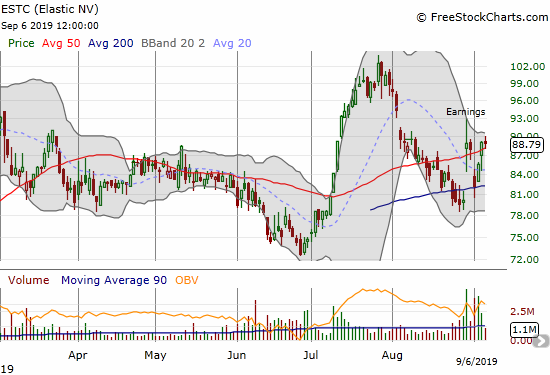
Elastic N V (ESTC)
After a positive post-earnings gap up, Elastic N V (ESTC) suffered a mysterious gap down to 200DMA support. The stock market was under pressure that day, but the drop by ESTC looked excessive given the positive earnings. Although I had ESTC on my buy list, I decided to wait things out. Now ESTC is back above its 50DMA and looks like a firmer buy.
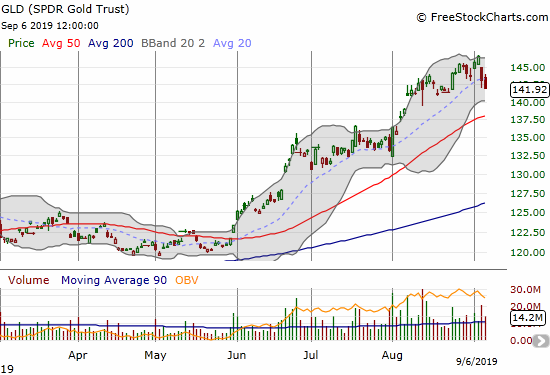
SPDR Gold Trust (GLD)
With good cheer spreading across the market, gold is naturally losing some of its shine. SPDR Gold Trust (GLD) pulled back and closed below its uptrending 20DMA for the first time since July and even that close was marginal. The primary uptrend looks done with the early August gap up now in play for a fill. A true test of the uptrend will likely come with a challenge of the 50DMA.
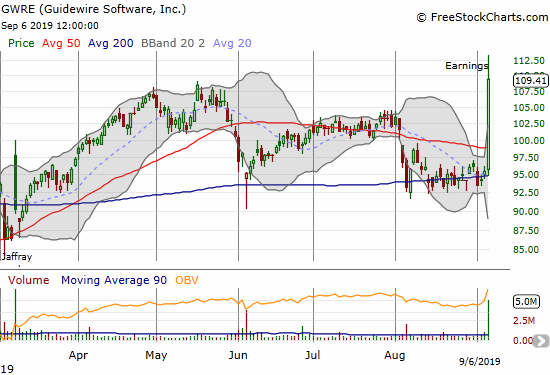
Guidewire Software (GWRE)
Back in March I stuck to my guns on Guidewire Software (GWRE) after a Piper Jaffray downgrade helped knock the stock into a 200DMA breakdown and challenge of 50DMA support. The stock proceeded to rally from there, but Friday’s monster (and surprise) post-earnings pop was an even more resounding vindication. While I did not add to my position on the earlier dips, going forward, GWRE becomes a buy on the dips.
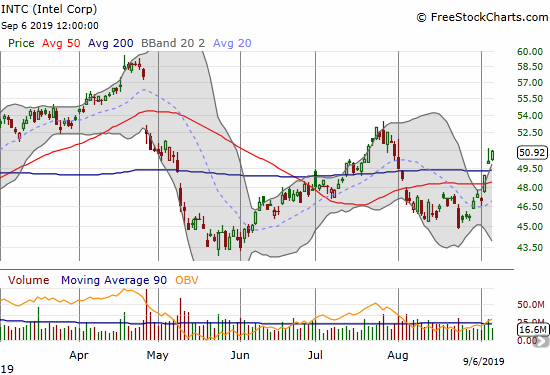
Intel (INTC)
My between-earnings play on Intel (INTC) worked out this cycle. I sold my tranche of call options into the trade well above the upper Bollinger Band (BB) on the 200DMA breakout. I also covered short puts. INTC is at the top of my list for the next market pullback.
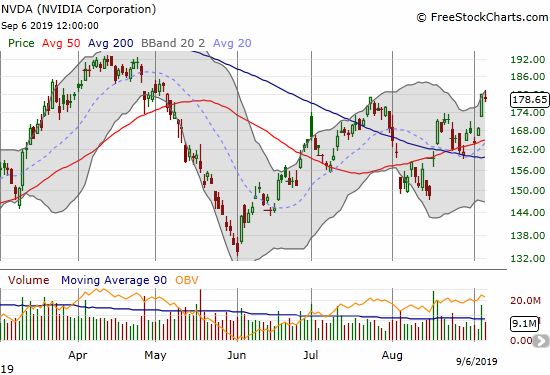
Nvidia (NVDA)
As I mentioned in an earlier Above the 40 post, I was eyeing Nvidia (NVDA) for a buy on any sign of good market news. The renewed cheer over the Trade War qualifies. I bought shares in the middle of Thursday’s surge, and I plan to just hold those shares. I like adding call options on dips back to 50 or 200DMA support.
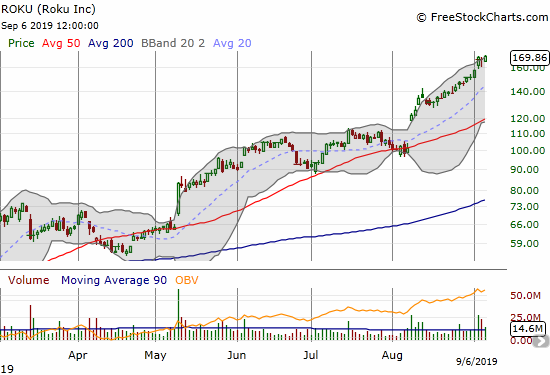
Roku (ROKU)
Roku (ROKU) is a huge miss. The stock is on a monster run. A regular reader pointed out Roku to me as a major buy back in May, but at the time I was busy trying extricate myself from a hedged position short shares, long calls strategy. I bought into the August breakout but did not get a long enough dated tranche of call options. At this point, all I can do is watch in case a decent entry point appears. However, a test of even 20DMA support looks like it will be far off in the distance.
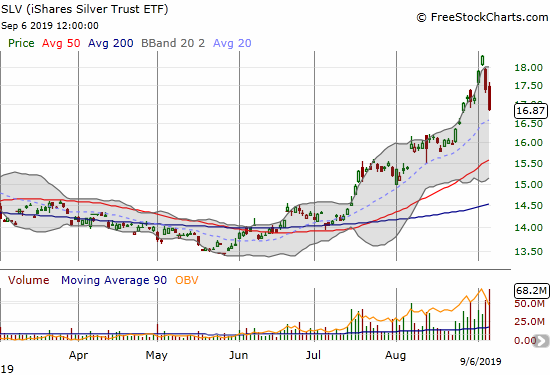
iShares Silver Trust ETF (SLV)
The iShares Silver Trust ETF (SLV) suffered an even sharper pullback than GLD. SLV also looks like a true top with an abandoned baby top looming overhead. An abandoned baby top occurs at the end of an uptrend and represents something like the climax of a buying panic. A gain after a gap up is followed by a loss on a gap down with the entire range (and the buyers) of the up day left on an “island”. That is, the price range of the prior and following day do not overlap.
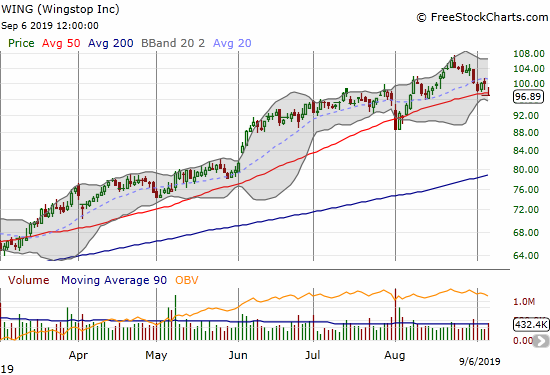
Wingstop (WING)
I talk about “the chicken trade“, but I often forget to check out Wingstop (WING). The stock still has 17% of its shares sold short which means major pain for bears given the 52.8% year-to-date gain.
— – —
FOLLOW Dr. Duru’s commentary on financial markets via email, StockTwits, Twitter, and even Instagram!
“Above the 40” uses the percentage of stocks trading above their respective 40-day moving averages (DMAs) to assess the technical health of the stock market and to identify extremes in market sentiment that are likely to reverse. Abbreviated as AT40, Above the 40 is an alternative label for “T2108” which was created by Worden. Learn more about T2108 on my T2108 Resource Page. AT200, or T2107, measures the percentage of stocks trading above their respective 200DMAs.
Active AT40 (T2108) periods: Day #165 over 20%, Day #4 over 30% (overperiod), Day #16 under 40%, Day #23 under 50%, Day #32 under 60%, Day #122 under 70%
Daily AT40 (T2108)
")
Black line: AT40 (T2108) (% measured on the right)
Red line: Overbought threshold (70%); Blue line: Oversold threshold (20%)
Weekly AT40 (T2108)

*All charts created using FreeStockCharts unless otherwise stated
The T2108 charts above are my LATEST updates independent of the date of this given AT40 post. For my latest AT40 post click here.
Be careful out there!
Full disclosure: long VIXY calls, long CAT put spread and puts, long GLD, long SLV, long GWRE, long NVDA
*Charting notes: FreeStockCharts stock prices are not adjusted for dividends. TradingView.com charts for currencies use Tokyo time as the start of the forex trading day. FreeStockCharts currency charts are based on Eastern U.S. time to define the trading day.