
AT40 = 33.1% of stocks are trading above their respective 40-day moving averages (DMAs)
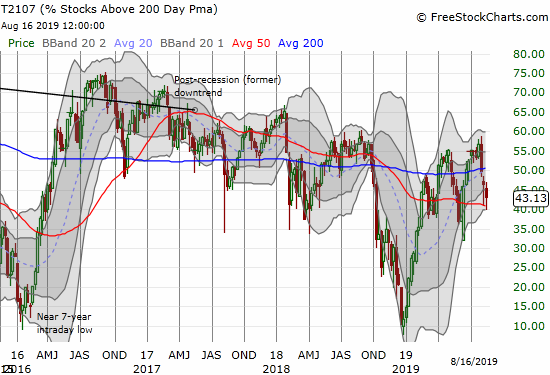
AT200 = 43.1% of stocks are trading above their respective 200DMAs (2-month low)
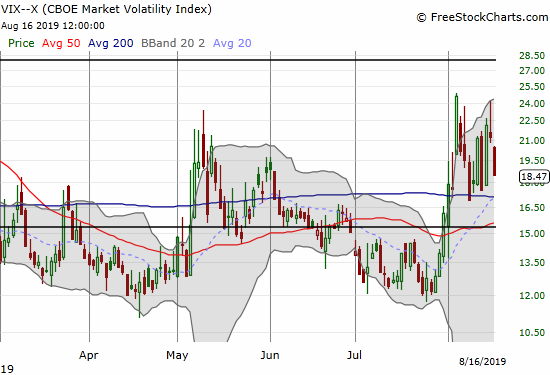
VIX = 18.5
Short-term Trading Call: cautiously bullish (from neutral)
Stock Market Commentary
The extreme of August held as support…just barely.
Sneaky Resilience
The S&P 500 (SPY) gapped up 1.4% but ended the week down. Along the way, the index suffered a massive gap down on Wednesday which is still healing.
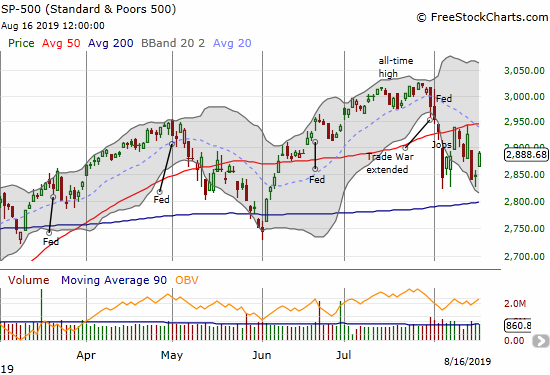
The sellers tried but failed to push the index into a test of support at the 200-day moving average (DMA). This failure means that a fresh 50DMA breakout will likely be very bullish for the S&P 500 (SPY). I want to buy that breakout for a run to a new marginal all-time high.
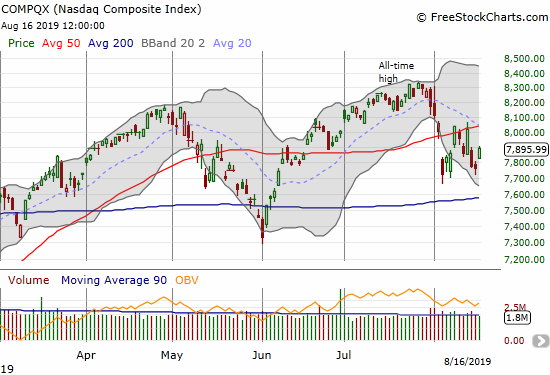
The NASDAQ (COMPQX) almost followed a similar pattern except the intraday lows of this month have marked a notable set of higher lows. The NASDAQ also seemed to clear a decent hammer bottoming pattern formed on Thursday. Like the S&P 500, I want to buy the NASDAQ on a 50DMA breakout.
A 50DMA breakout would be a clear buy signal, but I do not want to wait until that milestone. The market is already flashing a sufficient number of constructive signals. As I noted in my last Above the 40 post, only the longer-term signal of AT200 (T2107), the percentage of stocks trading above their respective 200DMAs, prevented me from staking a claim on a bullish divergence. AT200 experienced a healthy bounce to 43.1% to close the week and gave me more confidence. AT40 (T2108), the percentage of stocks trading above their respective 40DMAs, sealed the deal by crossing into the 30% overperiod by ending the week at 33.1%. The clear stop-loss on both indices is below the recent lows and/or below their 200DMAs.
The 401K Stock Market
The President himself flashed an important signal on Friday. During a campaign rally he told his fans that without him as President their 401Ks will go down the tubes. (A 401K is a retirement account used for tax-advantaged investing). The President boasted love him or hate him, everyone needs him. (The video below should start at the 14:36 mark).
Melodrama aside, I use my financial filter on this posturing to conclude the President has made a campaign promise to prop up the stock market until at least the election. I will now call this stock market “the 401K market.” The task for sellers and bears is monumental given the White House AND the Federal Reserve have core missions to support the stock market. The looming top I see for the stock market seems like a 2020/2021 timeline (an eternity for trading!). Of course success by the government is not guaranteed, but I do not want to get overly bearish under such conditions, and I want to bias my thinking toward reasons to buy.
Accordingly, my short-term trading call flipped from neutral to cautiously bullish. I am holding onto existing put options as partial hedges, but I will be more focused on buying dips. Even if 200DMA supports give way soon, such a breakdown should send the market into oversold trading conditions (AT40 below 20%). Oversold conditions will create fresh buying opportunities.
The longer-range reason for caution
Note well that I am not projecting spectacular gains ahead. Instead, I think we are likely to get more of the same as before: incremental new all-time highs for the S&P 500 (SPY) punctuated by sharp bouts of selling. My rules for identifying selling points all stand; I hope these rules are strong enough to prevent me from getting overly comfortable with any subsequent rallies. I also fully acknowledge this stock market lacks underlying momentum. AT200 says everything we need to know: it peaked in September, 2016 and has trended downward ever since.
Small caps and financials languishing
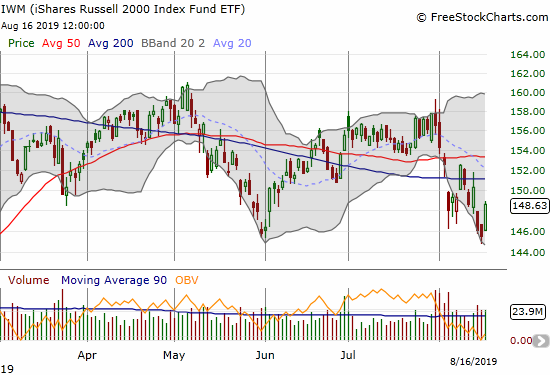
Small-caps are one source of under-performance. They are in much worse shape (again) than the S&P 500. The iShares Russell 2000 Index Fund ETF (IWM) has struggled since a marginal new high for the year in May. The declining 200DMA has acted like a weight around IWM’s ankles. Unlike the S&P 500 and the NASDAQ, IWM has spent most of this year trading under its 200DMA. This behavior is overall bearish action occasionally punctuated with hopeful rallies. The latest hope is a quick recovery from sliding past the May low. IWM serves as a reminder of some of the longer-term underlying weakness in the stock market.
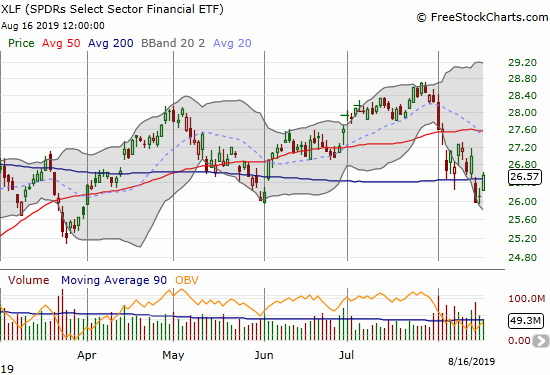
Financials have also lagged. XLF just barely recovered from its latest 200DMA breakdown. Unlike the S&P 500 and the NASDAQ, I am NOT interested in buying a 50DMA breakout on XLF, and I am definitely not interest in any pre-emptive buys.
Volatility Chop
The volatility index (VIX) continues to chop around. A more sustained rally in the stock market should follow a breakdown below the range (or at least a confirmation of support). A breakout from this range should represent a major buying opportunity for stocks.
Stock Chart Reviews – Bearish
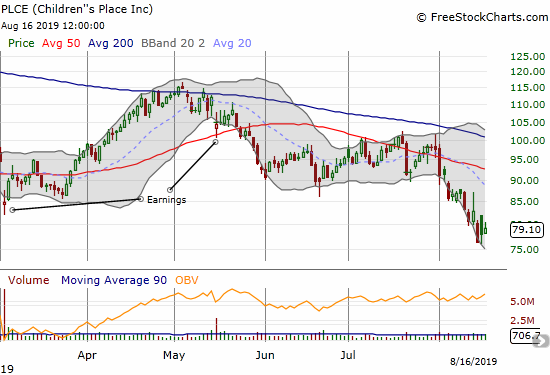
Children’s Place (PLCE)
August has been a breakdown month for Children’s Place (PLCE). Earnings are coming before the market opens on August 21st. I will be watching carefully. When a stock breaks down and sells off going into earnings, I expect bad news…
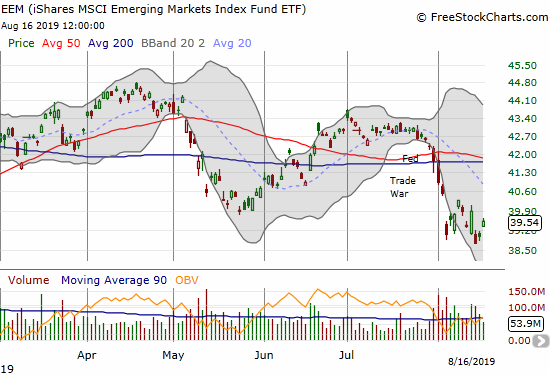
iShares MSCI Emerging Markets Index Fund ETF (EEM)
I am in accumulation mode on put options on the iShares MSCI Emerging Markets Index Fund ETF (EEM). I was tempted to take profits in Wednesday’s big gap down, but I decided to hold. Instead, I added to Best Buy (BBY) call options to continue the Trade War pairs trade (see below).
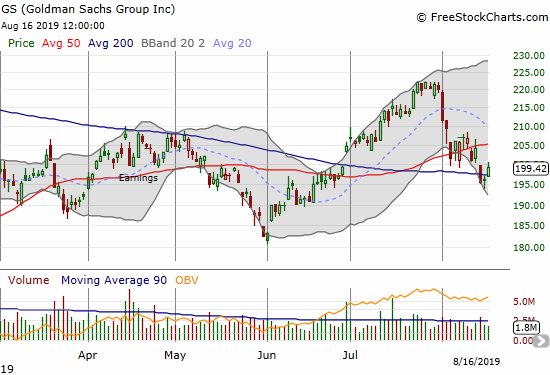
Goldman Sachs (GS)
On Thursday, I bought an August 30 $190 put on Goldman Sachs (GS) in anticipation of a continued 200DMA breakdown. Friday’s additional buying makes that scenario unlikely, but I like holding an out of the money put on GS as a hedge on my bullishness.
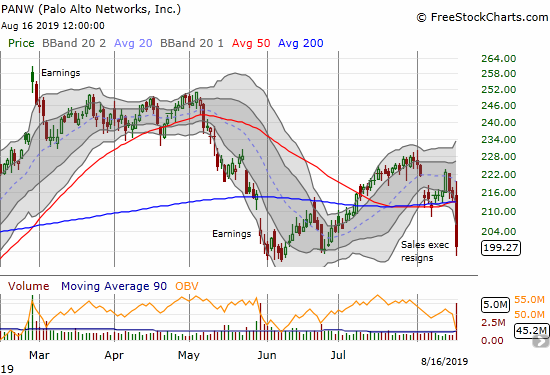
Palo Alto Networks (PANW)
I am surprised the departure of a Sales VP could cause tumult for the shares of Palo Alto Networks (PANW). While the 7.2% loss and breakdown is bearish for the stock, I think the depth of the selling is a classic over-extension in a jittery market. I am looking to buy for a relief rally back to converged resistance from the 50/200DMAs. The May/June lows provide an easy stop-loss.
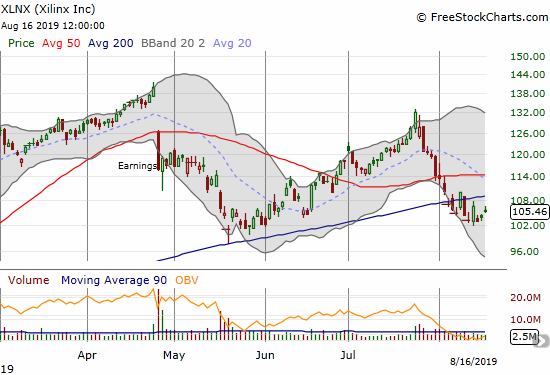
Xilinx (XLNX)
Xilinx (XLNX) turned into a great buy and trade following the sell-off from April earnings. The 200DMA held as picture-perfect support. The stock was not so luck following July earnings. Unlike the last round, I am NOT interested in buying XLNX into this selling. I want to see a fresh 200 or even 50DMA breakout before getting interested again.
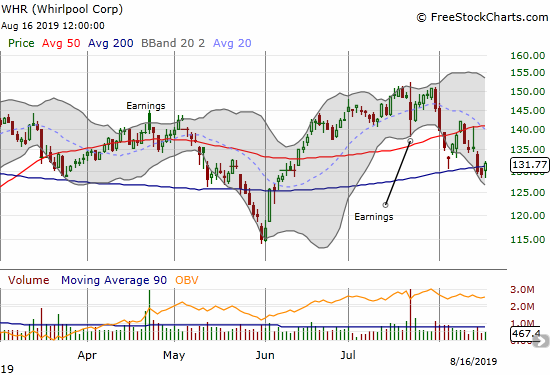
Whirlpool (WHR)
On Wednesday and Thursday, Whirlpool (WHR) looked like a clear short. Friday’s tentative buying made me pause. The stock is a clear short below last week’s low with a downside target at the May low.
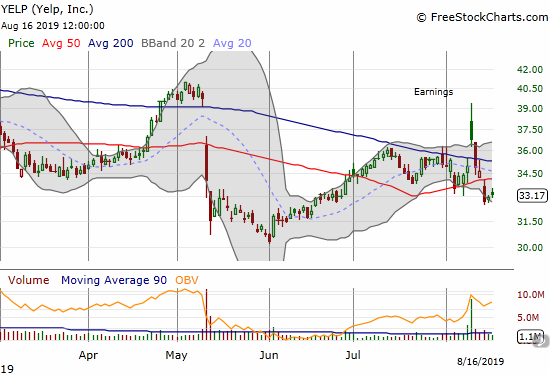
Yelp (YELP)
I went into earnings for Yelp (YELP) with a call spread. I failed to take profits into the gap up and proceeded to watch as sellers quickly faded the stock into a 200 and then a 50DMA breakdown. Along the way I kept expecting a rebound and instead the stock now looks ready to test the lows from May.
Stock Chart Reviews – Bullish
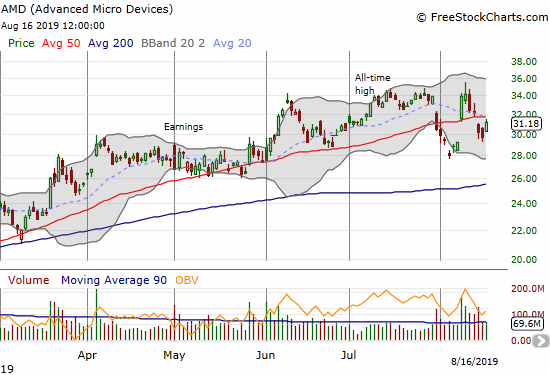
Advanced Micro Devices (AMD)
Advanced Micro Devices (AMD) almost erased all its gains from the big pop on product news. I used the pullback as an opportunity to accumulate Aug 30 $33 call options (I did not even think this opportunity would present itself). AMD remains one of the more bullish charts out there, especially in semiconductors and tech.
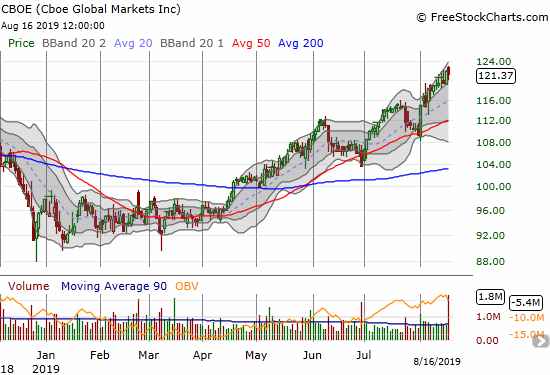
CBOE (Cboe Global Markets)
Four months ago, I mentioned Cboe Global Markets (CBOE) as it broke out from 200DMA resistance. I added to my position as an on-going play on market volatility. Since then. volatility has indeed increased and CBOE now trades at a 17-month high. Trades like these are powerful reminders of the importance of breakouts, particularly after a period of consolidation.
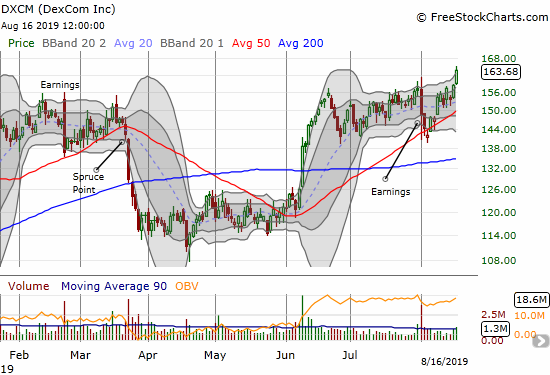
DexCom (DXCM)
I perfectly mistimed my trade on DexCom (DXCM) by buying call options right after the June peak. That failure helped to blind me to the post-earnings test of 50DMA support. Now I am position-less with the stock breaking out to a new all-time high. This breakout confirms to me that “something is up” with this stock. This week I plan to make a more bullish bet that can sustain through more churn: for example, a long-dated call spread, calendar call spread, and/or shares.
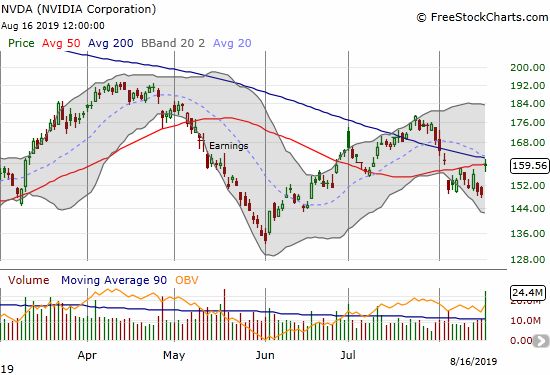
NVIDIA (NVDA)
NVIDIA (NVDA) is a borderline bullish bet. I like how Friday’s post-earnings pop cleared the previous congestion below the 50DMA, but I do not like how it stopped cold under 200DMA resistance and at 50DMA resistance. The stock is not a buy for me until it clears the 200DMA hurdle. The stock obviously returns to the bearish bucket if it violates August’s lows.
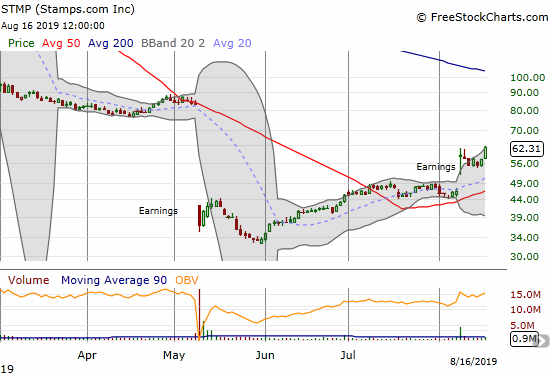
Stamps.com (STMP)
Stamps.com (STMP) is making the recovery I did not think possible. I was eyeing STMP like a hawk all week. Friday’s open gave me the buy signal: a breakout from a brief post-earnings consolidation. I was too tentative and set my limit order too low. I missed the entire 8.5% gain on Friday. Still, STMP is now a buy on the dips.
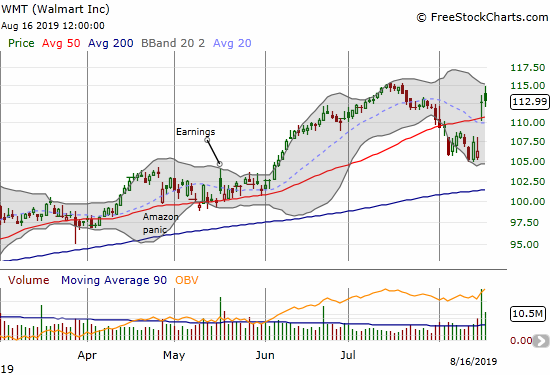
Walmart (WMT)
Walmart (WMT) is bullish, but is only a buy on the dips. I am warily eyeing how it behaves around and near its all-time high set last month.
— – —
FOLLOW Dr. Duru’s commentary on financial markets via email, StockTwits, Twitter, and even Instagram!
“Above the 40” uses the percentage of stocks trading above their respective 40-day moving averages (DMAs) to assess the technical health of the stock market and to identify extremes in market sentiment that are likely to reverse. Abbreviated as AT40, Above the 40 is an alternative label for “T2108” which was created by Worden. Learn more about T2108 on my T2108 Resource Page. AT200, or T2107, measures the percentage of stocks trading above their respective 200DMAs.
Active AT40 (T2108) periods: Day #155 over 20%, Day #1 over 30% (overperiod ending 2 days under 30%), Day #6 under 40% (underperiod), Day #13 under 50%, Day #22 under 60%, Day #112 under 70%
Daily AT40 (T2108)
")
Black line: AT40 (T2108) (% measured on the right)
Red line: Overbought threshold (70%); Blue line: Oversold threshold (20%)
Weekly AT40 (T2108)

*All charts created using FreeStockCharts unless otherwise stated
The T2108 charts above are my LATEST updates independent of the date of this given AT40 post. For my latest AT40 post click here.
Be careful out there!
Full disclosure: long UVXY call, long GS put, long CBOE, long BBY calls, long EEM puts, long AMD calls,
*Charting notes: FreeStockCharts stock prices are not adjusted for dividends. TradingView.com charts for currencies use Tokyo time as the start of the forex trading day. FreeStockCharts currency charts are based on Eastern U.S. time to define the trading day.
Trump may believe he can control the stock market. I believe he can move it for a day or two, but that’s all – and that power is waning as his credibility on related topics wanes, in particular as nothing positive is achieved by his tariffs.
In 2009, what reversed the stock market from free-fall was the House of Representatives, first passing the $750B bailout and then the $900B stimulus. These are not things a president can force. Consider the tricks he had to use to spend a “mere” $5B on a wall.
I am less trying to imagine what he can physically do versus what kind of jawboning he might be able to do to keep hopes alive. Combined with the power of the Fed, I think the market could be propped up quite nicely for another year or so. As I noted, I am not concluding these efforts have to be successful, but I am playing the odds to the upside on this one. I don’t want to find the combined forces of the government even with a non-compliant House of Representatives.