
AT40 = 23.8% of stocks are trading above their respective 40-day moving averages (DMAs) (hit a low of 20.7%)
AT200 = 36.9% of stocks are trading above their respective 200DMAs (2 1/2 month low)
VIX = 18.7
Short-term Trading Call: neutral
Stock Market Commentary
So much for the potential for follow-through on bullish divergence!
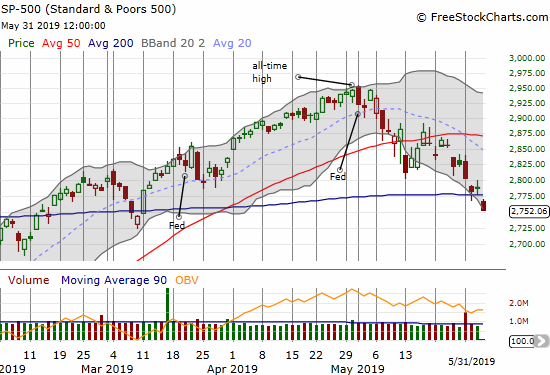
Perhaps the failure is poetic in placing bookends on the month of May. The stock market started the month with a lot of faith it could continue to push through bearish divergence. At the time, I lamented waffling on my trading call with a neutral. With the S&P 500 (SPY) down 6.7% since then, including Friday’s critical breakdown southward below critical trend lines, my lament has transformed into introspection. I had two chances to return to at least a “cautiously bearish” trading call: the breakdown from the primary uptrend defined by the 20-day moving average (DMA) and then the 50DMA breakdown. At least the new all-time high in the S&P 500 did not turn me bullish.
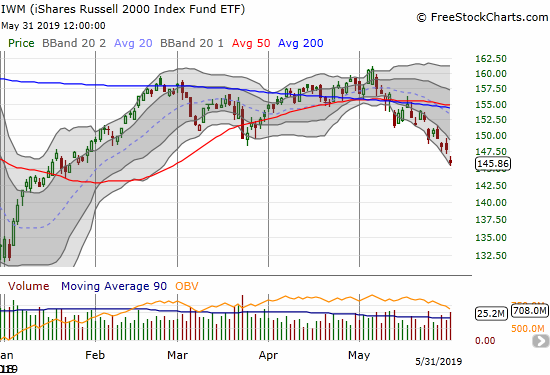
The iShares Russell 2000 ETF (IWM) now looks like it is leading the market lower and lower….
My favorite technical indicator, AT40 (T2108), the percentage of stocks trading above their respective 40DMAs, prevented me from following the breakout to new all-time highs in bullish gear. AT40 dropped from overbought conditions in March and tried and failed for two months to break through the 70% threshold. This is bearish behavior in slow motion. I thought AT40 could hit oversold by Friday. It got as low as 20.7% before rebounding to a 23.6% close.
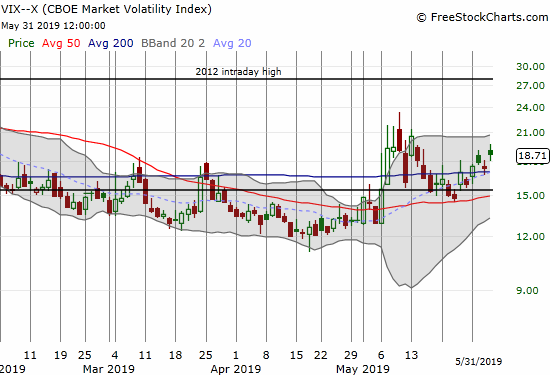
In many cases, I would consider this encounter good enough to start making some bullish bets, but I stood down given two observations: 1) the major indices just broke critical 200DMA support, and 2) the volatility index (VIX) did not even cross 20. In fact, the VIX is only trickling higher as if market participants are reluctant to rush for fresh protection. The VIX was higher when the S&P 500 first tumbled off its all-time high.
It is very possible that market participants are rushing to bonds for protection instead of put options on the S&P 500 (used to calculate the VIX). The iShares 20+ Year Treasury Bond ETF (TLT) went parabolic last week as it closed above its upper Bollinger Band (BB) for the last 4 days. TLT closed at a 2 1/2 year high.
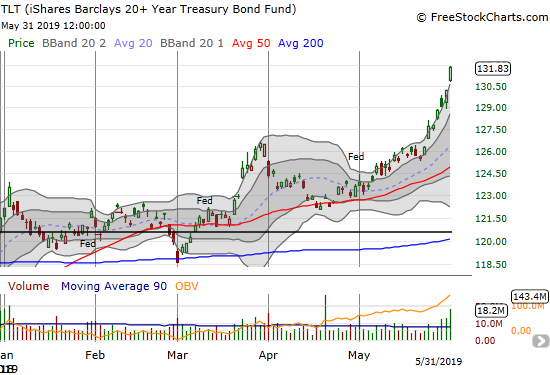
Given this extreme move, I decided to reload on TLT puts. I bought September $125s. If the market decides the outlook has improved at any time in the next few months, TLT should roll back sharply. However, if the recent historic rush for protection by institutional money managers is a leading indicator, the entire summer could become quite bearish for stocks.
Trade War
“Imposing tariffs on goods from Mexico is exactly the wrong move. These tariffs will be paid by American families and businesses without doing a thing to solve the very real problems at the border. Instead, Congress and the president need to work together to address the serious problems at the border.”
U.S. Chamber of Commerce – May 30, 2019 in immediate response to President Trump’s tweet threatening Mexico.
Financial markets seemed like they held out for an upside trade war surprise. On Thursday night, President Trump delivered a downside surprise by threatening tariffs on Mexico as punishment for insufficient action on illegal migrants crossing the US-Mexico border. Business interests are quickly lining up against the threat of tariffs against Mexico. As a result, I am betting on a reversal of the incremental angst caused by the threats against Mexico. I am guessing that Trump and his team will find a way to declare a victory – like Mexico “committing” to doing something more – and thus roll back the tariff threat. I will look to take quick profits as such political performances resolve little.
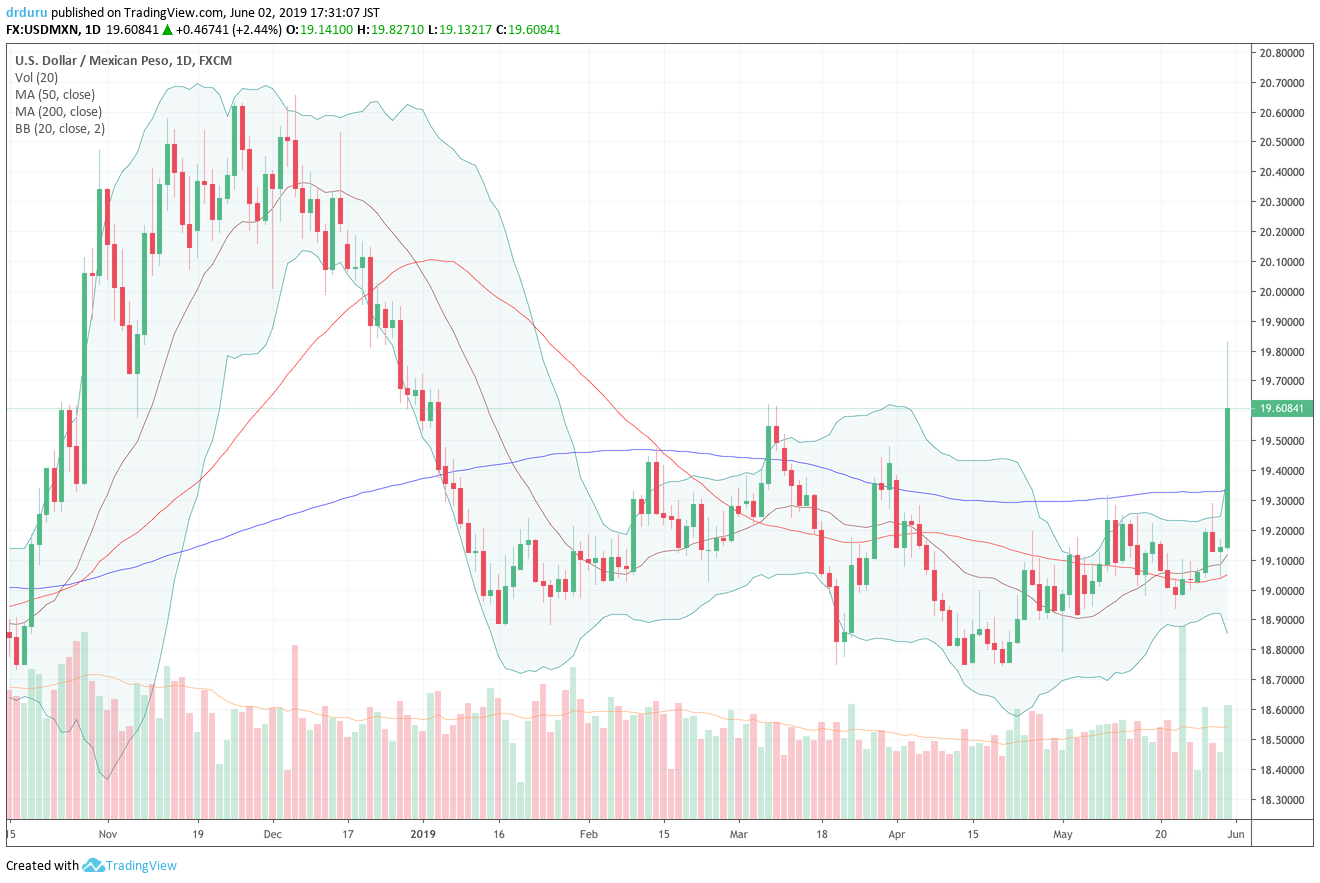
USD/MXN surged about 2.4% with a 200DMA breakout and at one point a 5-month high. I accumulated a small position and recognize there is upside risk likely all the way to the highs from last November. Still, I have been chomping at the bit to go long the Mexican peso at better pricing. I will get a lot more aggressive in positions around 20 or so.
Currency Indicators: Australian dollar and the Japanese yen
The market seemed to process the full extent of the implications of the expanded trade war as major stock indices closed on their lows for the day. Other currencies reacted beyond the Mexican peso. For example, the Australian dollar (FXA) versus the Japanese yen (FXY) broke down again. It was the previous consolidation in AUD/JPY that provided the most hope for a (short-term) bounce for the major indices off support levels at the 200-day moving average (DMAs).
In my previous Above the 40 post I prematurely declared “the currency markets are also starting to favor the bulls.” The Australian dollar (FXA) versus the Japanese yen (JPY) was still in a consolidation pattern despite the recent dovish turn in the Reserve Bank of Australia. While the 2-week consolidation definitely created a bullish divergence from the S&P 500 (SPY), I should have noted the potential invalidating conditions. Friday delivered an invalidation in the form of a new 2019 closing low for AUD/JPY; indeed the decline confirmed and underlined the bearish turn in the stock market.
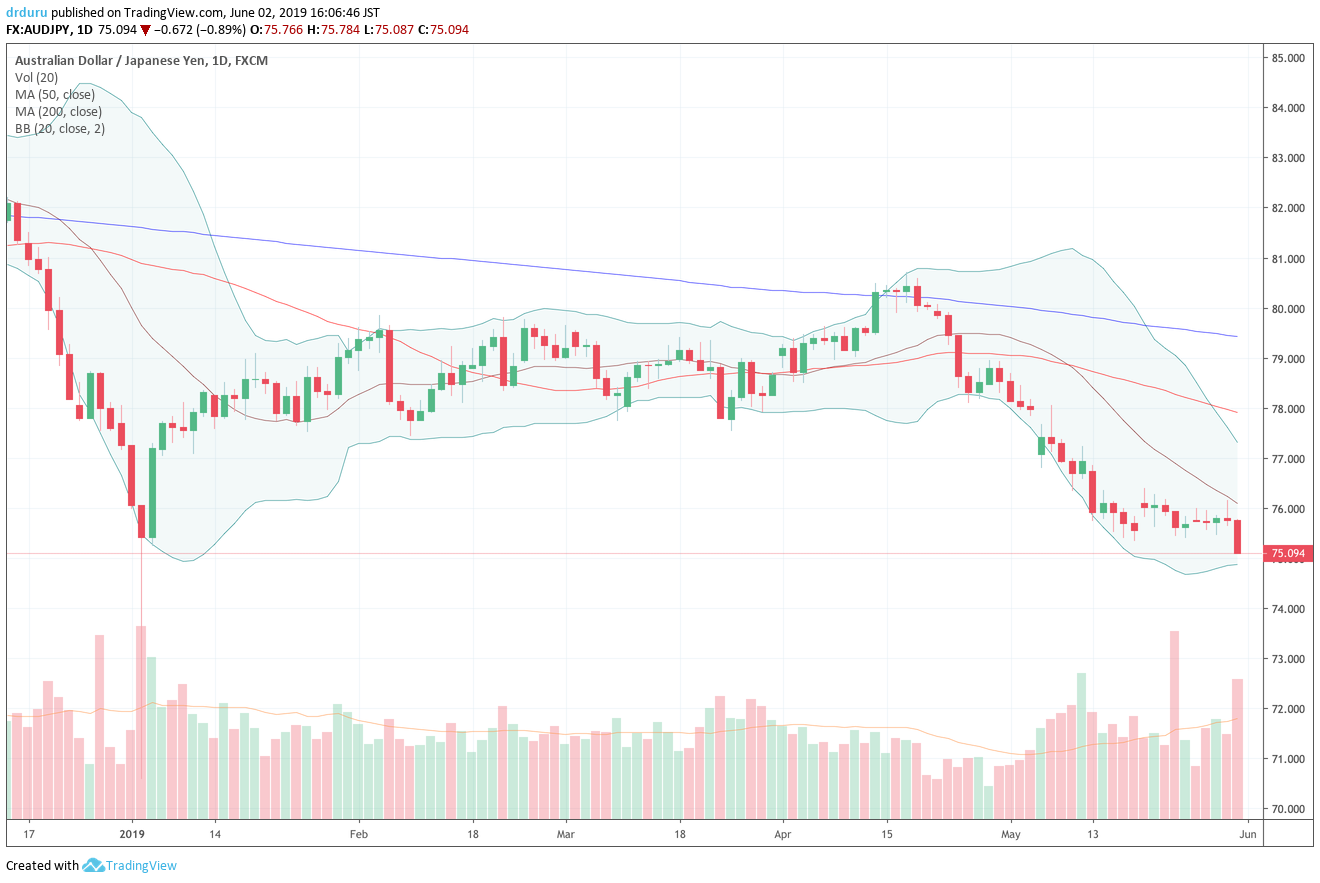
Source: TradingView
This bearish move is challenging my approach to hold onto a long AUD/JPY position as part of my hedges on my short positions in the stock market because the currency pair looks set to go a LOT lower. If stocks do not follow suit, I may have to cut the losses in AUD/JPY and/or get more aggressive with my short GBP/JPY positions if the strength of the Japanese yen (FXY) is the culprit.
Stock Chart Reviews – Bearish
Chipotle Mexican Grill (CMG)
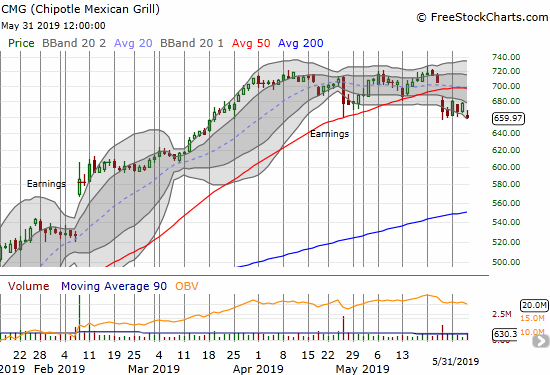
Chipotle Mexican Grill (CMG) gapped down below its 50DMA in mid-May and churned from there. Friday’s 2.7% loss looks like the beginning of fresh downward pressure on the stock.
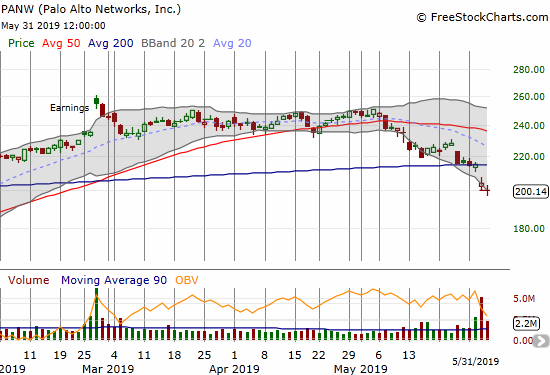
Palo Alto Networks (PANW)
Palo Alto Networks (PANW) fell out of a 2-month consolidation pattern when it confirmed a 50DMA breakdown in May. Its post-earnings 200DMA breakdown confirms a new bearish trading setup for the stock (with a stop above the 200DMA).
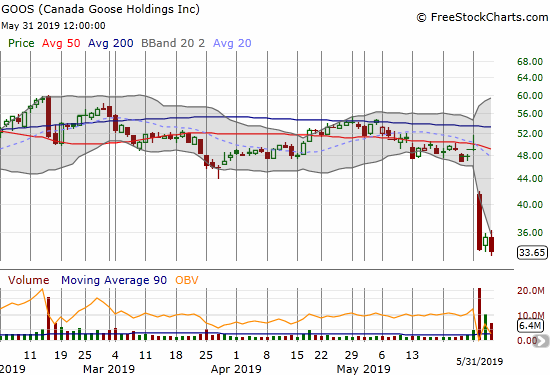
Canada Goose Holdings (GOOS)
The “fun” is over in Canada Goose Holdings (GOOS). After its IPO, GOOS rocketed to faddish acclaim and peaked with a 321% gain in 15 months. The stock spent the next 4 months trending downward with very wide swings up and down before making a marginal new all-time high in one final buying frenzy from October to November, 2018. The stock looked like it was immune to the stock market’s malaise at the time.
Cramer: Winterwear maker Canada Goose is ‘best of the bunch’ in recovering retail sector from CNBC.
Times are much different , and we now know why GOOS traded so badly earlier this year.
However, I will be watching the stock very closely given GOOS announced a share buyback in its earnings report. A close above $37 could be an early sign the buyback is working. From there a stop would occur at a new post-earnings low.
The board of directors of the Company has authorized a normal course issuer bid (the “NCIB”) to purchase for cancellation up to 1,600,000 subordinate voting shares of Canada Goose over the twelve-month period commencing on May 31, 2019 and ending no later than May 30, 2020, representing approximately 2.70% of the 59,151,443 subordinate voting shares issued and outstanding as at May 17, 2019.
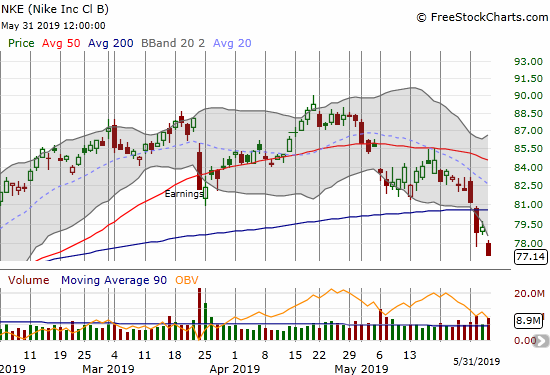
Nike (NKE)
Nike (NK) is of course a victim of increasing trade tensions with China. The stock is finally buckling under the pressure with a bearish 200DMA breakdown. The stock has not traded this low since January 15th of this year.
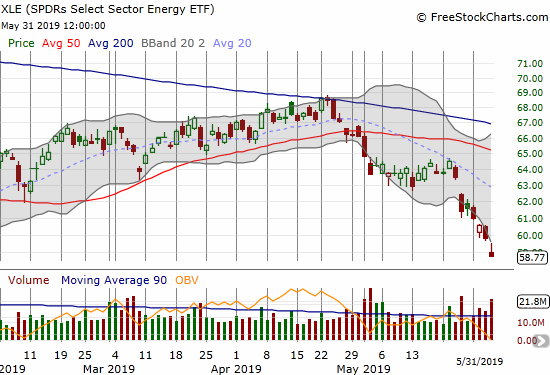
SPDRS Select Energy ETF (XLE)
The SPDRS Select Energy ETF (XLE) is almost back to flat for the year after May’s sell-off. I made the case for buying puts in XLE just based on the 50DMA breakdown at the beginning of May. The consolidation soon after that tested my patience. I took profits on Wednesday’s gap down.
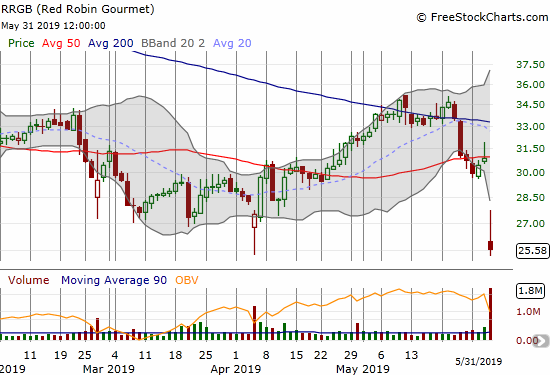
Red Robin Gourmet Burgers (RRGB)
I love the turkey burgers at Red Robin Gourmet Burgers (RRGB). For a few years I have looked out for an ideal entry point to invest in this casual dining spot. A large post-earnings gap down in November, 2017 woke me up to the reality that something was amiss. Two subsequent post-earnings gap down completely cooled off my heels. Now I just watch and wonder what is going on! I hope I can at least keep enjoying the turkey burgers…
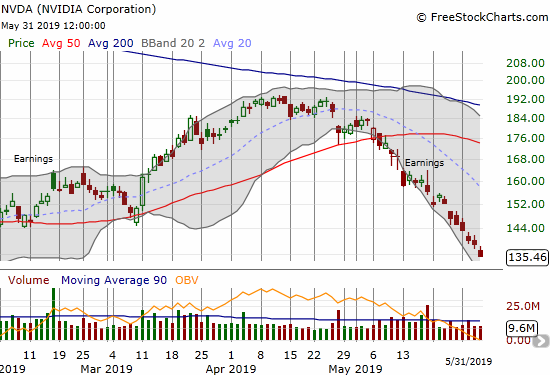
NVIDIA (NVDA)
NVIDIA (NVDA) trended downward so consistently during May, it must have been on every short-seller’s trade list. I never took my own swing. NVDA has almost wiped out all its (relief rally) gains for 2019.
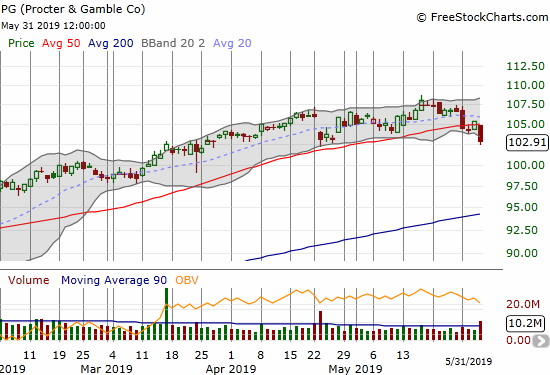
Proctor & Gamble (PG)
Money managers are fond of running to “defensive” stocks when they sniff danger in the air. The near mandatory imperative to stay invested forces these kinds of rotations. As a result, consumer staples like Proctor & Gamble (PG) have become quite expensive. PG sports a lofty 24 trailing and 22 forward P/E. Price to sales (P/S) is stratospheric at 3.8. Even with a 2.8% dividend yield, PG has far too much downside risk to warrant using it as a shelter. Not only is the stock expensive at a time when global growth may be in trouble, but also IF the market perceives rosier times ahead, money managers will be quick to dump expensive stocks like PG and run back to relatively “cheap” growth stocks like NVDA.
In other words, PG is in a lose-lose situation. I jumped on June $100 put options on Friday as a starter position. I hope to add to these puts this week. I am targeting a relatively quick test of 200DMA support.
Stock Chart Reviews – Bullish
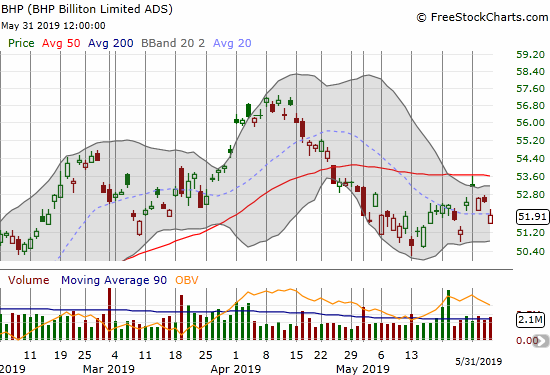
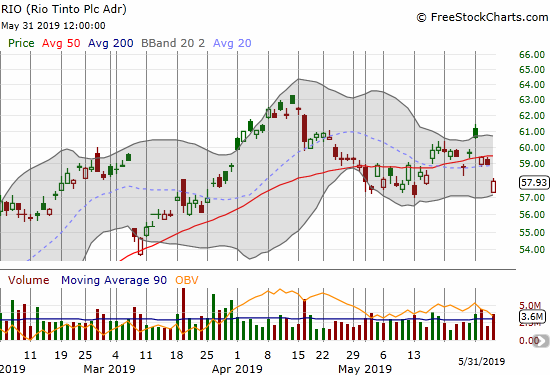
BHP Biliton Limited (BHP) and Rio Tinto (RIO)
I put a July expiration on my latest spin on the BHP Biliton Limited (BHP) versus Rio Tinto (RIO) pairs trade. I took profits on my RIO put options in last week’s sell-off because both RIO and BHP held up in May much better than the general stock market. This relative resiliency is especially surprising given oil’s near collapse and poor economic data from China. Granted the bullishness here is tenuous, but on a relative basis, both RIO and BHP look strong and are buys on 50DMA breakouts.
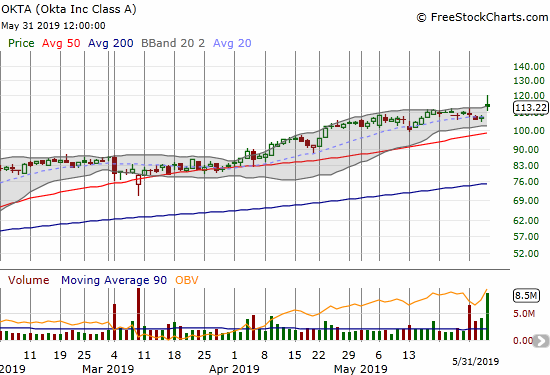
Okta (OKTA)
Okta (OKTA) continued its amazing run with a post-earnings all-time high. The stock is up an eye-popping 77.5% year-to-date.
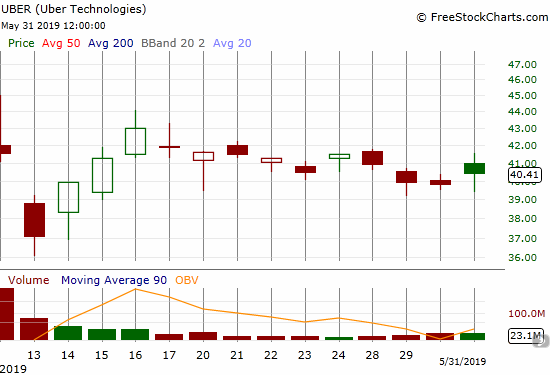
Uber (UBER)
In my last Above the 40 post, I made the case for a bullish pre-earnings play in Uber (UBER). I adjusted the call option configuration recommended by Fast Money even though the market was pricing in about a 9% post-earnings move. In hindsight, I should have sold put options instead, especially since I eventually want to own shares outright at lower prices. I give my position about a 50/50 chance of at least breaking even by the end of this week given the stock market is so close to oversold trading conditions.
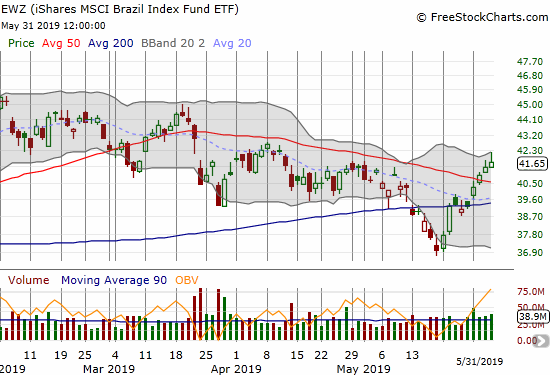
iShares MSCI Brazil Index Fund (EWZ)
The iShares MSCI Brazil Index Fund (EWZ) sprung to life after a bearish 200DMA breakdown in mid-May. A strong rally since then took EWZ through 200 and 50DMA resistance levels. I just missed my opportunity to buy into this rally as EWZ hit an 18.6% loss from its last peak and thus avoided triggering my rule to buy EWZ on a 20% pullback. At this point, a successful retest of 50/200DMA as support would be enough to trigger a short-term buy (swing trade).
— – —
FOLLOW Dr. Duru’s commentary on financial markets via email, StockTwits, Twitter, and even Instagram!
“Above the 40” uses the percentage of stocks trading above their respective 40-day moving averages (DMAs) to assess the technical health of the stock market and to identify extremes in market sentiment that are likely to reverse. Abbreviated as AT40, Above the 40 is an alternative label for “T2108” which was created by Worden. Learn more about T2108 on my T2108 Resource Page. AT200, or T2107, measures the percentage of stocks trading above their respective 200DMAs.
Active AT40 (T2108) periods: Day #99 over 20% (overperiod), Day #3 under 30% (underperiod), Day #7 under 40%, Day #18 under 50%, Day #18 under 60%, Day #61 under 70%
Daily AT40 (T2108)
")
Black line: AT40 (T2108) (% measured on the right)
Red line: Overbought threshold (70%); Blue line: Oversold threshold (20%)
Weekly AT40 (T2108)

*All charts created using FreeStockCharts unless otherwise stated
The T2108 charts above are my LATEST updates independent of the date of this given AT40 post. For my latest AT40 post click here.
Related links:
The AT40 (T2108) Resource Page
You can follow real-time T2108 commentary on twitter using the #T2108 or #AT40 hashtags. T2108-related trades and other trades are occasionally posted on twitter using the #120trade hashtag.
Be careful out there!
Full disclosure: long UVXY puts, long IWM calls, long AUD/JPY, short GBP/JPY, long PG puts, long UBER call spread, long BHP calls, short USD/MXN, long TLT puts
*Charting notes: FreeStockCharts stock prices are not adjusted for dividends. TradingView.com charts for currencies use Tokyo time as the start of the forex trading day. FreeStockCharts currency charts are based on Eastern U.S. time to define the trading day.