
AT40 = 45.4% of stocks are trading above their respective 40-day moving averages (DMAs) (2+ month low)
AT200 = 38.8% of stocks are trading above their respective 200DMAs
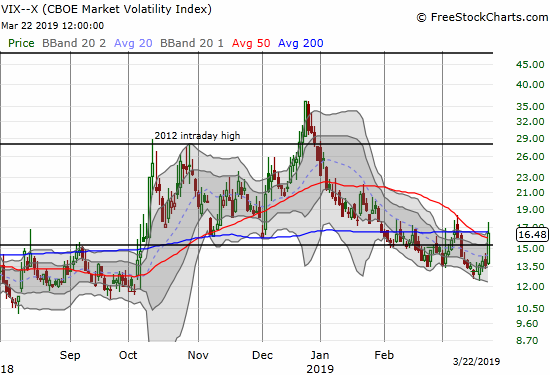
VIX = 16.5 (20.9% gain)
Short-term Trading Call: bearish
Stock Market Commentary
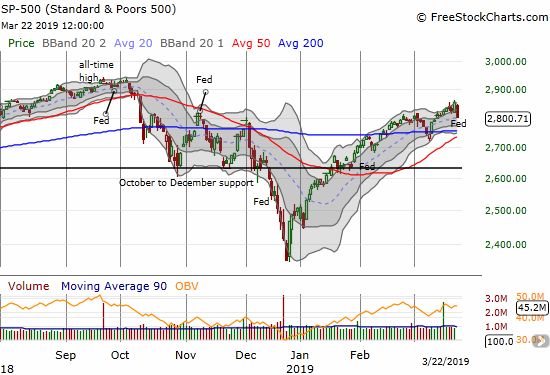
Friday’s trading action provided delayed confirmation of my short-term bearish trading call.
The week previous to the last, the S&P 500 (SPY) gained 4 of 5 trading days. The mild breakout at the end of that week planted the index in a 5-month high while a mild bearish divergence developed at the same time. I focused on that divergence as support for my on-going short-term bearish trading call. Last week, the drift higher continued Monday but reversed into a drift lower going into and through Wednesday’s monetary policy announcement from the Federal Reserve. A post-Fed rally was followed by a post-post-Fed fade on the heels of poor manufacturing data from Germany and weaker than “expected” manufacturing data in the U.S. These data of course further reinforced the reason for the Fed’s complete capitulation into suggesting it would not even think about rate hikes this year.
Political news also swirled with President Trump surprisingly reversing sanctions on North Korea enacted on Thursday and the anticipated release of the Robert Mueller report on allegations of election collusion with Russia (the U.S. Attorney General acknowledged receiving the report after the market closed).
Perhaps the S&P 500 did well just to lose 1.9% on the day.
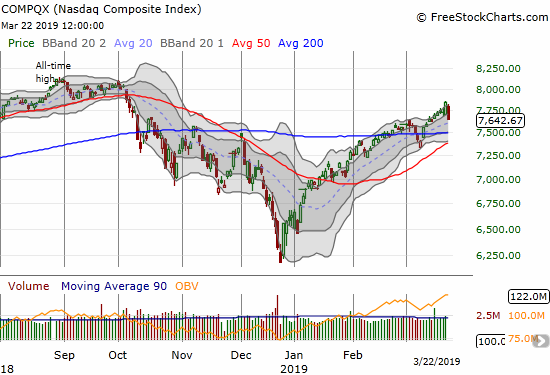
The NASDAQ (NDX) fell even more than the S&P 500 with a 2.5% loss. Unlike the S&P 500, the tech-laden index did not touch its uptrending 20DMA.
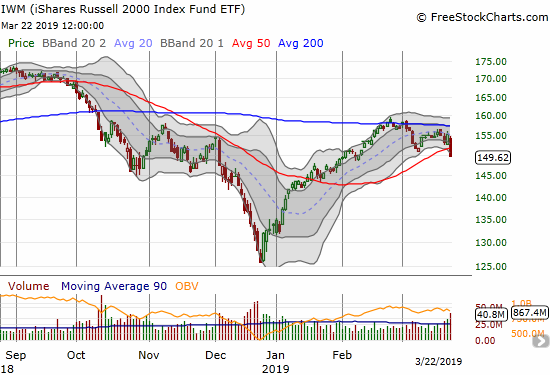
Other indices delivered even more convincing confirmation of trouble. The iShares Russell 2000 ETF (IWM) broke down below its 50-day moving average (DMA) and hit a 6-week low.
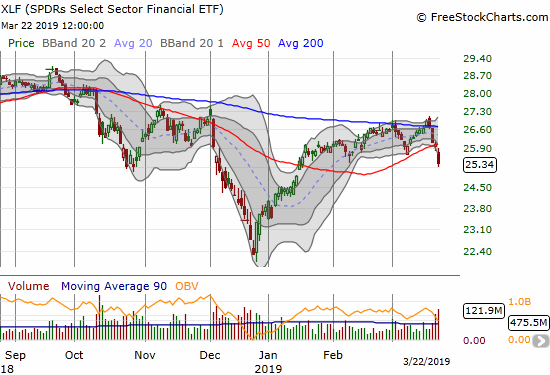
The Financial Select Sector SPDR ETF (XLF) looks even worse than IWM after 3 of 5 days in the week of steep selling. XLF confirmed a 50DMA breakdown and closed at a 2-month low.
The volatility index, the VIX, underlined the market’s stress. The VIX jumped right out of complacency mode from 5-month lows to a high of the month. I positioned myself ahead of the Fed meeting anticipating increased volatility by going long Pro Shares Ultra VIX Short-Term Futures ETF (UVXY) calls; my trade was based on the S&P 500 fading on the heels of a bearish divergence. The reaction to the Fed monetary policy decision was mild. The rally on Thursday had me thinking I got a false signal. So when the market started selling off on Friday, I was eager to take profits. Spikes in volatility in this year’s complacent market have had very short shelf lives. I left a LOT of profit on the table!
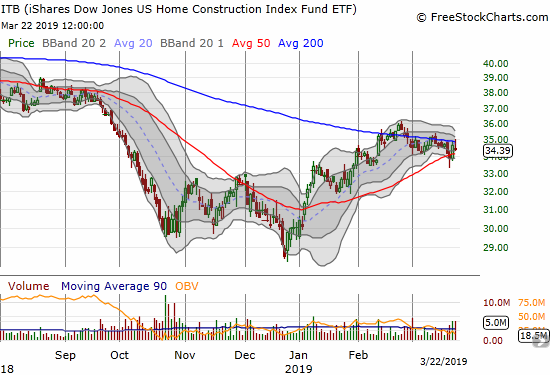
With risk-off, safety trades in full swing, interest rates took another dive and, ironically, boosted enough homebuilders to send iShares Dow Jones US Home Construction Index (ITB) higher and through 200DMA resistance for a short time. Sellers took over from there. ITB chopped lower for the rest of the day into a 0.7% loss at the close.
AT40 (T2108), the percentage of stocks trading above their respective 40-day moving averages (DMAs), confirmed the market’s latest bout of weakness by dropping to a 2+ month low at 45.4%. My favorite technical indicator went from a bearish divergence with the stock market to a harmonic resonance with the market.
Still, AT40 dropped all the way from 61.9%, so a lot of bargain hunters are looking at a market they think has fallen too far, too fast. Monday should be a major test of wills for bears and bulls. Apple’s product announcement will be sure to cause at least temporary excitement. However, traders tend to sell the news after such events. If AAPL breaks down below its 200DMA again, profit-takers will likely gain fresh momentum. Even if AAPL survives with a successful defense of its 200DMA, a waft of IPOs promise to absorb a lot of firing power from buyers. Levi Strauss and Company (LEVI) came out on Thursday to great applause in the middle of the market’s rally that day. Lyft promises to gain even raver reviews with this coming week’s IPO. How much buying enthusiasm will remain not just for the other large IPOs coming but also the rest of the market?
I decided to take a few steps ahead of the potential bargain hunters and buy into the current leaders as hedges on running bearish positions: long Invesco QQQ Trust (QQQ) calls as a proxy for expensive AAPL calls, long an AMZN call which is the remnant of a calendar call spread, a calendar call spread on SPY with the short side expiring last Friday (I was targeting a quicker flip that did not quite materialize), and even a fresh Alphabet (GOOG) call spread. If a rally materializes, I will be quick to take profits on these new positions and will look to add to my bearish positions.
Stock Chart Reviews
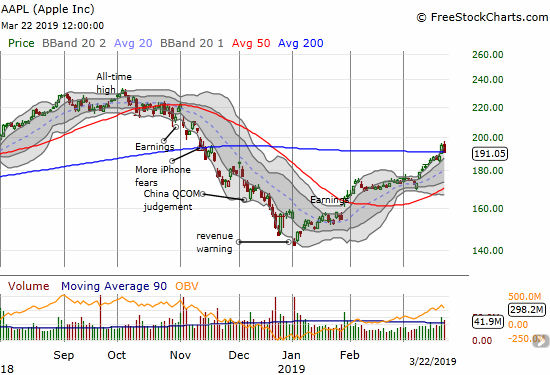
Apple (AAPL)
I thought Apple (AAPL) would test its 200DMA resistance in concert with the company’s product announcement on Monday, March 25th. Buyers decided not to wait. AAPL displayed relative strength on Wednesday by closing with a small gain at its intraday high. Thursday, the stock gapped up to its 200DMA and kept rallying into a 3.7% gain. The rally “felt” like it came out of nowhere. Sellers showed up for the first time during this over-stretched rally and reversed the stock back into its 200DMA.
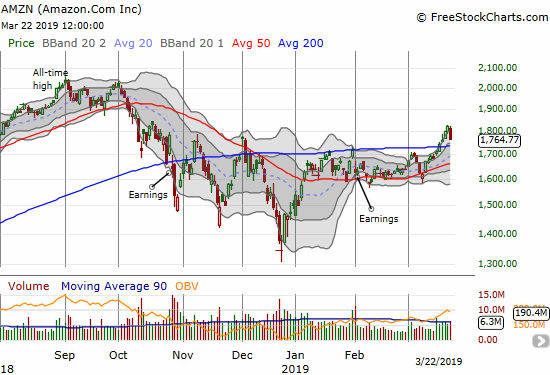
Amazon.com (AMZN)
Amazon.com (AMZN) is another big cap tech company that buyers suddenly decided to chase last week. AMZN opened the week with a 200DMA breakout and closed above its upper-BB for 4 straight days. The enthusiasm came to a screeching halt with Friday’s 3.0% loss. I was flipping AMZN call options against a withering (and now expired) put spread and finally got caught by Friday’s selling. As I mentioned above, I held onto the call.
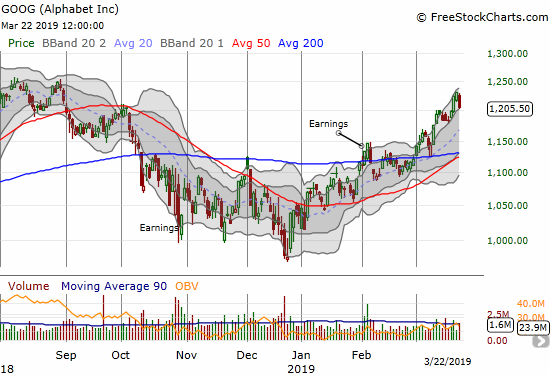
Alphabet (GOOG)
Alphabet (GOOG) started March with a 200DMA breakout. The run-up from there has been choppy with the upper-BB channel holding intact after a test of 200DMA support. Friday’s 2.1% loss left the stock’s uptrend intact. I bought a call spread in case the stock has one last pop left for the coming week.
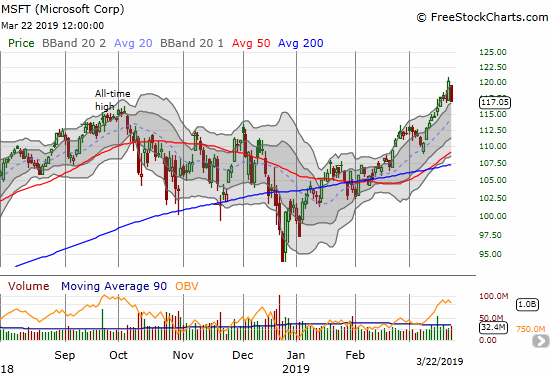
Microsoft (MSFT)
Microsoft (MSFT) stands tall among the big-cap tech stocks that regained favor this month. The stock broke out to a new all-time high on Thursday. That high may stand for a while given the abruptness of Friday’s gap down and follow-through. I am looking for confirmation with a break through the upper-BB trading channel. Absent that, MSFT looks like a perfect stock for hedging against my bearishness.
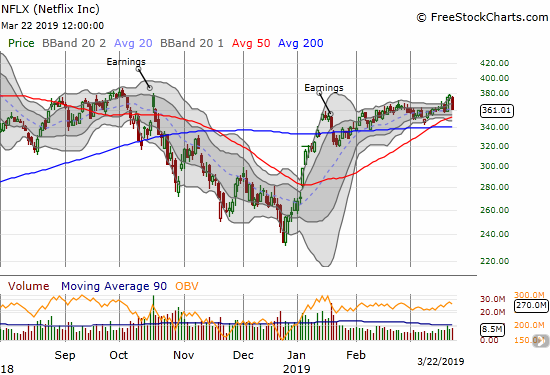
Netflix (NFLX)
Netflix (NFLX) was able to close above its upper-BB before losing 4.5% on Friday. NFLX is another example of the big cap tech stocks that soaked up so much money and attention that it was able to stay over-stretched for a spell. Friday’s pullback dropped NFLX right back to its previous consolidation range.
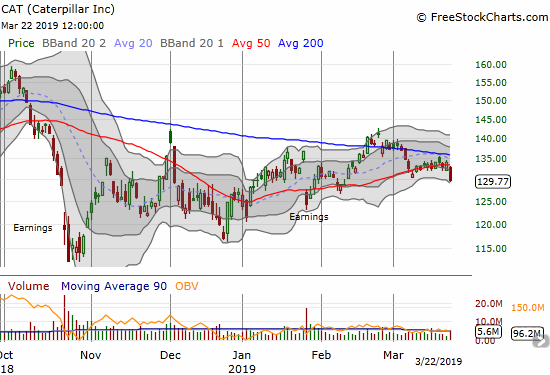
Caterpillar (CAT)
I expected continued complacency and comfort with US-China trade relations to help propel fresh momentum into CAT. Instead, the stock languished. The slowed momentum finally culminated in a 50DMA breakdown and a 3.2% loss to end the week. Given my bearishness, I jumped into CAT puts on the post-Fed 50DMA (minor) breakdown. I took profits on those puts in the middle of Friday’s sell-off. I will be active shorting CAT again until/unless the stock closes above its 200DMA.
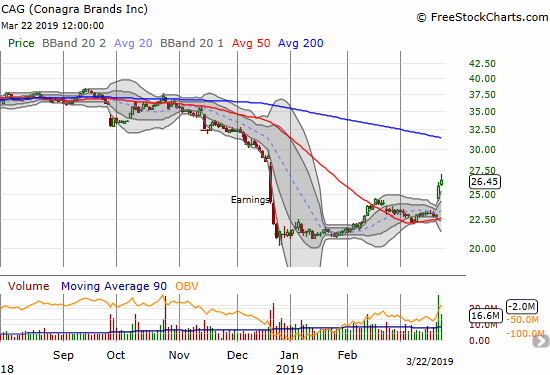
Conagra Brands (CAG)
Conagra Brands (CAG) may be on the comeback trail. The company reported earnings and broke out in a move that confirmed 50DMA support.
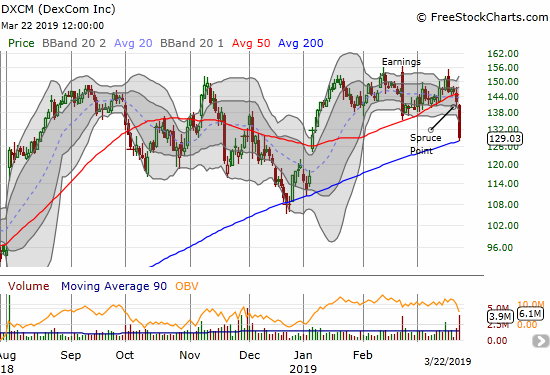
DexCom (DXCM)
I shifted from bullish to bearish on DexCom (DXCM) and in both directions I only managed to capture a small share of the potential profits. A month ago I noted DXCM’s toppy post-earnings pattern. As the stock crept up 50DMA support, I faded rallies and quickly took profits on the return. Each time, I waited for a 50DMA breakdown to signal bearish follow-through.
My last fade came on a surge to a post-earnings high that made me wonder whether the stock was actually on its way to a post-earnings breakout to a new all-time high. So even after the stock finally closed below its 50DMA, I did not short again. The next day, DXCM dropped 9.2% all the way to 200DMA support. Given the catalyst was an analyst report, I am now looking to play a bounce from support, especially with the stock closing well below its lower Bollinger Band (BB).
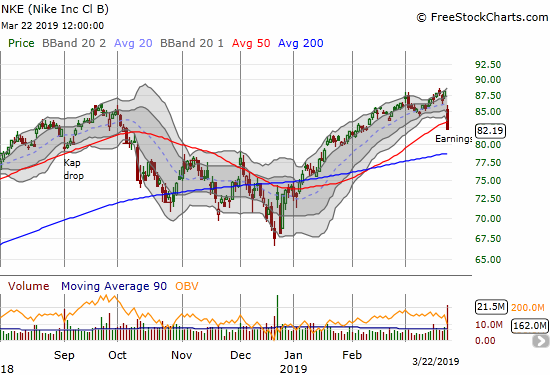
Nike (NKE)
Apparently North American sales disappointed and brought out the post-earnings sellers in Nike (NKE). The pressure was enough to send NKE to a 50DMA breakdown and print what looks like a lasting top.
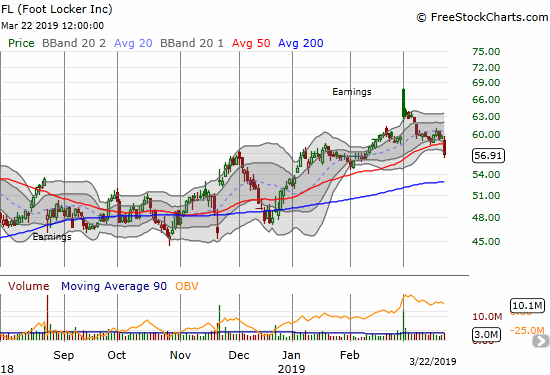
Foot Locker (FL)
Earlier in March, I described Foot Locker (FL) as a particular example of a potentially bullish setup. The buy opportunity never triggered and instead I ended up trading the bearish implications of a failure in the setup: “To the downside, I like a put spread with the bottom of the spread set around $54 where the 50 and 200-day moving averages (DMAs) are converging to provide support.” The stock followed through on the bearish move with a 4.9% 50DMA breakdown in sympathy with a poor response to the earnings report of Nike (NKE).
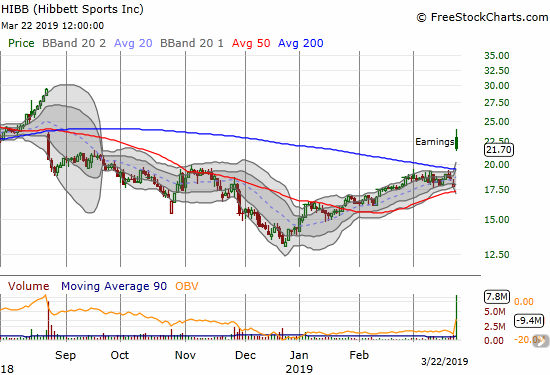
Hibbet Sports (HIBB)
While sporting retail was under pressure thanks to Nike’s earnings, Hibbet (HIBB) plated contrary with a strong post-earnings move. No surprise that the stock faded from its highs, but it still looks like a buy on, say, a test of 200DMA support. Given how many stocks have quickly lost their post-earnings mojo, I am fully expecting that test in the coming week or so.
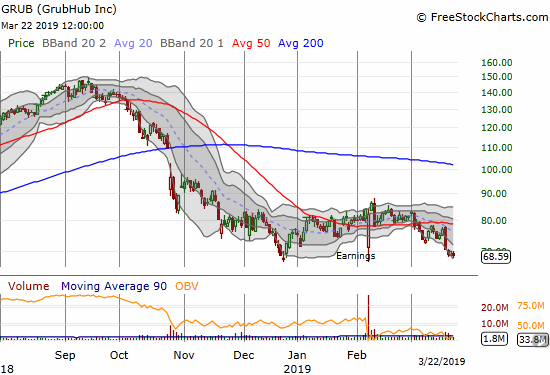
Grub Hub (GRUB)
In early February, Grub Hub (GRUB) looked like it was breaking out from a consolidation pattern. That moment turned out to be the last peak. Since then, the stock has drifted downward. It closed last week at a post-earnings low and looks ready to break support from its December low. The stock is now on my list for fading rallies.
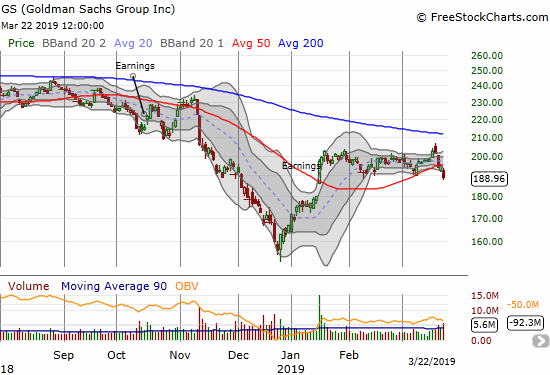
Goldman Sachs (GS)
When I shorted Goldman Sachs (GS) I was committed to hanging onto the position and even adding to my position on a test of 200DMA resistance. I lost my resolve exactly at the wrong moment. When GS surged to a small breakout above its upper-BB to start the week, I decided to take a small loss and re-short at what I thought would be a surge toward 200DMA resistance. The next day, GS gapped up a little more and sellers took over from there. I now stare at the irony of covering the stock right before it punched through the 50DMA breakdown I was targeting. Needless to say, I am looking to fire up a fresh short position….and next time stick to my plans. As shown with the XLF chart, financials in general are back in hot water.
Lowe’s Companies (LOW)
Lowe’s Companies (LOW) made a good run off 50 and 200DMA support. I took profits on my call options ahead of the Fed afraid that a poor post-Fed response would erase my profits. I was of course dismayed to watch LOW surge further post-Fed. I am back to watching as I think another test of support is coming.

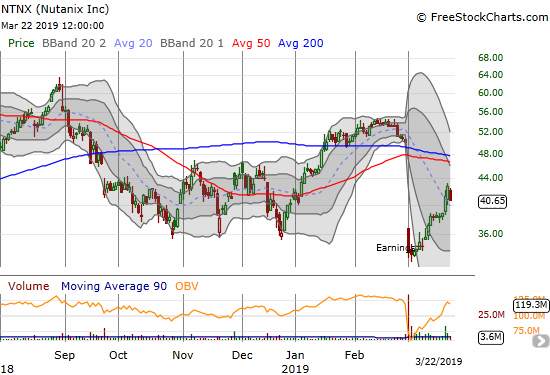
Nutanix (NTNX)
Nutanix (NTNX) caught my attention after a massive post-earnings breakdown to start the month. Buyers have taken over ever since. The stock is up 20.6% from its post-earnings close even with Friday’s pullback. The next time my short-term trading call turns some flavor of bullish, I will have NTNX at the top of my “consideration” list.
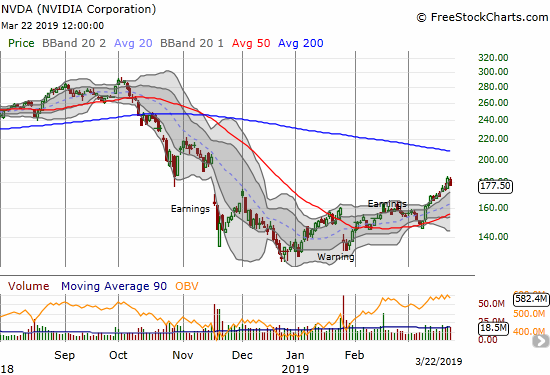
NVIDIA (NVDA)
Speaking of impressive recoveries, NVIDIA (NVDA) is clearly in a recovery phase. I am no longer interested in taking a swing at this run-up, but I like the stock as a buy-on-the-dip after I end my bearish short-term trading call. I just hope the stock has not already tested 200DMA resistance by then!
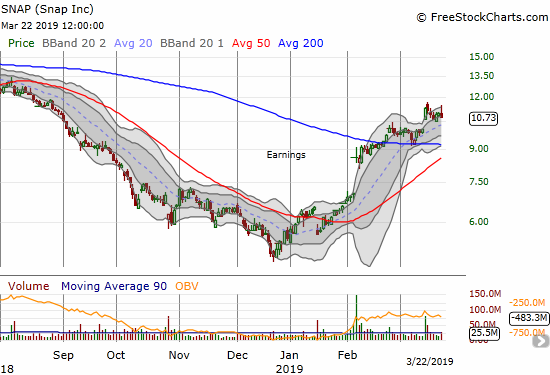
Snap (SNAP)
I am back to actively checking in on SNAP for a trading opportunity. The stock survived Friday’s selling pressure very well. The stock was even trading at the upper bound of its upper-BB before sellers took over. My bias anticipates a topping pattern in the works, but I am trying to stay open-minded with 50 and 200DMAs converging quickly to provide additional support for the stock.
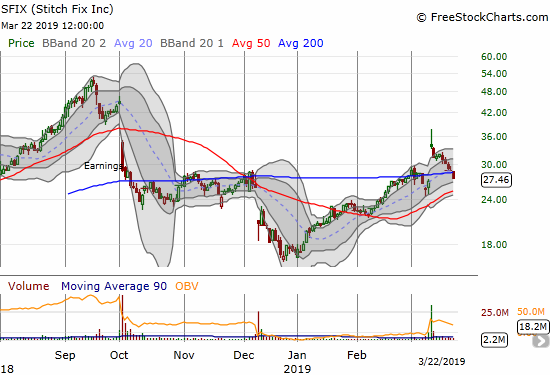
Stitch Fix (SFIX)
Stitch Fix (SFIX) traded as high as 39.8% post-earnings before fading back to its opening price. Sellers have yet to stop fading the stock. SFIX closed the week effectively completing a full reversal of its post-earnings gap up. I thought the stock was setting up for a “calm after the storm”, and I jumped into a call spread. I should have stuck with my bearish short-term trading call!
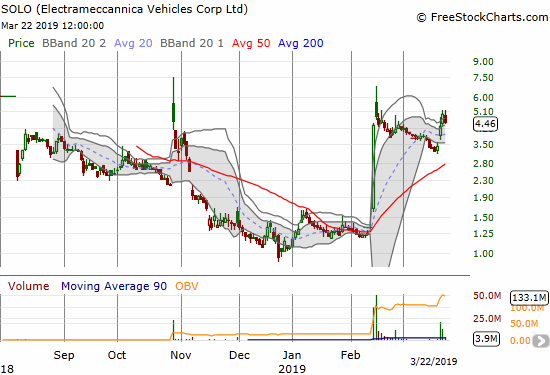
Electrameccannica Vehicles (SOLO)
Electrameccannica Vehicles (SOLO) turned in a good week as the stock finally experienced the resurgence I was expecting. With a short-term bearish trading call in place, it was VERY hard to sit on my profits during Friday’s sell-off. I stayed put because I am looking over the horizon for new highs (I wrote about SOLO 5 weeks ago). If SOLO manages to reverse its latest gains, I will have to back down and stop out.
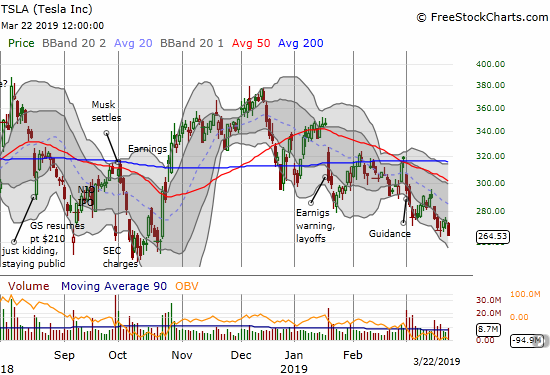
Tesla (TSLA)
Tesla (TSLA) sank lower last week. When I wrote about bullish and bearish trade setups for TSLA, my fundamental short-term premise was that owners of TSLA stock needed some kind of downside protection. A coming test of $250 support now looks clearer than ever.
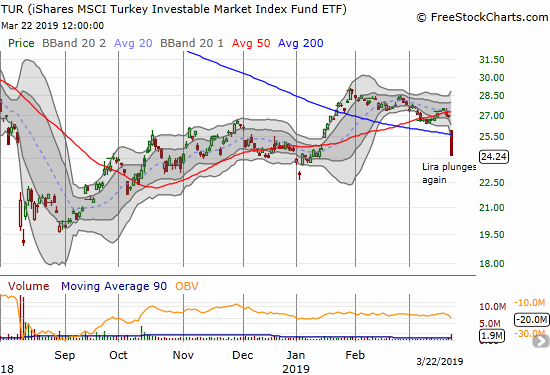
iShares MSCI Turkey Investable Market Index (TUR)
The iShares MSCI Turkey Investable Market Index (TUR) provided one of those reminders of the importance of getting out of a trade in a timely matter when it is not working as expected. I threw in the towel when TUR drifted below its 50DMA earlier in the month. Relief washed across my face when I saw the ETF get bludgeoned in the wake of a major sell-off in the Turkish lira (USD/TRY).
THIS time I was prepared in foreign exchange (forex) although it took major patience to wait out this latest lira sell-off. The pop also took so long that I had to get more hedged than ideal with a short EUR/TRY. This position took some of the sting out of all the carry I was paying on my long USD/TRY. If this latest crisis follows previous patterns there may be one or two more days that it makes sense to hold my long USD/TRY. I will then take profits and see what happens with my short EUR/TRY (it helps that I am VERY bearish on the euro – which has proved valuable against a range of currencies). Politics and central bank emergency measures will complicate the trading as a March 31st election looms in Turkey. JP Morgan (JPM) apparently released a report citing risks in the lira going into those elections.
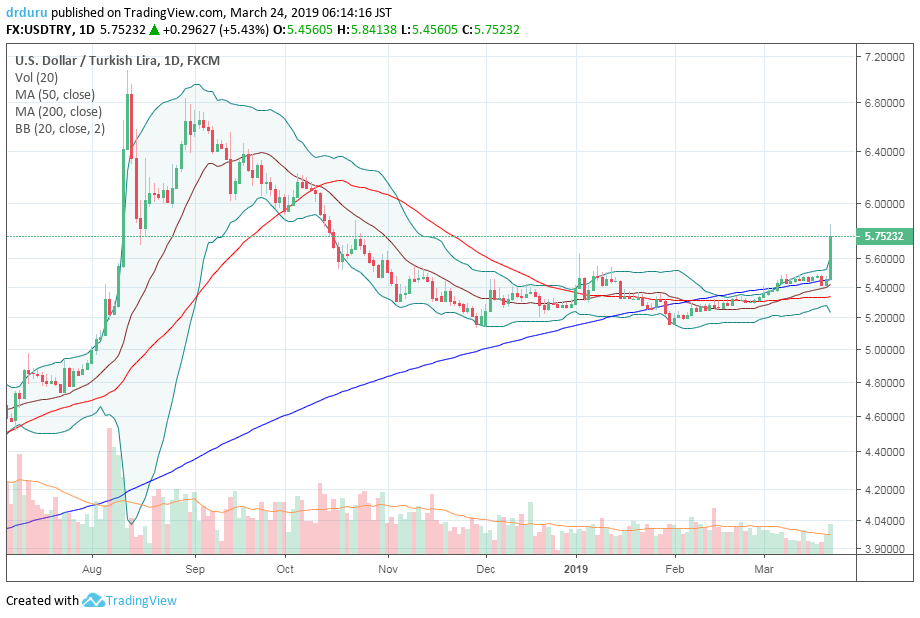
Source: TradingView
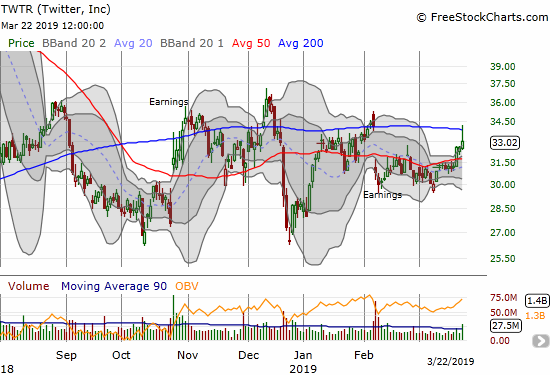
Twitter (TWTR)
In my last post on Twitter (TWTR), I talked about settling for selling a call against my position while I wait for its next move. However, I was surprised to find that the calls were “cheap.” They were too cheap for me to sell, so I reversed course and BOUGHT a call. I held a bit of concern that the calls were cheap for a reason. The payoff came in a surprising way as TWTR surged on Friday to hit 200DMA resistance. I promptly took profits on my call option. With volatility up again, I am expecting to find better prices next week for selling a call against my shares.
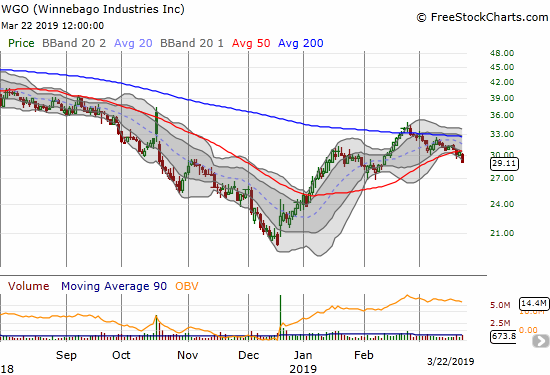
Winnebago Industries (WGO)
Winnebago Industries (WGO) confirmed a 50DMA breakdown and earned a firm place on my list of shorts for the coming week. I think the stock will eventually retest its lows from December and perhaps worse. RVs as recreational vehicles are just plain expensive when the economy is grinding slower.
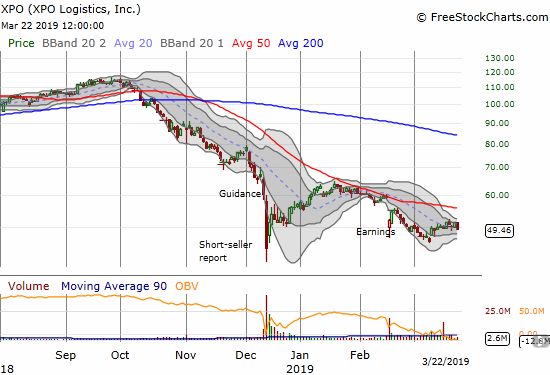
XPO Logistics (XPO)
XPO Logistics (XPO) survived the earnings disappointment from FedEx (FDX). The idling continues.
— – —
FOLLOW Dr. Duru’s commentary on financial markets via email, StockTwits, Twitter, and even Instagram!
“Above the 40” uses the percentage of stocks trading above their respective 40-day moving averages (DMAs) to assess the technical health of the stock market and to identify extremes in market sentiment that are likely to reverse. Abbreviated as AT40, Above the 40 is an alternative label for “T2108” which was created by Worden. Learn more about T2108 on my T2108 Resource Page. AT200, or T2107, measures the percentage of stocks trading above their respective 200DMAs.
Active AT40 (T2108) periods: Day #54 over 20%, Day #52 over 30%, Day #51 over 40%, Day #1 under 50% (underperiod, ending 45 days above 50%), Day #1 under 60%, Day #13 under 70%
Daily AT40 (T2108)
")
Black line: AT40 (T2108) (% measured on the right)
Red line: Overbought threshold (70%); Blue line: Oversold threshold (20%)
Weekly AT40 (T2108)

*All charts created using freestockcharts.com unless otherwise stated
The T2108 charts above are my LATEST updates independent of the date of this given AT40 post. For my latest AT40 post click here.
Related links:
The AT40 (T2108) Resource Page
You can follow real-time T2108 commentary on twitter using the #T2108 or #AT40 hashtags. T2108-related trades and other trades are occasionally posted on twitter using the #120trade hashtag.
Be careful out there!
Full disclosure: long AMZN call, long ITB calls, long SPY calls, long SFIX call spread, long SOLO, long QQQ calls, long GOOG call spread, long TWTR, long FL put spread, long USD/TRY, short EUR/TRY, short euro
*Charting notes: FreeStockCharts.com stock prices are not adjusted for dividends. TradingView.com charts for currencies use Tokyo time as the start of the forex trading day. FreeStockCharts.com currency charts are based on Eastern U.S. time to define the trading day.