
AT40 = 61.8% of stocks are trading above their respective 40-day moving averages (DMAs)
AT200 = 43.0% of stocks are trading above their respective 200DMAs
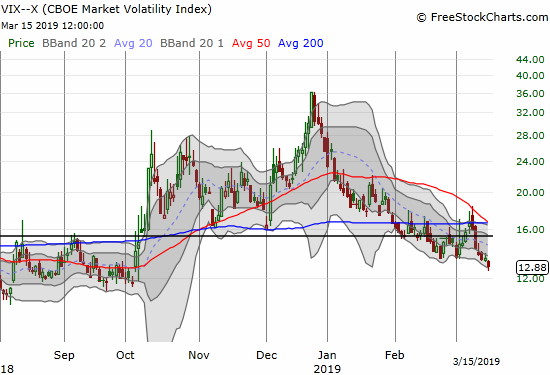
VIX = 12.9 (5-month low)
Short-term Trading Call: bearish
Stock Market Commentary
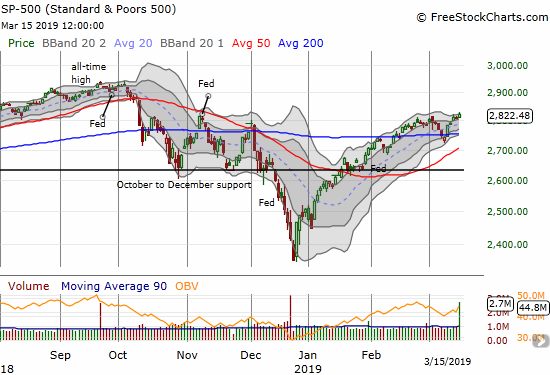
The stock market’s scramble for support worked last week as buyers and bulls put the bears on notice. However, the rally is finally starting to narrow. This narrowing presents a new precariousness to the market and keeps my short-term trading call on bearish.
The S&P 500 (SPY) gained 4 of 5 days last week and closed the week with a 0.5% gain on Friday. The mild breakout put the index at a 5-month high.
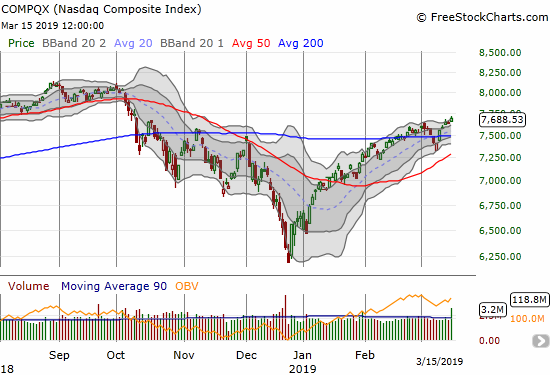
The NASDAQ (NDX) also printed a mild breakout but looks incrementally better than the S&P 500. The tech-laden index ended a strong week with a 0.8% gain on Friday.
The volatility index, the VIX, is officially in complacency mode with a drop to a new 5-month low. A test of the depths of 2018’s complacency seems nearly inevitable. I decided to let my last tranche of Pro Shares Ultra VIX Short-Term Futures ETF (UVXY) call options expire without replacement. I have enough shorts in play where I do not feel overly exposed to a sudden upward repricing in risk. I will likely leave UVXY alone until the VIX closes above its 15.35 pivot again.
All of the above looks great for bulls: a steadily rising stock market barely deterred by brief pullbacks. Yet, AT40 (T2108), the percentage of stocks trading above their respective 40-day moving averages (DMAs), is no longer cooperating with the bullish story. Particularly, AT40 topped out on Wednesday at 66.0% and faded to a 61.8% close for the week. This is a mild bearish divergence made more ominous by the “close call” with the overbought threshold of 70%. If not for the faltering VIX and some amazingly strong individual stocks like Apple (AAPL), I would have plans this week to get aggressively short. Instead, I am just keeping my finger close to the button.
Stock Chart Reviews
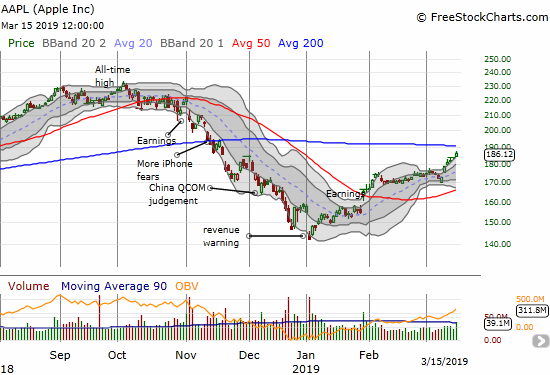
Apple (AAPL)
Once again, it is hard to stay bearish when AAPL is in rally mode. The stock’s ability to close at or above its upper Bollinger Band (BB) all week was particularly impressive. The stock looks like it is on a collision course with 200DMA resistance at the same time of the big March 25th product announcement.
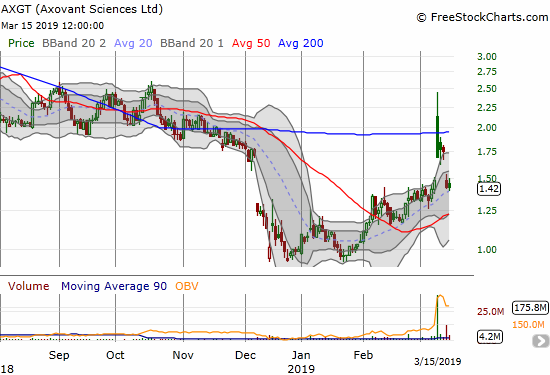
Axovant Sciences (AXGT)
Axovant Sciences (AXGT) finally delivered last week, even though the excitement was short-lived. Against my better (trading) judgement, I sat on my speculative position in AXGT even as the stock traded well above its 200DMA and upper-BB with a 65.6% gain. Inexplicably, I also forgot about the pattern of these kinds of biotech(wreck) companies rushing to cash in on big pops in their stock. AXGT announced a secondary offering of stock that immediately closed the remainder of Monday’s gap up. The stock is back to support at its rising 20DMA.
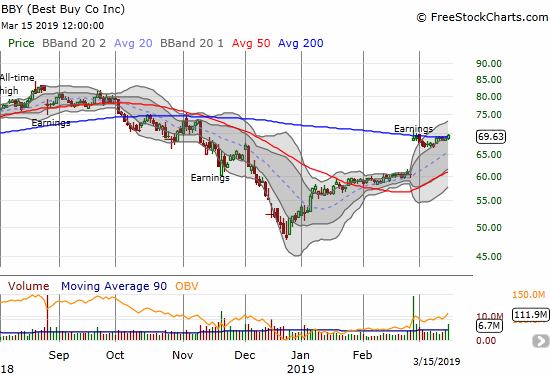
Best Buy (BBY)
Best Buy (BBY) was a stellar pre-earnings play. Now I am just watching the stock for its next definitive move. That next move looks like a fresh run as the stock closed the week above its 200DMA.
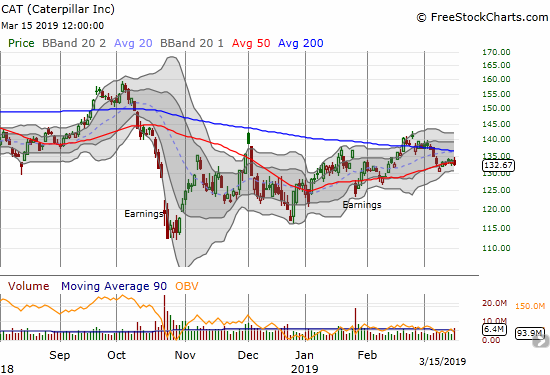
Caterpillar (CAT)
I expected continued complacency and comfort with US-China trade relations to help propel fresh momentum into CAT. Instead, the stock languished all week around its 50DMA pivot. CAT is one more subtle signal throwing up a yellow flag on the market’s rally. I did not buy a fresh set of put options to replace the latest tranche (expired harmless). I am content to wait for a break below the last low as CAT is probably just as likely to abruptly lurch toward a 200DMA breakout as it is to break down again.
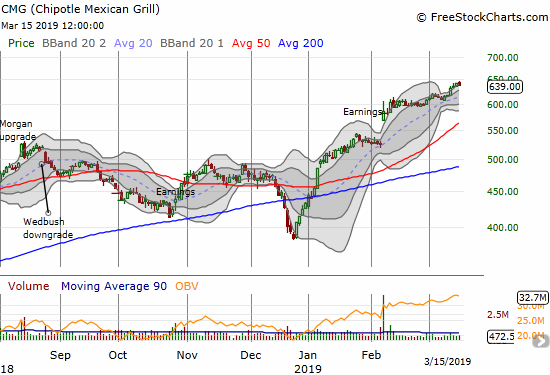
Chipotle Mexican Grill (CMG)
I am back on track with CMG. I caught Tuesday’s big move with a call option in hand. With expiration on Friday, I of course took profits. Now I await the next entry; I am looking for even the slightest dip back to the bottom of its upper-BB trading channel.
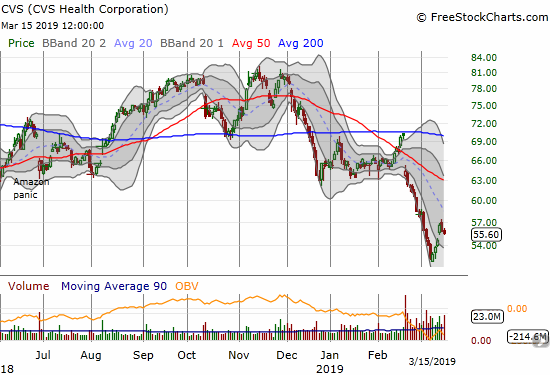
CVS Health Corporation (CVS)
CVS Health Corporation (CVS) received a brief reprieve last week with a break out of its lower-BB trading channel. Weakness returned on Thursday and presents a fresh challenge to bargain shoppers and bottom-fishers.
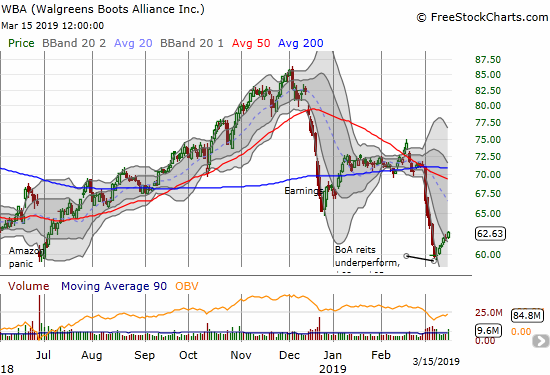
Walgreens Boots Alliance (WBA)
Walgreens Boots Alliance (WBA) received a similar reprieve as CVS but kept powering its way through the week. Ironically, WBA likely received help from a Bank of America reiteration of an underperform rating that included a drop in the price target from $69 to $62. The stock closed the week at $62.63. I am patiently waiting for my next short opportunity, preferably at or around the 50/200 DMAs.
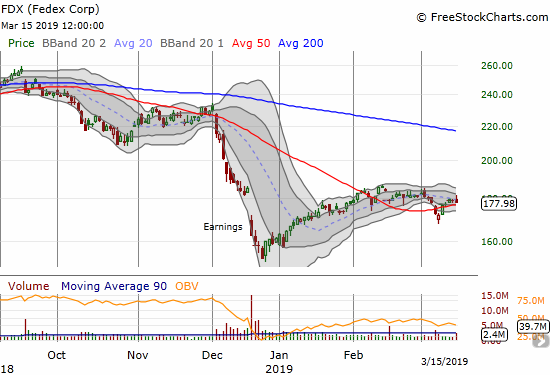
Fedex (FDX)
I chased Fedex (FDX) with put options after it confirmed a 50DMA breakdown. I figured I could be early since the stock was over-stretched below its lower-BB, but I still thought the stock was weak enough to eventually get downward follow-through. Instead, buyers managed to push the stock back above its 50DMA. Now earnings are coming up. While I am bearish on those earnings, I am going to stay on the sidelines and await results before deciding on a fresh move.
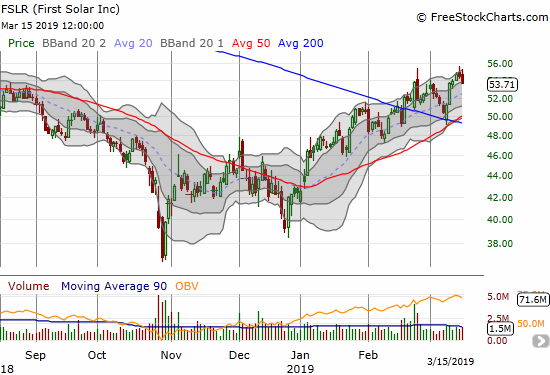
First Solar (FSLR)
I played the bounce off 200DMA support in First Solar (FSLR) with call options. After seeing Thursday’s sign of weakness, I sold half on Friday’s open. I am being “hopeful” as I can see FSLR easily retesting support in short order.
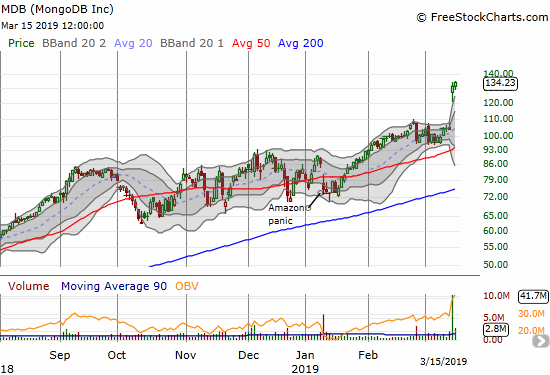
MongoDB (MDB)
At the beginning of February I described a “right direction, wrong trade” in MongoDB (MDB). I thought by the time of earnings, I would get a graceful exit out of the residual short shares and then reposition bullishly. The closest opportunity came with a major one-day decline in cloud and related software stocks in late February. Next came major analyst downgrades March 4. The stock held firm yet again, so I moved to get more bullish on my offsetting call options.
The resulting call spread shifted the monster post-earnings move from an absolute disaster to a small one. A 28.9% post-earnings pop simply was nowhere on my radar! Those previous selling episodes distracted me from what I earlier observed in my posts as an amazing period of large post-earnings moves in certain stocks (this was the genesis of my pre-earnings BBY play).
Yet one more lesson learned: never take my eye off the full spectrum of possibilities and take analyst actions with a large lump of salt! A bonus lesson is to snap trades into alignment with my underlying sentiment as quickly as practical.
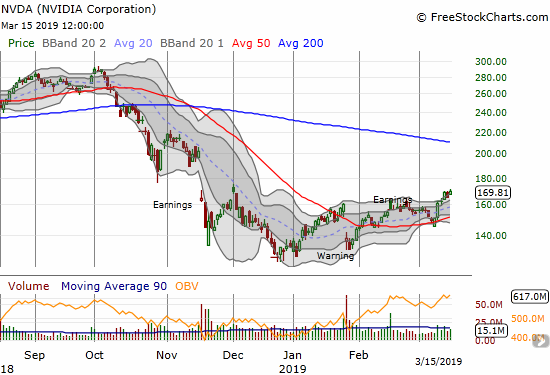
NVIDIA (NVDA)
NVIDIA (NVDA) broke out last week as semiconductors took on new life. I was primed to move so I bought right at Wednesday’s open. I was amazed at the rapid increase in the value of the call options. With a Friday expiration, I took quick profits. Next up is the massive November post-earnings gap down which prompted me to critique Jim Cramer’s revisionist post-earnings “I told you so.“
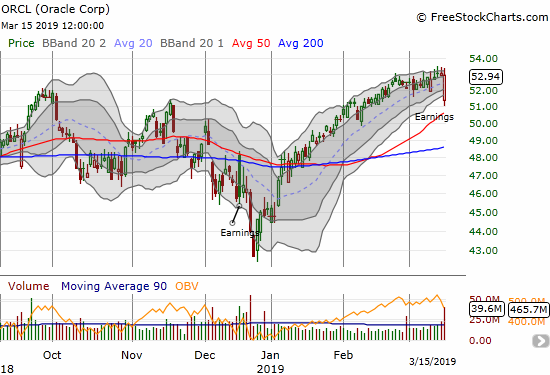
Oracle (ORCL)
If Oracle (ORCL) is any sign, the stock’s post-earnings recovery from a gap down confirms just how weak the sellers can be right now.
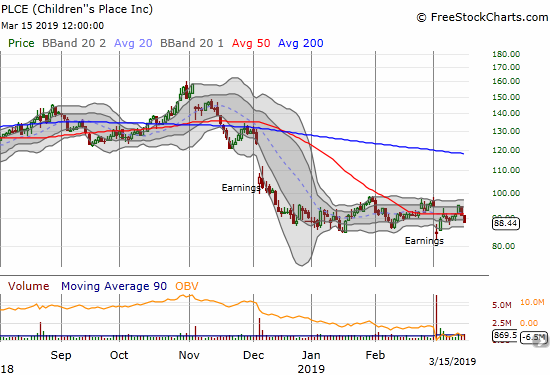
Children’s Place (PLCE)
Children’s Place (PLCE) keeps bouncing around. I am now eyeing the stock for a big breakout or breakdown from what is becoming an extended period of consolidation. I will next trade in the direction of the move out of this consolidation range.
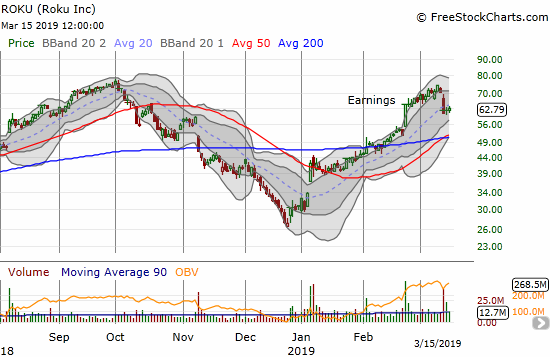
Roku (ROKU)
I remain skeptical of ROKU’s sky-high valuation, and I caught last week’s analyst downgrade while sitting on a net short position. Sellers have yet to follow-through though…
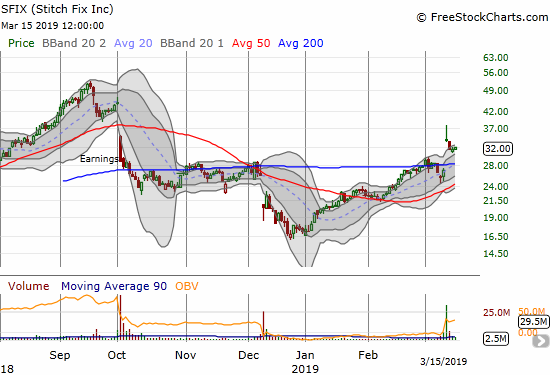
Stitch Fix (SFIX)
Stitch Fix (SFIX) is yet another software play that generated a monster post-earnings move. The stock traded as high as an eye-popping 39.8% before fading back to its opening price. Sellers continued the next day. The momentum moves came to a screeching halt after that. The stock looks like it is setting up for a “calm after the storm”, so I decided to speculate on a call spread in spite of my short-term bearish position on the stock market as a whole.
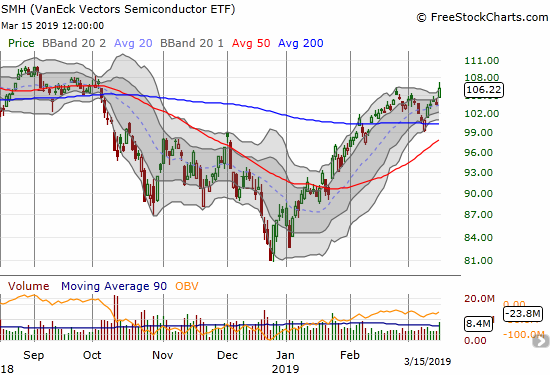
VanEck Vectors Semiconductor ETF (SMH)
VanEck Vectors Semiconductor ETF (SMH) is back to leading the market higher. It closed the week with a breakout and 2.7% gain on Friday. Amazingly, SMH has essentially finished reversing its October breakdown: the beginning of the end of the rally or a sign of more to come? AT40 says the former. The price action of breakouts like SMH’s say the latter…
— – —
FOLLOW Dr. Duru’s commentary on financial markets via email, StockTwits, Twitter, and even Instagram!
“Above the 40” uses the percentage of stocks trading above their respective 40-day moving averages (DMAs) to assess the technical health of the stock market and to identify extremes in market sentiment that are likely to reverse. Abbreviated as AT40, Above the 40 is an alternative label for “T2108” which was created by Worden. Learn more about T2108 on my T2108 Resource Page. AT200, or T2107, measures the percentage of stocks trading above their respective 200DMAs.
Active AT40 (T2108) periods: Day #49 over 20%, Day #47 over 30%, Day #46 over 40%, Day #45 over 50%, Day #5 over 60% (overperiod), Day #8 under 70% (underperiod)
Daily AT40 (T2108)
")
Black line: AT40 (T2108) (% measured on the right)
Red line: Overbought threshold (70%); Blue line: Oversold threshold (20%)
Weekly AT40 (T2108)

*All charts created using freestockcharts.com unless otherwise stated
The T2108 charts above are my LATEST updates independent of the date of this given AT40 post. For my latest AT40 post click here.
Related links:
The AT40 (T2108) Resource Page
You can follow real-time T2108 commentary on twitter using the #T2108 or #AT40 hashtags. T2108-related trades and other trades are occasionally posted on twitter using the #120trade hashtag.
Be careful out there!
Full disclosure: long UVXY calls, long AXGT, long FSLR call, short MDB shares and long call spreads, short ROKU shares and long calls, long SFIX call spread
*Charting notes: FreeStockCharts.com stock prices are not adjusted for dividends. TradingView.com charts for currencies use Tokyo time as the start of the forex trading day. FreeStockCharts.com currency charts are based on Eastern U.S. time to define the trading day.