
AT40 = 54.1% of stocks are trading above their respective 40-day moving averages (DMAs)
AT200 = 38.8% of stocks are trading above their respective 200DMAs
VIX = 16.1
Short-term Trading Call: bearish
Stock Market Commentary
The above tweet begins the dilemmas that lay ahead for short-term trading after I first flipped bearish ahead of Thursday’s selling.
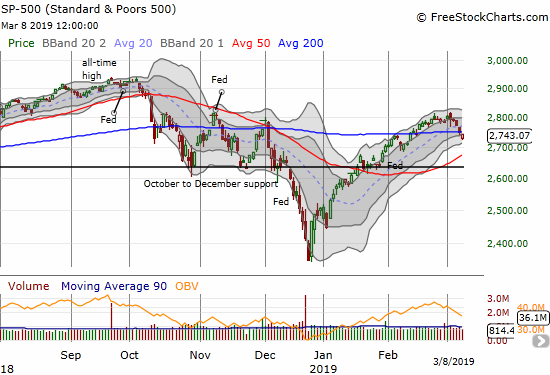
First, I downgraded my short-term trading call from cautiously bearish to bearish thanks to the minor 200DMA breakdown on the S&P 500 (SPY).
The NASDAQ (NDX) broke down below its 200DMA on the same day as the S&P 500. The tech laden index also made a minor confirmation of that breakdown.
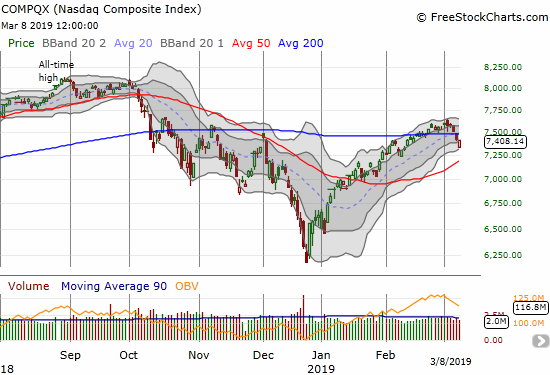
Notice that both major indices have rising 50DMAs which promise to deliver more solid support than the 200DMAs. In other words, this current sell-off is likely to be relatively shallow.
At the same time of these breakdowns, AT40 (T2108), the percentage of stocks trading above their respective 40-day moving averages (DMAs), has fallen so far, so fast, that my favorite indicator has created a trading environment that “feels” oversold. Just six trading days ago, AT40 finally fell out of the 80% overperiod. At the time, I called the moment a “small nick in the ever-lengthening overbought period.” Just two trading days prior, AT40 tumbled out of the overbought period and now trades at 54.1%.
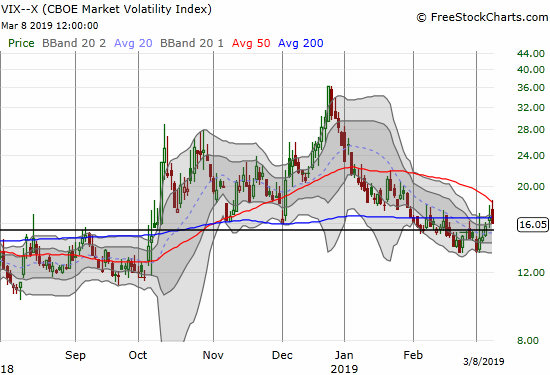
Moreover, with buyers rushing into the breach caused by the opening gap, the volatility index, the VIX, quickly transitioned from a spike higher to a sharp fade lower. This trading action suggests sellers may have already exhausted themselves for now. I sat on my latest tranche of UVXY call options thinking the VIX could follow-through. That decision could end up costing me in the coming week.
I will try to resolve this dilemma by focusing bearish plays on fades at resistance and breakdowns below critical support levels and little to nothing in between. I provide some examples in the chart review below. The prospect of a (short-lived) rebound keeps me interested in a few plays on the long side with bullish setups.
I assume the intraday scramble from fear to hope was related to a shifting interpretation of the jobs report for February. The economy only created 20,000 net jobs in February even as the number of unemployed people dropped by 300,000 (including the return of Federal workers from the government shutdown). These headlines seemed to line the U.S. up for the same trouble burdening other major global economies. With buyers stepping in right at the open, the over-reaction in the pre-market futures trading quickly corrected. I am sure traders listened to narratives of “statistical blip” and “special circumstances given bad weather and the government shutdown.” Nevermind that the pundits providing the lofty consensus expectation of around 170,000 somehow could not take into consideration known factors like the weather and the government shutdown…
Stock Chart Reviews
Advanced Auto Parts (AAP)
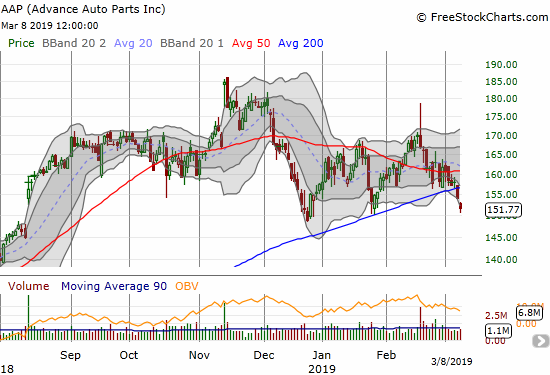
Advanced Auto Parts (AAP) suffered a 200DMA breakdown last week. This bearish move throws fresh doubt on the viability of my position in O’reilly Automotive (ORLY).
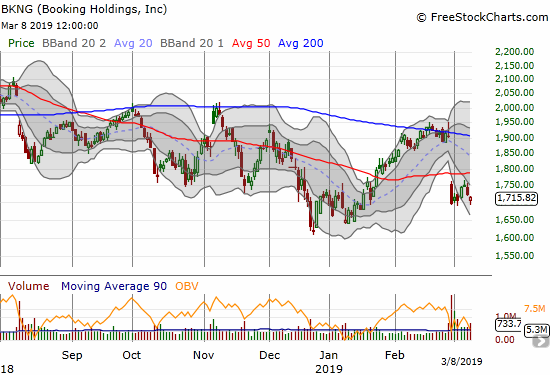
Booking.com (BKNG)
Booking Holdings (BKNG) confirmed 200DMA resistance and suffered a 50DMA breakdown after earnings in February. The stock is a short on a new post-earnings closing low.
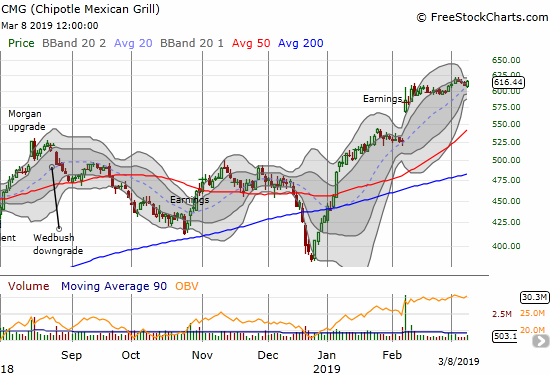
Chipotle Mexican Grill (CMG)
Chipotle Mexican Grill (CMG) continues to drift along with a slight upward bias. The stock is now forming another Bollinger Band (BB) squeeze. I will trade in the direction of its resolution. Note that the last BB squeeze resolved into a post-earnings breakout.
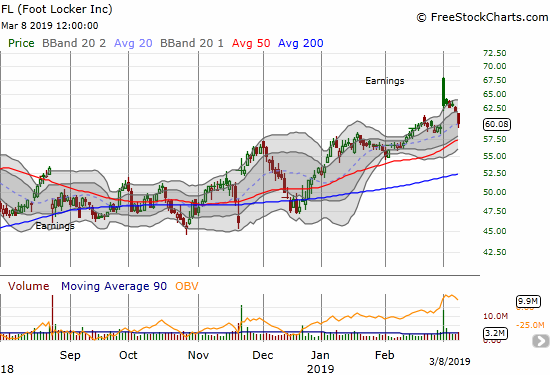
Foot Locker (FL)
I am noticing a number of stocks that gapped up strongly in celebration of earnings only to fade away under the pressure of sellers and profit-takers. Foot Locker (FL) is the latest victim. On Friday, it finished reversing its gap up. I covered FL as a potential “calm after the storm” play. Now that the stock filled its gap, I need to see some stabilization above 50DMA support to get interested in buying. The stock is a short on a close below the 50DMA.
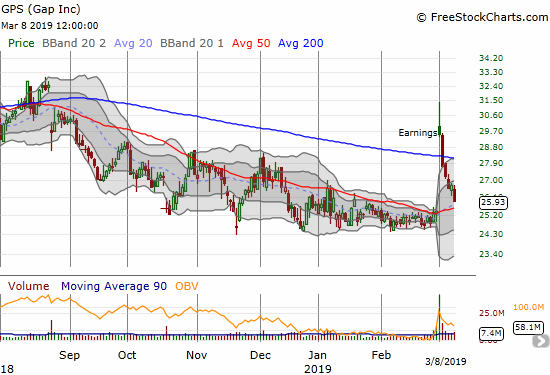
Gap (GPS)
Gap (GPS) is another stock suffering a dramatic post-earnings gap and crap. Given the downtrend going into earnings, I am not interested in trying to play a rebound on this one at this juncture.
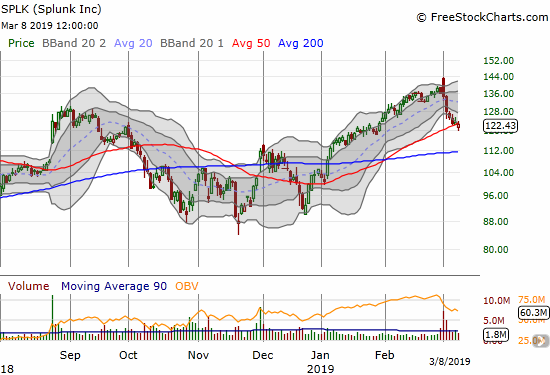
Splunk (SPLK)
Splunk (SPLK) followed through with its topping pattern. The selling became small but orderly last week. After my put spread closed at its target profit, I am now looking for signs of buyers trying to hold the line at 50DMA support.
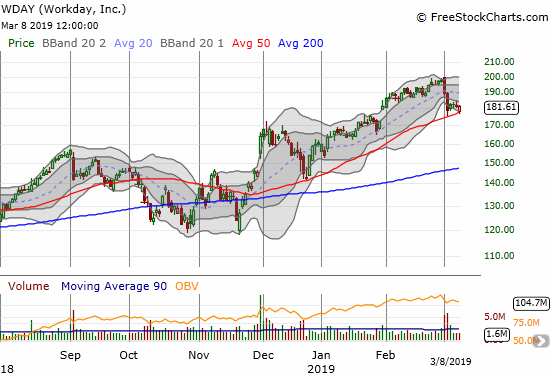
Workday (WDAY)
Workday (WDAY) is trying to hold the line at 50DMA support after it suffered a rapid post-earnings decline. I would only play WDAY from the long side on a close above its lower Bollinger Band. I would short the stock on a new post-earnings low (and 50DMA breakdown).
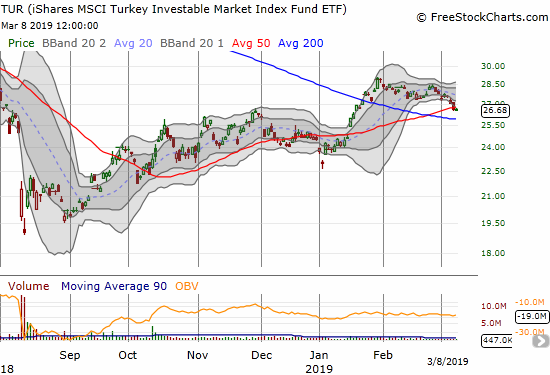
iShares MSCI Turkey ETF (TUR)
I threw in the towel on my trade in iShares MSCI Turkey ETF (TUR). While the ETF still trades above its 200DMA, I consider the 50DMA breakdown an early warning sign that this trade is not going to work as desired. The narrative of slowing global growth makes TUR too risky to continue holding here.
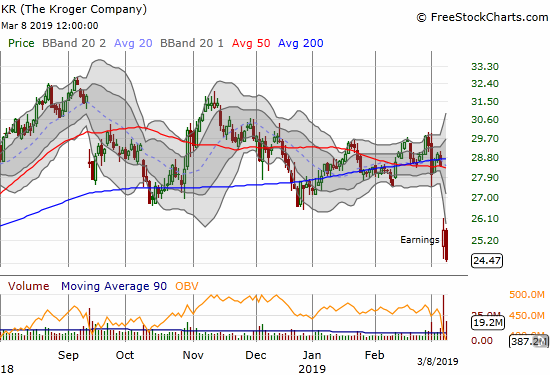
Kroger (KR)
Kroger (KR) is under pressure again. A big post-earnings breakdown took the stock down to a 9-month low. The stock was consolidating into this breakdown, so I do not expect the stock to recover anytime soon. Indeed, sellers returned right away to the stock on Friday to punch in a new post-earnings low.
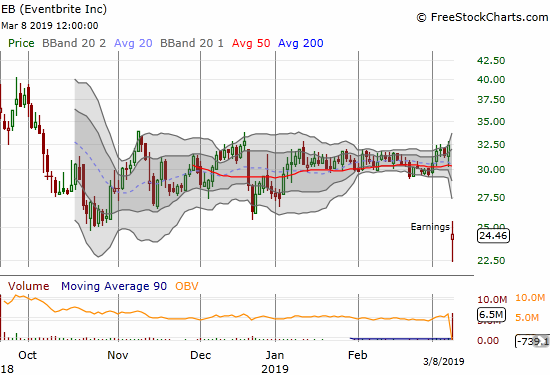
EB (Eventbrite)
Eventbrite (EB) was one of several recent IPOs whose extended consolidation captured my interest. The company’s earnings was pretty much a disaster with the stock closing at an all-time low. Needless to say, EB is now a broken stock and one to fade on a rally.
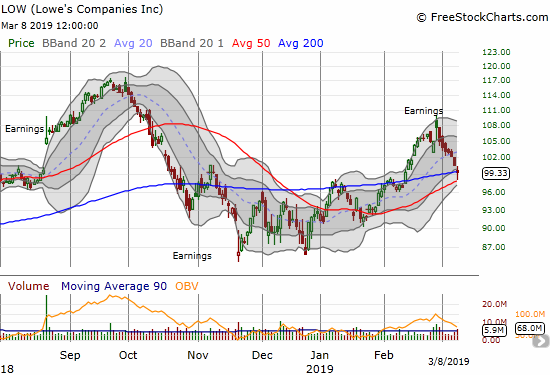
Lowe’s Companies (LOW)
Lowe’s Companies (LOW) was looking good after earnings even with an intraday low that at one point erased the entire gain on the day. Sellers have not stopped since then. When I lasted pointed to LOW I noted it as an example of a stock I considered trading on the bullish side of a test of rising/converged support at its 50 and 200DMAs no matter the signal from AT40. That time has already arrived. The easy stop (and potential flip to a short) is a close below 50DMA support.
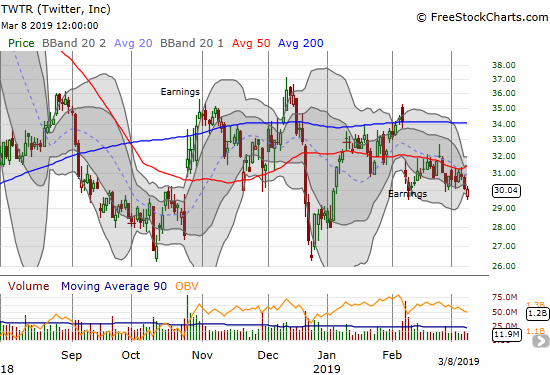
Twitter (TWTR)
Twitter (TWTR) is slipping away from its 50DMA after a failed attempt at a post-earnings recovery. TWTR is looking like a stock that will just stay stuck in an extended trading range. It is time for me to consider selling call options against my long position (see my post on Tesla (TSLA) trading strategies for an explanation of the approach).
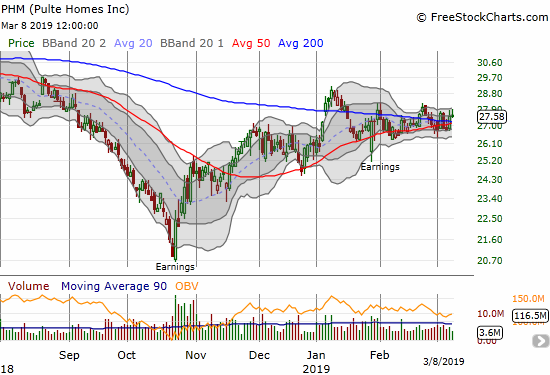
Pulte Home (PHM)
Pulte Home (PHM) is still consolidating around its 50 and 200DMAs. I was hoping to play this stock as a late seasonal play (trading season ends sometime between now and April) but time is running out now.
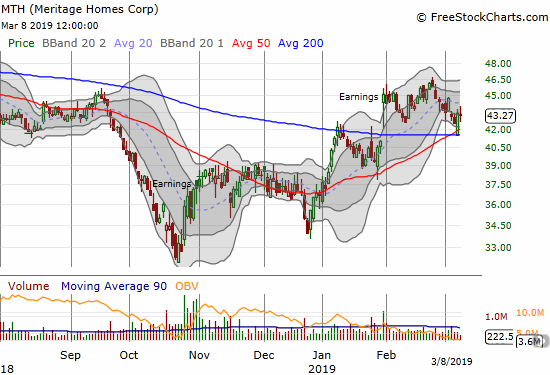
Meritage Homes (MTH)
Meritage Homes (MTH) printed an impressive bounce off its converged 50 and 200DMA support. However, like PHM, the quickly expiring time for the seasonal home builder trade is keeping me from betting on a test of the recent high around $46.
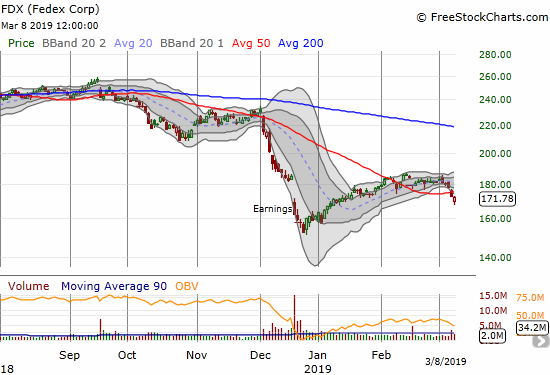
Fedex (FDX)
Fedex (FDX) printed a bearish 50DMA breakdown last week. There is nothing but air underneath this stock, so I bought puts in anticipation of a resumption in selling.
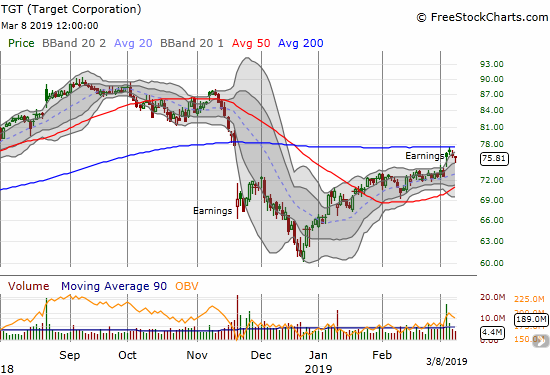
Target Corporation (TGT)
Target Corporation (TGT) ran into a brick wall at 200DMA resistance. If buyers do not step up soon, TGT may soon suffer the same fate as Lowe’s Companies (LOW).
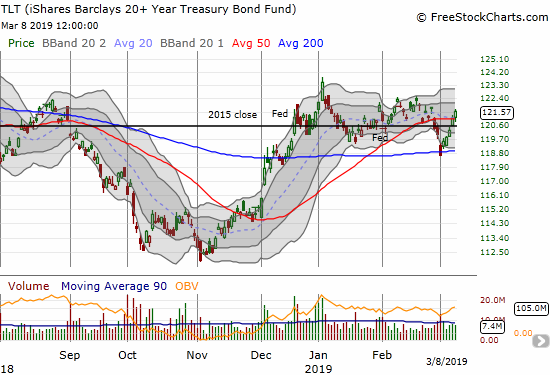
iShares 20+ Year Treasury Bond ETF (TLT)
The iShares 20+ Year Treasury Bond ETF rallied all week long. I accumulated TLT puts as a kind of hedge of stock market strength. I am assuming bond yields will trend higher again if signs of economic/market strength show up again. This is a small hedge on getting caught with bearish positions on a sudden upside surprise from, say, the US-China trade front.
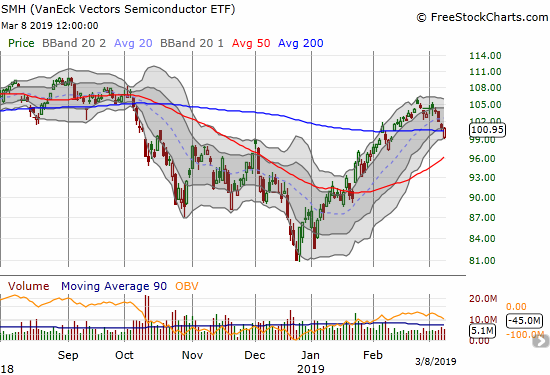
Semiconductor Hldrs ETF (SMH)
The Semiconductor Hldrs ETF (SMH) made its own 50DMA breakdown but bounced back quickly. If a market bounce is in the cards, semiconductors look ready to lead the way higher.
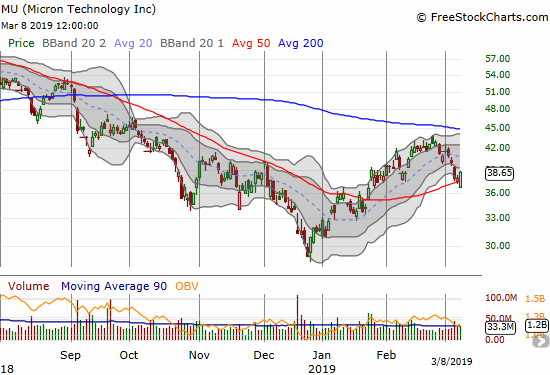
Micron (MU)
Micron (MU) is one of those semiconductor stocks that looks ready to lead a market rebound if one is coming. If the stock continues higher on Monday, I will buy call options. I have added MU to my small basket of stocks to play from the long side. I have not yet figured out a good trading pattern, but, like Apple (AAPL), an aggressive stock buyback makes this stock an attractive swing play candidate with weekly call options.
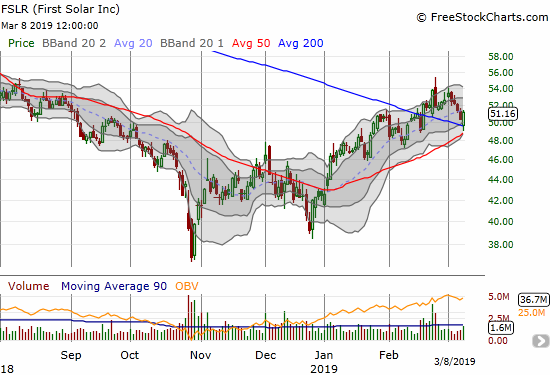
First Solar (FSLR)
First Solar (FSLR) is shining in an otherwise bearish setup for the market. Like MU, I am eyeing going long here if the stock continues higher on Monday. FSLR looks like it made a strong and successful test of converging support…the stock just needs confirmation.
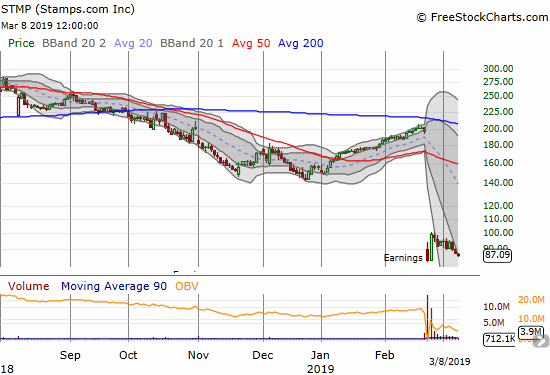
Stamps.com (STMP)
Stamps.com set up for a short after it failed resistance from the top of its lower Bollinger Band. I actually got a little ahead of the move and bought a put spread several trading days before the bearish confirmation.
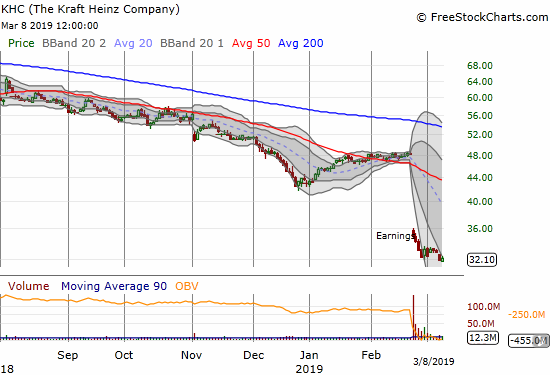
The Kraft Heinz Company (KHC)
Big money investors are clearly not done dumping the Kraft Heinz Company (KHC). After a brief consolidation, the stock ran into resistance at the top of its lower Bollinger Band and dropped to a new all-time low.
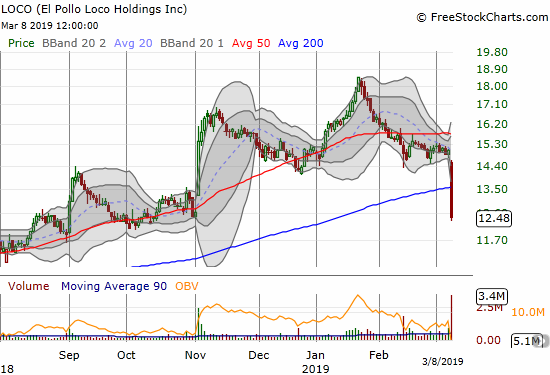
El Pollo Loco Holdings (LOCO)
El Pollo Loco Holdings (LOCO) suffered significant technical damage post-earnings. The “chicken trade” came to a screeching halt with this breakdown. Normally, I would be angling to buy the dip, but this stock is flagging a warning signal for now.
— – —
FOLLOW Dr. Duru’s commentary on financial markets via email, StockTwits, Twitter, and even Instagram!
“Above the 40” uses the percentage of stocks trading above their respective 40-day moving averages (DMAs) to assess the technical health of the stock market and to identify extremes in market sentiment that are likely to reverse. Abbreviated as AT40, Above the 40 is an alternative label for “T2108” which was created by Worden. Learn more about T2108 on my T2108 Resource Page. AT200, or T2107, measures the percentage of stocks trading above their respective 200DMAs.
Active AT40 (T2108) periods: Day #44 over 20%, Day #42 over 30%, Day #41 over 40%, Day #40 over 50% (overperiod), Day #2 under 60% (underperiod), Day #3 under 70%
Daily AT40 (T2108)
")
Black line: AT40 (T2108) (% measured on the right)
Red line: Overbought threshold (70%); Blue line: Oversold threshold (20%)
Weekly AT40 (T2108)

*All charts created using freestockcharts.com unless otherwise stated
The T2108 charts above are my LATEST updates independent of the date of this given AT40 post. For my latest AT40 post click here.
Related links:
The AT40 (T2108) Resource Page
You can follow real-time T2108 commentary on twitter using the #T2108 or #AT40 hashtags. T2108-related trades and other trades are occasionally posted on twitter using the #120trade hashtag.
Be careful out there!
Full disclosure: long UVXY call, long STMP put spread, long TLT puts, long FDX puts, long TWTR shares, long ORLY
*Charting notes: FreeStockCharts.com stock prices are not adjusted for dividends. TradingView.com charts for currencies use Tokyo time as the start of the forex trading day. FreeStockCharts.com currency charts are based on Eastern U.S. time to define the trading day.