
AT40 = 11.7% of stocks are trading above their respective 40-day moving averages (DMAs) (hit an intraday low of 9.4%, oversold day #3)
AT200 = 32.3% of stocks are trading above their respective 200DMAs (intraday low of 30.0%)
VIX = 21.3 (a decrease of 14.7%)
Short-term Trading Call: bullish
Commentary
AT40 (T2108), the percentage of stocks trading above their respective 40-day moving averages (DMAs), fell as low as 9.4% on Friday. AT40 dropped as low as 8.6% intraday during the February swoon (February 9, 2018 to be exact). Since 1986, AT40 has closed below 9.4% only 92 trading days, and AT40 last closed below this level on January 21, 2016 at 8.3%. The day before that, AT40 closed at 7.4% and traded as low as 3.8%. AT40 obviously cannot trade much lower than these levels.
AT200, the percentage of stocks trading above their respective 200DMAs, is very important now as an oversold gauge. AT200 closed the week at 32.3%. In January, 2016, AT200 managed to get as low as 9.0%, a level last seen around the historic March, 2009 bottom. In other words, while AT40 suggests the market is set up for a sustained bounce, AT200 reminds me that these oversold extremes can get yet more extreme if panic gets a fresh heaping of fuel.
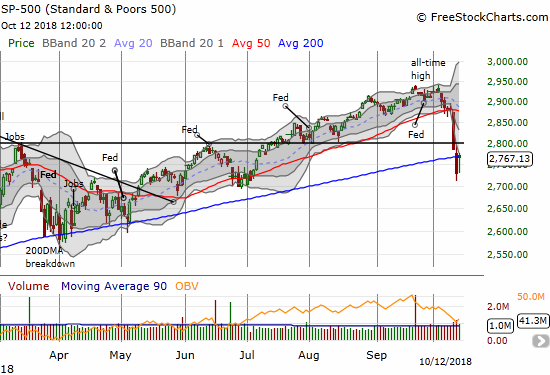
Trading action around important technical levels also remind me that the market could go lower. The S&P 500 (SPY) is essentially back to flat for the year but is still 7.2% above this year’s double bottom. A retest will be in play if the index fails to win what is perhaps the stock market’s most important battle: a test of 200DMA support. During the February swoon, the S&P 500 only ONCE closed below its 200DMA. The index closed below its 200DMA on Thursday and set up Friday’s drama. The index gapped up just above its 200DMA in an effort to clear out bearish sentiment. Sellers quickly closed the gap and then failed to take the index lower. Buyers fought off a test of the intraday low and managed to churn the index toward the day’s open for a 1.4% gain on the day. It was a messy way to demonstrate the importance of the 200DMA! If buyers can follow through early this coming week, the technical pattern will look like a (short-term) washout of the market’s most motivated and panicked sellers. I call this a conditional reprieve in the middle of oversold conditions because of the criticality of this 200DMA pivot.
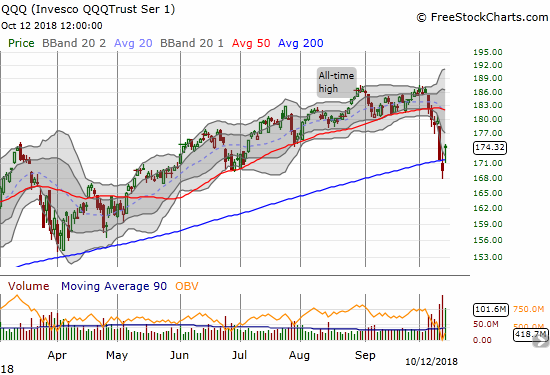
The NASDAQ had a battle similar to the S&P 500’s; the main difference came with an intraday pullback that did not create a complete reversal of the gap up. The Invesco QQQ Trust (QQQ) did not fully reverse its gap above the 200DMA. Its 2.8% gain on the day has the look of a successful, and bullish, reversal of a 200DMA breakdown.

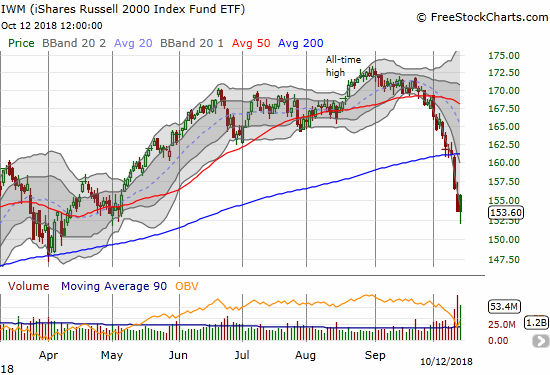
While the big indices fared well at the end of the day, other indices did not. Their poor performance underlined Friday’s conditional reprieve. Some of these sectors need to wake up to help the stock market mount a credible and sustainable bounce out of oversold conditions.
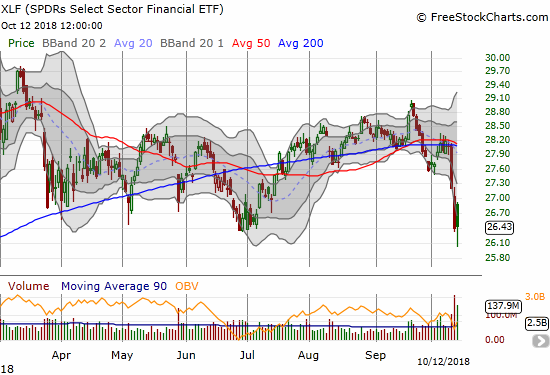
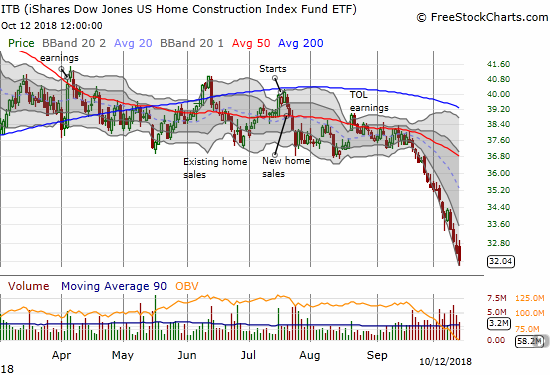
The faders managed to keep these indices plastered with bearish sentiment. The iShares Russell 2000 ETF (IWM) closed flat after sellers completely reversed the opening gap up. The Financial Select Sector SPDR ETF (XLF) suffered a similar fate. This disappointment was even more critical given the wake of bank earnings from the likes of JP Morgan Chase (JPM). The iShares US Home Construction ETF (ITB) held no pretense of recovery as its fade resulted in a 1.0% loss and fresh 17-month low. ITB has dropped 17 of the last 18 trading days in a sign of a near complete market retreat from home builders.
As suggested by the breadth indicators, the sell-off is causing broad damage. The Health Care Select Sector SPDR ETF (XLV) had a solid uptrend coming out of the February swoon. XLV even broke out to a new all-time high in late August. Last week, XLV broke down solidly below its 50DMA support and nearly reversed all its gains from the breakout.

The volatility index, the VIX, dropped 14.7% to 21.3. The intraday high failed to top Thursday’s intraday high: a small positive for volatility faders. Still, the VIX is still considered elevated given its perch above 20.

The VIX typically serves as a gauge of fear on the high side and complacency on the low side. If we had an equivalent for government economic policies, say a “GIX”, the GIX might be at record lows. Confidence is of course half the battle of economic performance and confidence is tangibly oozing from D.C. (from one side anyway!). With consumer confidence at record levels, unemployment down to historic levels, and economic growth impressively strong, the rhetoric accompanying policymakers represents a euphoria perhaps only matched by the complacency of the “Great Moderation” when the Federal Reserve (mostly under Chair Alan Greenspan) was heralded for ushering in a time of lasting economic prosperity…just ahead of the Great Recession. If you knew nothing about economics, you might conclude this time around that the U.S. really has figured out how to repeal the laws of economic cycles.
In particular, Larry Kudlow, the leader of President Trump’s National Economic Council, is beating a steady drum of unapologetic and triumphant confidence. In a CNBC interview, Kudlow issued a sound bite that *I* am confident will one day in the not-so-distant future sound cringeworthy to those of us who follow economics. Kudlow declared: “We are in a hot economic boom. There’s no end in sight.”
Other key points from this interview…
- Not worried about the Fed killing the economy. It has staying power. {Me: This message is consistent with Treasury Secretary Mnuchin’s reassurances about monetary policy. Contrast these claims with President Trump’s worries over rate hikes.}
- Biggest blue collar employment boom since the 1980s.
- In 2018, U.S. entered an economic boom that no one thought was possible.
- Loves the skepticism. Proved the skeptics quite wrong. Don’t think that’s going to change.
I fully understand why Kudlow is blowing the trumpets and beating the drums. For example, the display is an “eye-for-an-eye” response to the shrill skeptics who denounced the policies that helped kicked the economy into a higher gear. However, as an investor and particularly as a trader, I cannot help but think about the contrary implications of important government officials claiming that the economic good times will continue as far as the eye can see. Such claims defy experience and the laws of economic/business cycles. Such claims help form a foundation of hubris which can lead to policy errors. My unavoidable wariness feels even more poignant when in parallel I stare at charts showing a stock market violently and sharply falling off its all-time highs. I am not worried about over-optimism today or this quarter, but it is something that makes me stand up and take notice. (At the end of the chart review, I include a link to a Bloomberg Politics video for more context on Kudlow’s economic triumphalism).
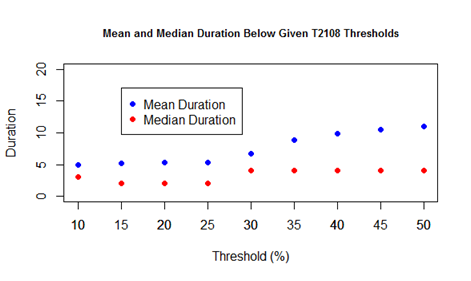
For now, I am keenly focused on my strategy for trading oversold market conditions. The stock market is on day #3 of oversold conditions. The average oversold period lasts about 5 days and the median is around 2 (50% below 2 and 50% above 2). At the current oversold depths, it could easily take another 2 or 3 days to climb out of trouble. The longer an overperiod lasts, the more bearish the implications. Similarly, the more frequently the market returns to oversold conditions, the more bearish the implications. The drama at the 200DMAs is extremely important context for these bearish implications. A stubbornly oversold market with an S&P 500 and NASDAQ below 200DMAs is a recipe for fading rallies.
The drama at the 200DMAs made me a little less aggressive. I sold my S&P 500 call options immediately after the open. I added to my Caterpillar (CAT) put options. I took profits in other bullish positions. I selected two small fades with a short on Roku (ROKU) which was up as much as 10% at one point, and I bought shares in Direxion Daily Russia Bear 3X ETF (RUSS). On the bullish side, I doubled down on put options on the ProShares Ultra VIX Short-Term Futures (UVXY) and opened a calendar call spread on Nvidia (NVDA). I become an aggressive buyer of SPY and QQQ call options on a combination of indices trading well below their lower Bollinger Bands (BB), volatility surging, and AT40/AT200 reaching toward historic oversold lows. Again, with earnings season coming up, I am leery of taking on a lot stock-specific risk as part of the oversold trading strategy.
CHART REVIEWS
Apple (AAPL)
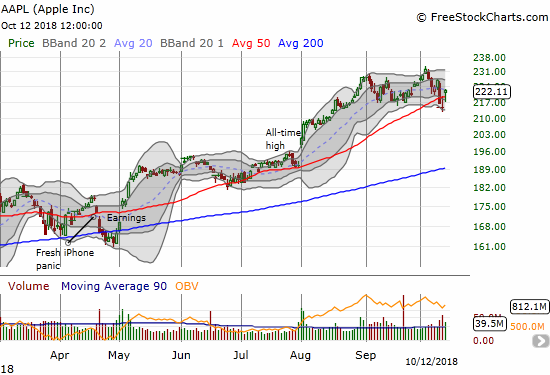
There are a few encouraging stocks left among the carnage. AAPL is the most important stock of that thinning crew. On Wednesday, AAPL closed below its 50DMA for the first time since June. Friday’s gap up and gain of 3.6% was made all the more bullish by the ability of buyers to close AAPL near its intraday high. AAPL can even still “see” its all-time high just up the street…
Autodesk (ADSK)
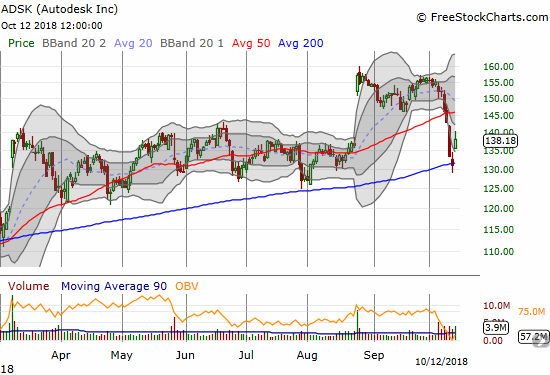
ADSK gained 5.6% on a very nice gap up and bounce from 200DMA support. With successful support inside the previous consolidation range, ADSK looks like a buy (outside of pre-earnings risk of course).
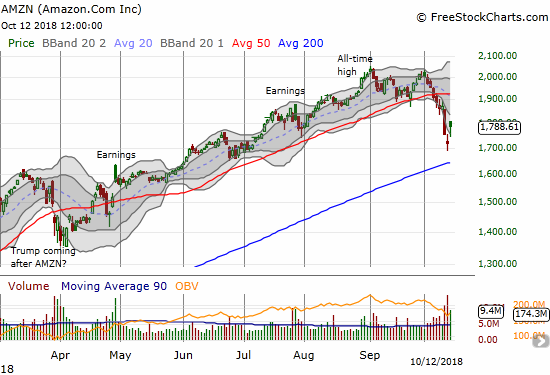
Amazon.com (AMZN)
AMZN now has a “barbell” of bearishness and bullishness. The stock’s 50DMA breakdown confirmed a double-top. Friday’s 4.0% gain and gap up created an abandoned baby bottom. I would be more impressed if the bottom occurred closer to 200DMA support which I thought needed testing before AMZN could sustain upward momentum.
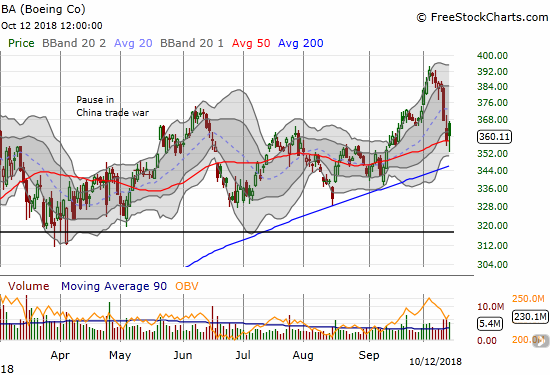
Boeing (BA)
BA is one of the holdouts of strength in the sell-off. While the stock faded from its high on Friday, it held 50DMA support for the second straight day.
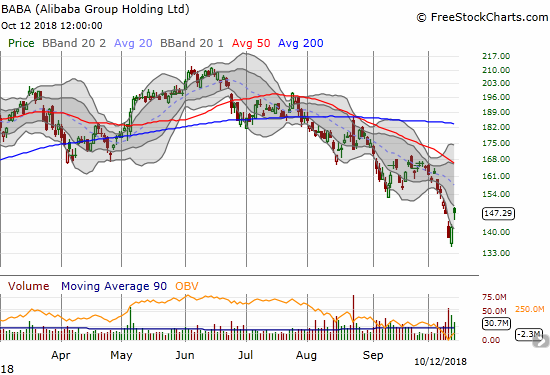
Alibaba Group Holdings (BABA)
BABA may have finally bottomed in time for a run-up to November’s Single’s Day in China. The bottom started with a surge of buying off Thursday’s intraday and 16-month low. I am anticipating at minimum a return to the top of the current downtrend channel defined by the 20 and 50DMAs.
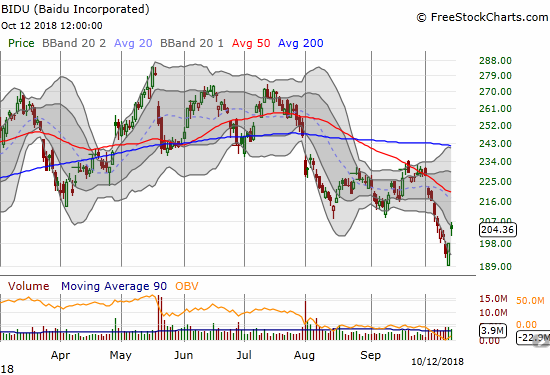
Baidu (BIDU)
BIDU gapped up for a 3.2% gain that looks very similar to BABA’s. The first upside target is the downtrending 50DMA.
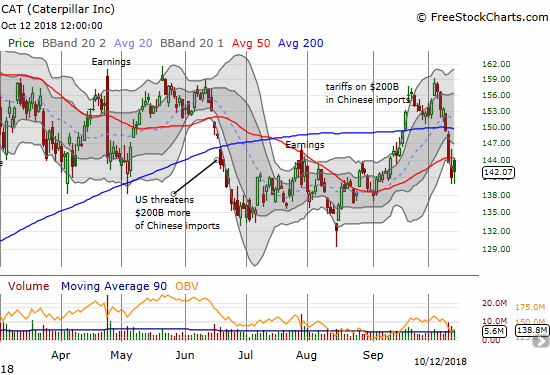
Caterpillar (CAT)
So much for the 200DMA breakout. CAT topped out right at the top of the previous consolidation period that dominated trading in the immediate aftermath of the February swoon. CAT broke down below its 50DMA and is at risk for retesting its 2018 low if bearish sentiment prevails in the market. This positioning makes CAT an even better hedge.
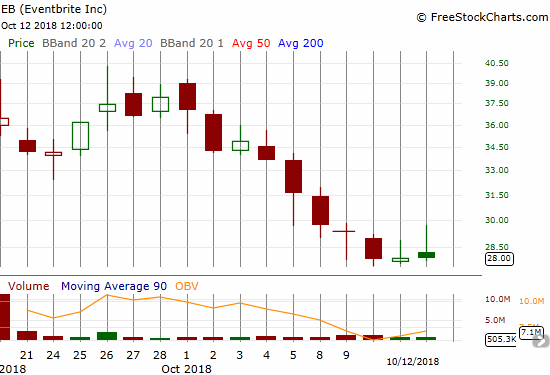
EventBrite (EB)
A swath of recent IPOs had the misfortune of rolling out in the past few weeks. In a sign of the times, many traders and investors rushed in and bid these stocks to lofty and extremely optimistic post-IPO gains just ahead of the sell-off. EB is one of those stocks. The stock has traded nearly straight down since peaking at the end of September. The stock closed the week within $5 of its IPO price of $23.
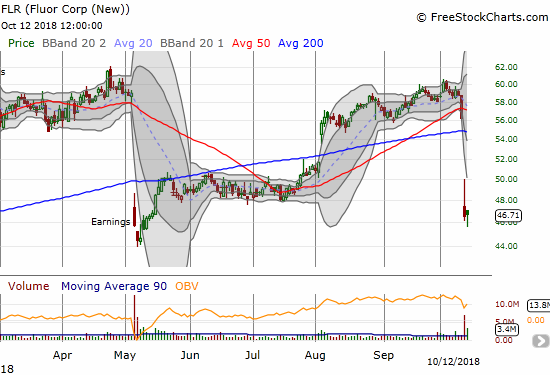
Fluor (FLR)
FLR is the latest post-earnings disaster that has investors bracing themselves this earnings season. I started listening to the conference call explaining the pre-earnings warning to gather up clues and lessons about the economic environment. I am almost halfway through my review and have only heard company-specific issues. I am fascinated by the outright negativity and even despair I heard from analysts on the call. I hope to do a separate write-up on the FLR news. My teaser for that post: I think FLR is a buy on the discount.
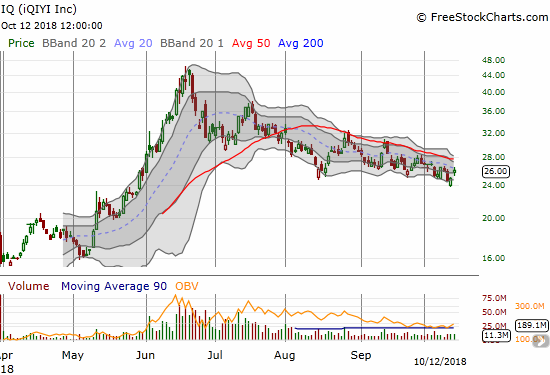
Iqiyi (IQ)
IQ is called the Netflix (NFLX) of China. Given NFLX’s nearly unquestioned success that equation makes IQ a near automatic buy. I was an early buyer and sold in the low 30s after what I thought was an unsustainable and nearly parabolic run-up. I am glad I stayed patient before buying back in. Right now, I am focused on playing the trading channel. If IQ gets back to the low 20s, I will start building a core position again.
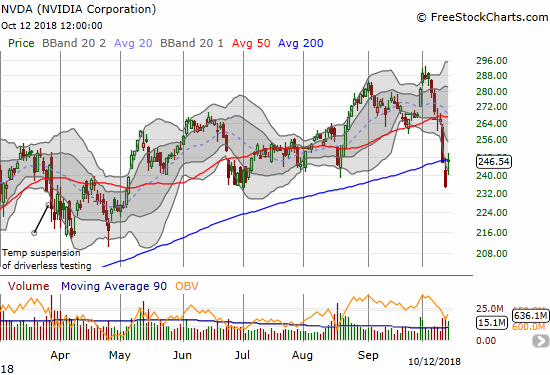
Nvidia (NVDA)
I meant to dive into NVDA in Thursday’s sell-off. I still bought into the gap up as I can see NVDA quickly rallying back to its 50DMA as market sentiment improves. I bought a calendar call spread to provide enough time for the trade to work and eliminate a lot of the premium for high volatility.
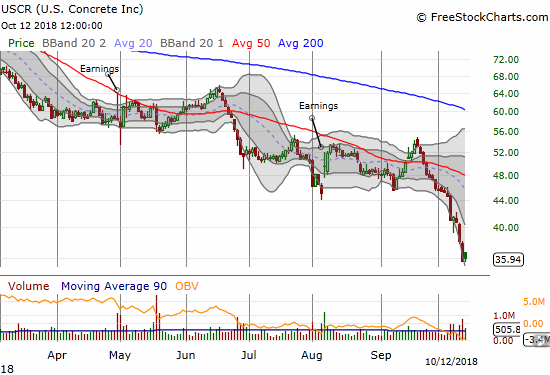
U.S. Concrete (USCR)
USCR is another “my bad” situation. I talked the praises of USCR based on two interviews I conducted with the CEO. The last interview was in April. At that time, the stock was bottoming as part of a recovery from the February swoon. A 50DMA breakout soon thereafter seemed to validate the buying opportunity. Unfortunately, June brought a fresh breakdown. October has so far delivered a near collapse in the stock of 21.6% in just these first two weeks. USCR is now down 57.0% year-to-date and is trading at a 3 1/2 year low. Of course the stock looks like an even better bargain, but I am no longer interested in fighting the market. I am reverting to technicals by waiting for buyers to return and confirm renewed interest. Until then, USCR has more downside risk to $25 around which the stock consolidated in 2014.
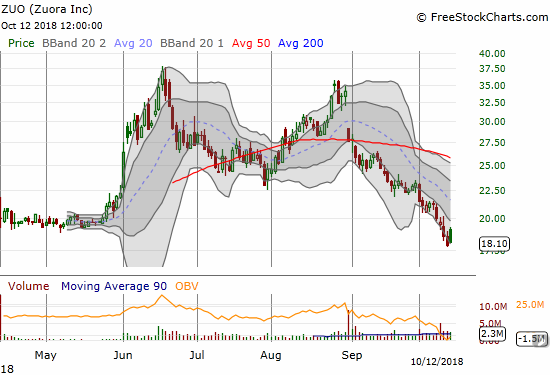
Zuora (ZUO)
Zuo is one of the many “cloud” stocks falling from favor in this risk off environment. ZUO broke to an all-time low last week. Its IPO price was $14. I have a strong feeling a LOT of speculative IPOs from this year will not stop selling off until they make all-time lows or even reach/pass their IPO prices.
Bonus material: The U.S. economy is “crushing it” (August 16, 2018)
(Video only available directly on YouTube)
Some key quotes from Kudlow’s monologue…
- “By far, the single biggest event….this year is an economic boom that most people thought would be impossible to generate…a genuine economic boom.”
- “Confidence is everything”
- “…our economy, our investors, our workforce are crushing it right now. We are crushing it….any business economist worth their salt will tell you we’re going for a while.”
- “We’re in the early stages here. We’re in the early innings. We’ve never had a cap goods boom, and now we’re starting one.”
- “The single biggest story this year is an economic boom that is durable and lasting and that most people thought was impossible and they were wrong.”
— – —
FOLLOW Dr. Duru’s commentary on financial markets via email, StockTwits, Twitter, and even Instagram!
“Above the 40” uses the percentage of stocks trading above their respective 40-day moving averages (DMAs) to assess the technical health of the stock market and to identify extremes in market sentiment that are likely to reverse. Abbreviated as AT40, Above the 40 is an alternative label for “T2108” which was created by Worden. Learn more about T2108 on my T2108 Resource Page. AT200, or T2107, measures the percentage of stocks trading above their respective 200DMAs.
Active AT40 (T2108) periods: Day #3 under 20% (oversold), Day #3 under 30%, Day #10 under 40%, Day #15 under 50%, Day #31 under 60%, Day #84 under 70%
Daily AT40 (T2108)
")
Black line: AT40 (T2108) (% measured on the right)
Red line: Overbought threshold (70%); Blue line: Oversold threshold (20%)
Weekly AT40 (T2108)

*All charts created using freestockcharts.com unless otherwise stated
The charts above are my LATEST updates independent of the date of this given AT40 post. For my latest AT40 post click here.
Related links:
The AT40 (T2108) Resource Page
You can follow real-time T2108 commentary on twitter using the #T2108 or #AT40 hashtags. T2108-related trades and other trades are occasionally posted on twitter using the #120trade hashtag.
Be careful out there!
Full disclosure: long UVXY puts, long AAPL calendar call spread, long AMZN call, long BA put spread, long BABA call spreads, long BIDU call spreads, long CAT puts, long ITB calls and calendar call spread, long NVDA call spread, long USCR
*Charting notes: FreeStockCharts.com stock prices are not adjusted for dividends. TradingView.com charts for currencies use Tokyo time as the start of the forex trading day. FreeStockCharts.com currency charts are based on Eastern U.S. time to define the trading day.