
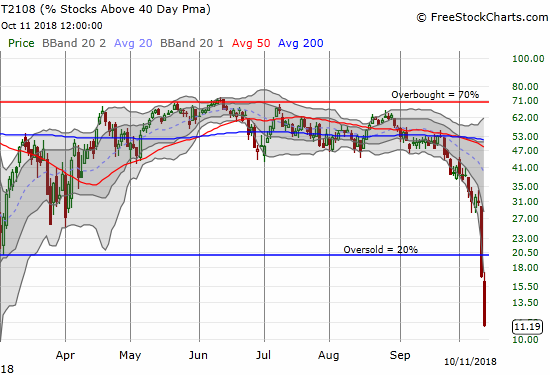
AT40 = 11.2% of stocks are trading above their respective 40-day moving averages (DMAs) (oversold day #2)
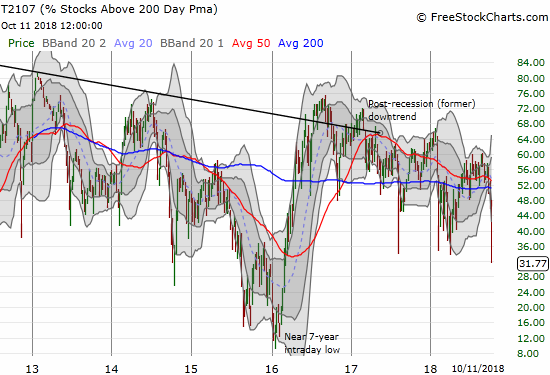
AT200 = 31.7% of stocks are trading above their respective 200DMAs ()
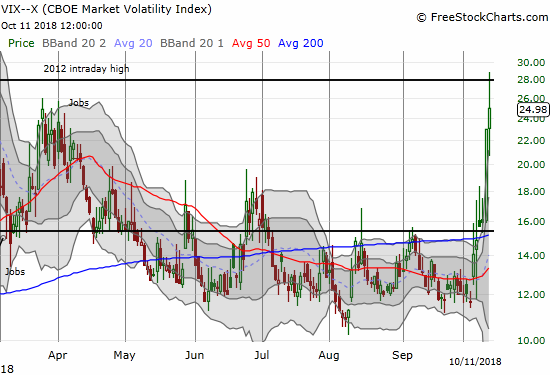
VIX = 23.0 (an increase of 44.0%)
Short-term Trading Call: bullish
Commentary
The market sell-off is unfolding quickly. AT40 (T2108), the percentage of stocks trading above their respective 40-day moving averages (DMAs), plunged ever deeper into oversold territory. This time AT40 fell from 16.7% to 11.2% to end the day at closing levels last seen during the epic January, 2016 sell-off.
Now that AT40 is so low, AT200 (T2107), the percentage of stocks trading above their respective 200DMAs, becomes a lot more important to monitor as an indicator of longer-term health. The weekly chart below shows the multi-year overall downtrend is well-intact. So just like almost every other rally from oversold levels, I expect the next rally to end at an even lower AT200 high. For now, the question is just how much lower will sellers push AT200.
As the breadth indicators continue to drop deeper into oversold territory, the major indices are following gravity into new or worse breakdowns. The S&P 500 (SPY) wasted little time in breaking down below its 200DMA. The index stretched further below its lower Bollinger Band (BB) as it neared flatline with its 2017 closing price.
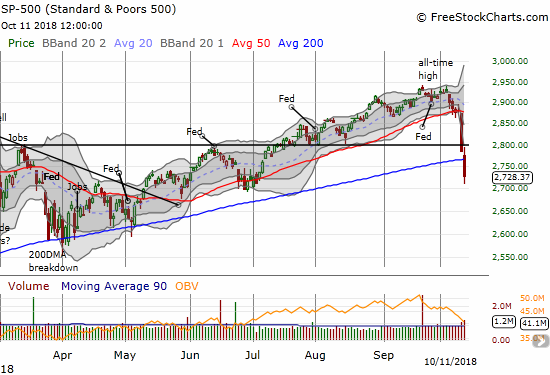
Note well that for 2018 there has only been ONE Fed meeting where the S&P 500 did not tumble soon thereafter. The February swoon was of course the worst incident as the panicked selling started the day after. This time around, the panic took six trading days to get started.
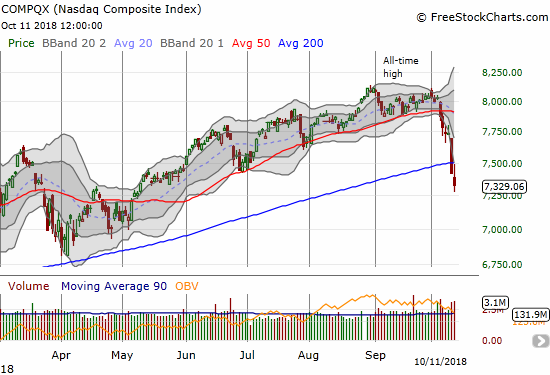
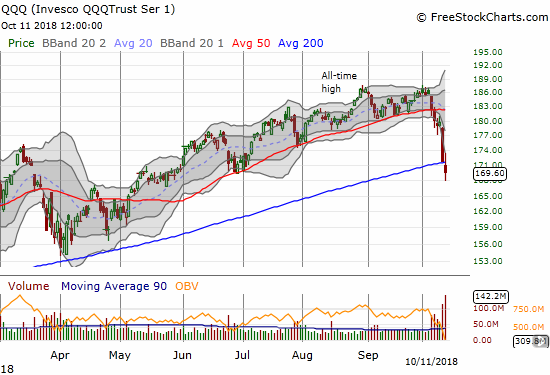
The NASDAQ extended its 200DMA breakdown with a 1.3% loss. The Invesco QQQ Trust (QQQ) gave up its 200DMA support with a 1.2% loss.
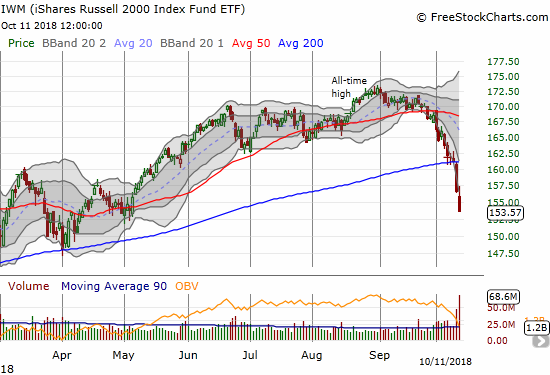
Small caps are leading the way in erasing 2018’s gains. The iShares Russell 2000 ETF (IWM) lost another 1.9% and closed just one point above its 2017 close.
Much to my dismay, the volatility index continued higher today. The VIX gained 8.8% and was up as much as 25.6%. While the volatility faders were active for the 5th of 6 trading days, the VIX’s momentum is clearly higher. I added to my put options on ProShares Ultra VIX Short-Term Futures (UVXY) by rule, but the prospects for profits by next Friday are dimming.
I made my first purchase of call options on SPY soon after the index broke down below its 200DMA. Per the aggressive oversold trading strategy, I will continue adding to this position during the oversold period. However, I started with an expiration for next Friday, so it is possible I will be forced to reset my strategy (likely for November expiration). Until then, I will only add after the VIX has spiked at least 10% from my last purchase. At some point (soon?), I will also buy shares of ProShares Ultra S&P500 (SSO) to hold through the extent of the recovery from oversold conditions. Given the extent of the technical damage across the entire market, I have to assume a new bearish phase is unfolding where I will be setting price targets for taking profits at important resistance levels. Still, shorting at key resistance will be very case dependent.
CHART REVIEWS
Disney (DIS)
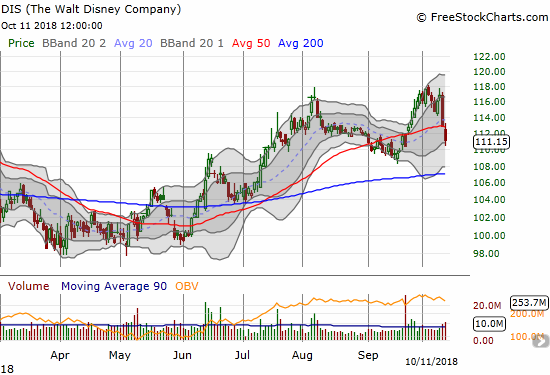
I am a long-term bull on Disney, so am looking to load up on the cheap. So far, DIS is holding up relatively well, and I have not jumped aboard just yet. I am targeting long-term call options expiring January, 2020. DIS broke through its 50DMA support but is one of the minority of stocks still trading comfortably above its 200DMA support.
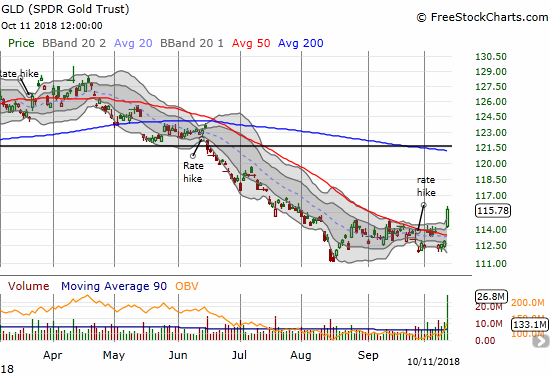
SPDR Gold Shares (GLD)
The fear in the market is now deep enough to stir up fresh interest in gold. GLD popped 2.5% for a 2+ month closing high. GLD made a double breakout: above its 50DMA resistance and above a 2-month consolidation period. I immediately moved to buy a call spread on GLD to add to my core position in GLD shares. I did not buy calls outright because I am worried that an implosion in volatility will hurt GLD call options particularly hard.
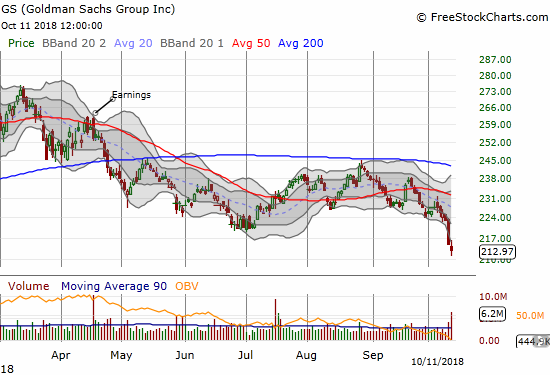
Goldman Sachs (GS)
Every time I look at GS in sell-off mode, I cannot help thinking something is seriously wrong with financials specifically and the stock market generally. I sold my batch of puts too early and did not benefit from Wednesday’s large drop. Today, GS closed at a new 17-month low.
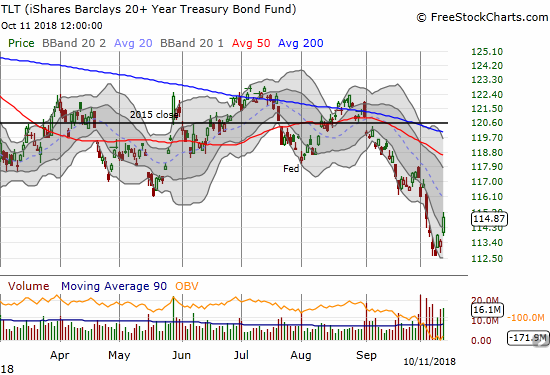
iShares 20+ Year Treasury Bond ETF (TLT)
There is now enough fear in the market to send interest rates back down and bond prices upward. TLT is up the last three trading days. I accumulated a sizeable position of call options in TLT during its sell-off in anticipation of just this kind of moment. However, the relief rally came a little later than I expected, so now the clock is working against me (expiration next Friday!).
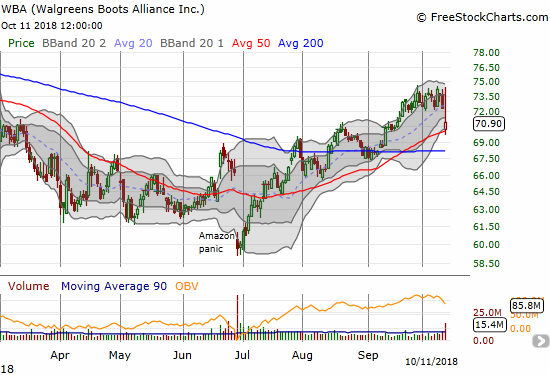
Walgreens Boots Alliance (WBA)
I am still stubbornly short WBA and sticking by my long-term bearish thesis. WBA is clearly considered a “safety” play during the market sell-off. It took a mildly disappointing earnings report to send the stock down…and buyers still were able to close the gap down momentarily. I will clearly be hanging around for the long-term…
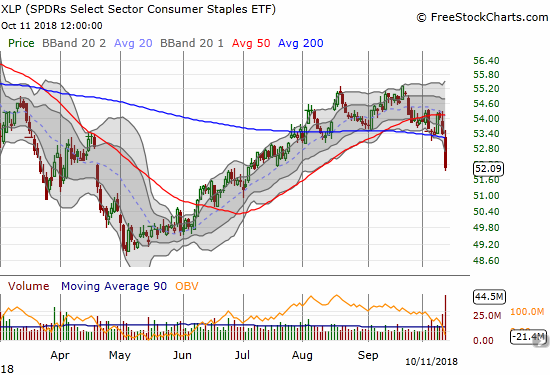
Consumer Staples Select Sector SPDR ETF (XLP)
Consumer staples are sometimes considered a place to hide away from the market’s storms. No longer for this sell-off. XLP broke down decisively below its 200DMA support after seemingly bouncing successfully off the support last week. Trading volume surged to its highest level since November, 2016, making for a very bearish setup. I decided to just ride out my call options in XLP.
— – —
FOLLOW Dr. Duru’s commentary on financial markets via email, StockTwits, Twitter, and even Instagram!
“Above the 40” uses the percentage of stocks trading above their respective 40-day moving averages (DMAs) to assess the technical health of the stock market and to identify extremes in market sentiment that are likely to reverse. Abbreviated as AT40, Above the 40 is an alternative label for “T2108” which was created by Worden. Learn more about T2108 on my T2108 Resource Page. AT200, or T2107, measures the percentage of stocks trading above their respective 200DMAs.
Active AT40 (T2108) periods: Day #2 under 20% (oversold), Day #2 under 30%, Day #9 under 40%, Day #14 under 50%, Day #30 under 60%, Day #83 under 70%
Daily AT40 (T2108)
")
Black line: AT40 (T2108) (% measured on the right)
Red line: Overbought threshold (70%); Blue line: Oversold threshold (20%)
Weekly AT40 (T2108)

*All charts created using freestockcharts.com unless otherwise stated
The charts above are my LATEST updates independent of the date of this given AT40 post. For my latest AT40 post click here.
Related links:
The AT40 (T2108) Resource Page
You can follow real-time T2108 commentary on twitter using the #T2108 or #AT40 hashtags. T2108-related trades and other trades are occasionally posted on twitter using the #120trade hashtag.
Be careful out there!
Full disclosure: long UVXY puts, long GLD shares and call spread, long TLT calls, short WBA, long SPY calls
*Charting notes: FreeStockCharts.com stock prices are not adjusted for dividends. TradingView.com charts for currencies use Tokyo time as the start of the forex trading day. FreeStockCharts.com currency charts are based on Eastern U.S. time to define the trading day.