
AT40 = 64.0% of stocks are trading above their respective 40-day moving averages (DMAs)
AT200 = 54.8% of stocks are trading above their respective 200DMAs (a 4-month high)
VIX = 12.0
Short-term Trading Call: bearish
Commentary
Once again, a tried and true bearish signal delivered. However this success came with a tremendous caveat: a simultaneously raging and nearly unabated rally in a concentrated number of small caps, especially small software companies.
AT40 (T2108), the percentage of stocks trading above their 40-day moving averages (DMAs), closed the week at 64.0% after trading as low as 61.2% on Friday. This loss was the fourth down day in a row for my favorite technical indicator. It represented fast confirmation of the bearish rejection of AT40 from the overbought threshold at 70%. The clarity ends there.
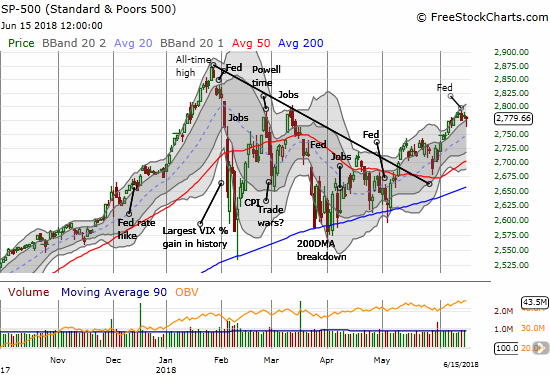
A few indices followed the bearish headlines, but the buyers were resilient. The S&P 500 (SPY) took two days to follow-through on the bearish signal. On Thursday, the index gapped up slightly and looked like it would hold the upper-Bollinger Band (BB) channel. On Friday, the index opened down and continued selling but closed almost flat by the close.
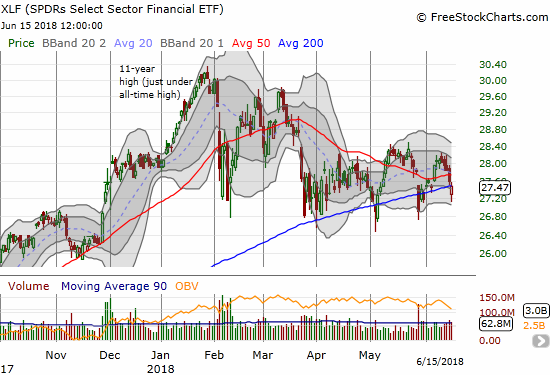
Financials sold off all week. Buyers could not save the Financial Select Sector SPDR ETF (XLF) from another 200DMA breakdown.
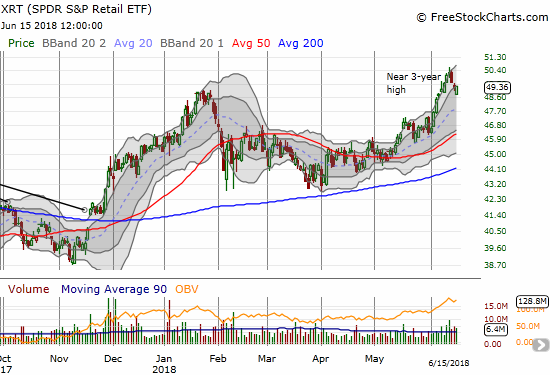
May retail sales were very strong on Thursday, but SPDR S&P Retail ETF (XRT) sold off anyway. The selling followed topping action from Wednesday’s Fed day. XRT gapped down hard on Friday but buyers rushed back in so much that XRT closed with a 0.3% gain. I am assuming the steep rally that brought XRT to this point is over. Perhaps a period of consolidation comes next.
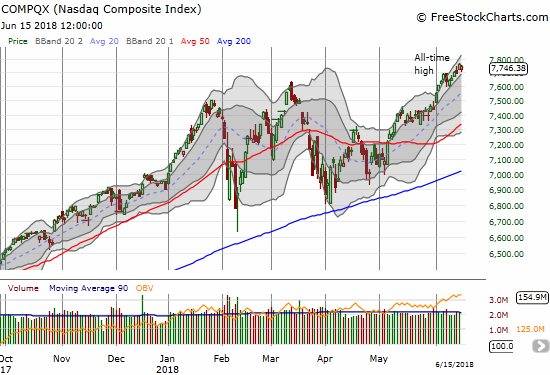
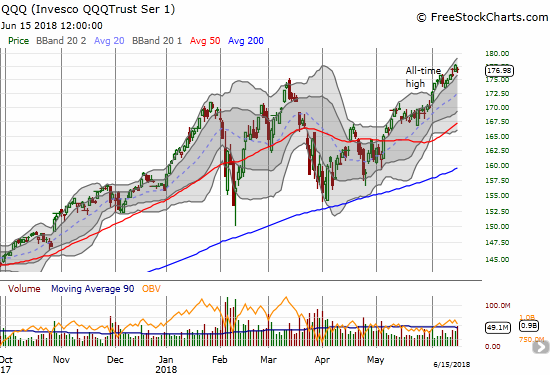
The tech-laden indices the NASDAQ and the PowerShares QQQ ETF (QQQ) ignored the AT40 bearish signal and rallied to all-time highs on Thursday. On Friday, buyers took the indices well off their lows; they both closed higher than Wednesday’s close.
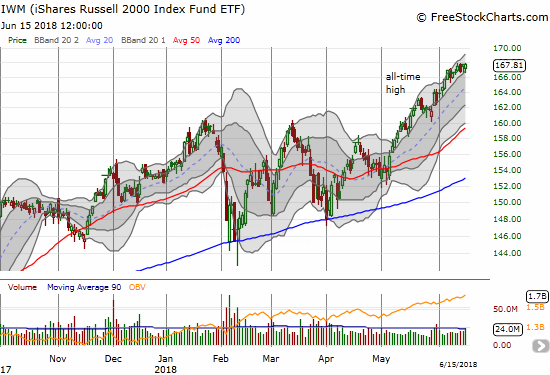
Like the tech stocks, small caps largely refused to listen to the siren calls of AT40. After Wednesday’s small dip, iShares Russell 2000 ETF (IWM) closed at two more (marginal) all-time highs. IWM looks ready to break out for a fresh bullish run.
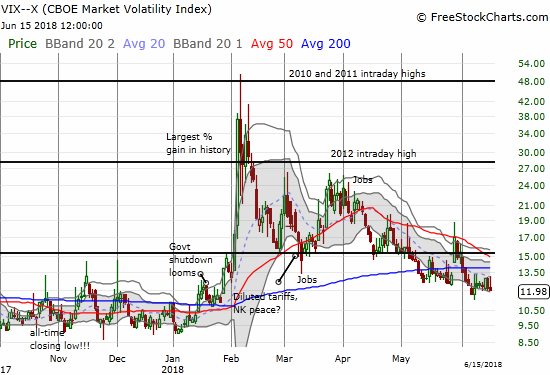
The market made it even more difficult to stay bearish by slamming the door shut on a rally in the volatility index, the VIX. At its high of the day, the VIX made it back to its high of the week. The VIX closed with a slight loss and its second lowest close since late January. Complacency is quite comfortable again.
Given I made a definitive trading call on Wednesday, this mixed-up trading action presented a great challenge. At one point I wondered whether I was thinking too hard about the trading action. With my bearish trading call fresh in hand, I looked at Thursday’s bounceback as an opportunity to finish dumping bullish trading positions. I swept every single one right off the books, taking profits where I had them. I loaded up on SPY put options in two tranches. I felt validated on Friday at the open as most of my bearish positions took hard gap downs. Still, the bullishness on Thursday coupled with the on-going raging fires in small cap stocks spurred me to take immediate profits on my short-term bearish trading positions including the SPY puts. I was just as aggressive in sweeping bearish positions off the table on Friday as I was aggressive unloading bullish positions on Thursday. After the dust settled, I only left standing my fistful of call options on ProShares Ultra VIX Short-Term Futures (UVXY). The previous tranche expired with a whimper on Friday.
I left my short-term trading call at bearish even though I am much less confident about the call than I was on Wednesday. I will most likely take a “don’t buy” stance until buyers can push AT40 back into overbought territory. From a fundamental standpoint, I am afraid the market is allowing itself to get lulled to sleep on very real macro dangers in the economy. Headwinds are growing, not abating. The increasingly rancorous relationship between the U.S. and its allies and the growing trade war between the U.S. and everyone else are definitive negatives for the world economy. Going forward, I favor fading optimism over the implications of the trade war, and I am increasingly reluctant to join the herds that are scrambling for “safety” in smaller stocks.
CHART REVIEWS
(Note that at the time of writing charts were not adjusted for dividend payments).
Alcoa (AA)
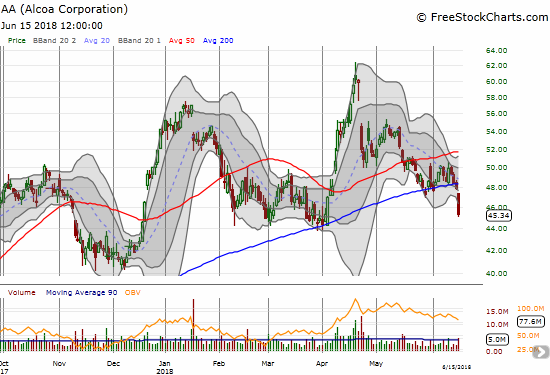
The commodities markets are taking trade wars seriously. AA was one of a broad swath of commodity-related plays which took a tough tumble. AA lost 5.2% in a very bearish 200DMA breakdown. I will likely dump my position if AA closes below the March/April lows. AA looked like such a great setup at 200DMA support, and I did not expect it to become a short-term trade; I expected it to continue along its extensive uptrend.
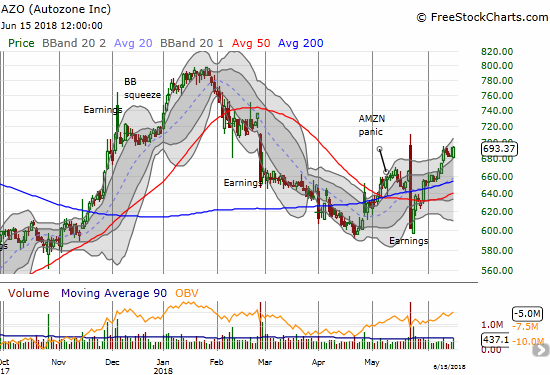
Autozone (AZO)
I was far too conservative in my bullish post-earnings recovery trade on AZO. AZO gained 1.5% as traders no doubt find a domestic retailer like AZO very attractive as a shelter from global economic worries. AZO is now up 4.3% post-earnings; the stock was down 9.5% on the first day of post-earnings trading.
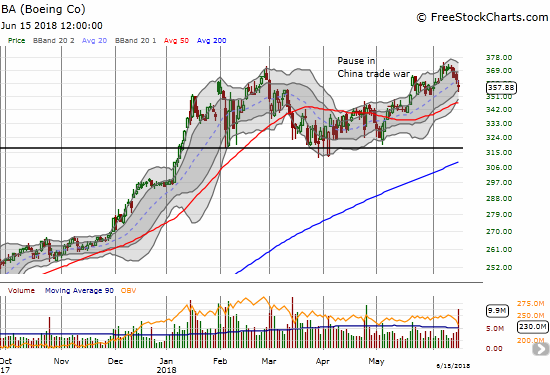
Boeing (BA)
Once I flipped bearish, I returned to fading BA. The nearly unqualified optimism on BA continues to amaze me, and it makes BA an easy target for fading. Still, BA is resilient so negative bets do not last long. Like other bearish bets on Friday, I took profits on my BA put soon after the open.
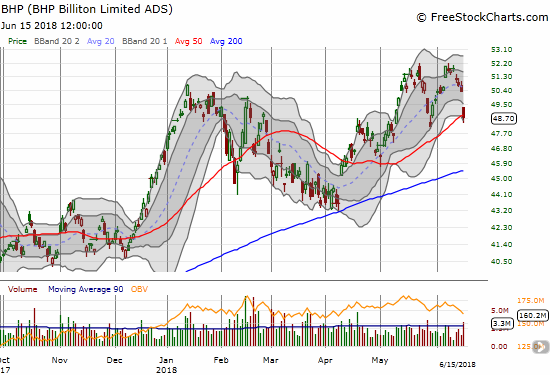
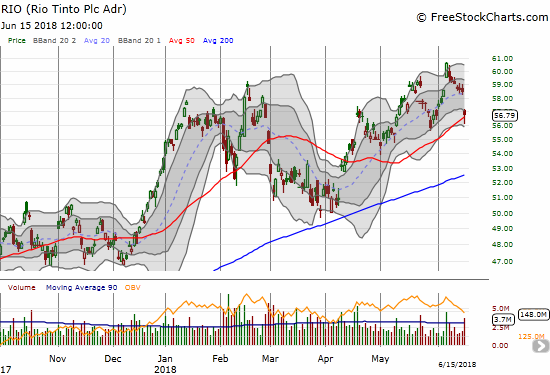
BHP Billiton (BHP) and Rio Tinto (RIO)
My execution on my latest BHP vs RIO pairs trade was poor. On both ends of the trade, I could have and probably should have taken profits. Instead, each time I waited for the move to continue and added to the losing side of the trade as a hedge. The immediate reversal of RIO’s breakout was particularly damaging. Friday’s commodities sell-off bailed me out given June 15th expirations. While I locked in profits on the BHP put options a little early on the day, I am gratified I closed out the overall trade near flat. I will reposition this trade next week by loading up on BHP puts. If RIO closes its gap down, I will complete the pairs trade with RIO call options.
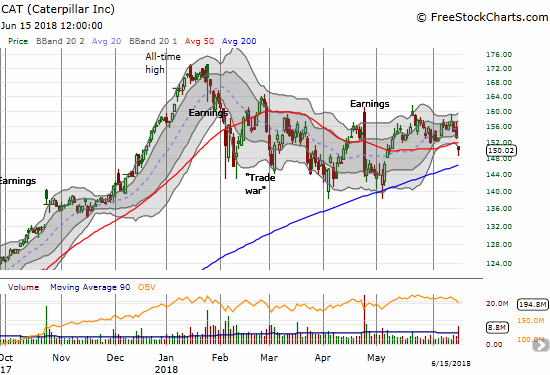
Caterpillar (CAT)
Caterpillar suffered a 50DMA breakdown on a 2.0% loss. CAT is the poster child for US-China trade tensions. I would not stay long this stock as long as these tensions are in the air, so fading it continues to make sense. With CAT in a bullish mode earlier, I tried a different method of fading CAT. The trades netted out successfully. I bought a put option 3 weeks ahead of expiration and sold short weekly puts for two weeks against the long put. I closed one put flat and the other expired worthless. So when CAT fell on Thursday with a day left to expiration, I was eager to go ahead and take profits. CAT will likely eventually retest 200DMA support.
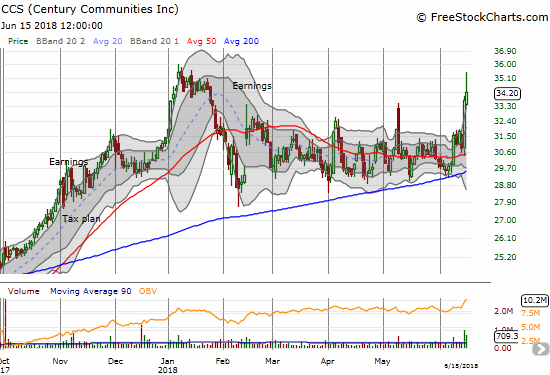
Century Communities (CCS)
While the market quickly snuffed out the latest flicker of life in the stocks of home builders, CCS held its ground at 50DMA support. It ended the week with a tremendous surge that at one point was good for a 2-day 15.3% gain. The news? CCS became a top 10 builder by purchasing the remaining interest in Wade Jurney Homes.
“Dale Francescon, Co-Chief Executive Officer, stated, ‘This transaction establishes Century as a top-10 U.S. homebuilder and represents another milestone for our Company. Our partnership with Wade Jurney Homes has been extremely positive and allowed us to benefit from increasing demand for entry-level homes through a high-returning asset-light model and enhanced geographic exposure to one of the fastest growing regions of the country. Our return on investment has surpassed our expectation in each quarter since inception of the joint venture in 2016 and we are excited to build upon that positive momentum with full ownership of Wade Jurney Homes.'”
Of course, if the bearish market narrative is home builders will get squeezed by rising interest rates and rising material and labor costs, this purchase should NOT generate such a surge in stock buying. I am not going to chase this trading action, but CCS stays at the top of my list for the next buying moment for home builders.
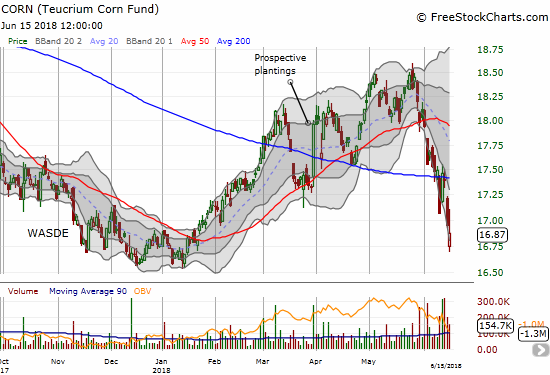
Teucrium Corn ETF (CORN)
It is time to hit the reset button on CORN. The bullish action from April is completely gone now. I added more this week ahead of the official declaration of tariff action against China and China’s retaliatory actions. Markets fear that Mexico will announce retaliatory tariffs that will include duties on U.S. corn. Markets have spent a lot of time expecting the best from this trade chaos, and even I have been lulled to sleep at times. Yet, President Trump’s abiding principle is to drive the U.S. trade deficit to zero, and the main path to this objective appears to be trade tariffs that cut down the supply of imports into the U.S. I am not selling my existing CORN position, but I am bracing myself for more losses before things turn around.
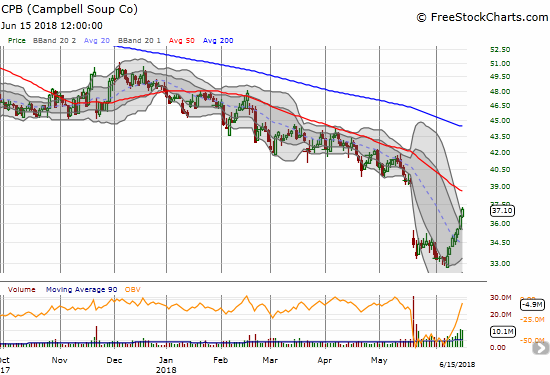
Campbell Soup Company (CPB)
When I flipped bullish with overbought trading conditions, I had my eye on stocks like CPB as one of many “catch-up” plays attracting excited traders. CPB is already up 11.8% from its near 6-year low. I am definitely not chasing the stock, but I think it could continue to serve as a barometer of trading sentiment. The way CPB powered through the entire week makes me think the bearish signals I noted earlier have little depth. Note that CPB has attracted a lot of bears: 13% of its float is sold short.
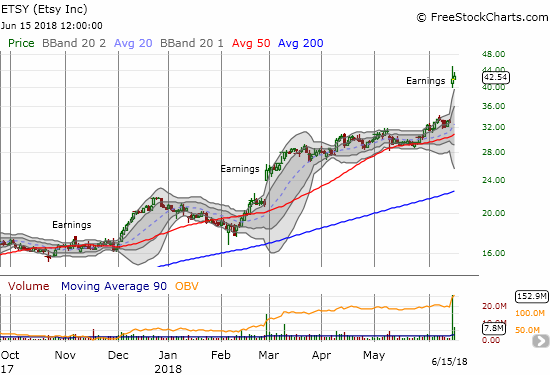
Etsy (ETSY)
ETSY is a great example of the cohort of stocks that completely ignored the week’s churn and headline angst. It is a small company (well, not so small anymore with a $5B market cap!) with a domestic-oriented business. The chart says it all.
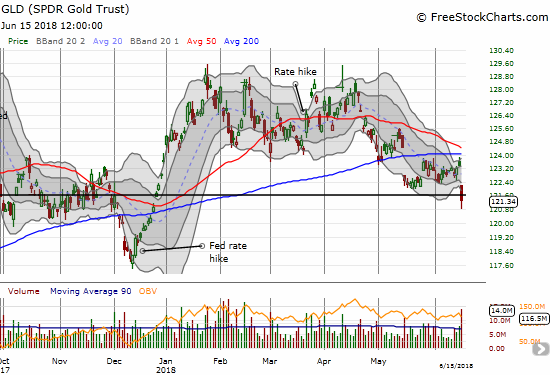
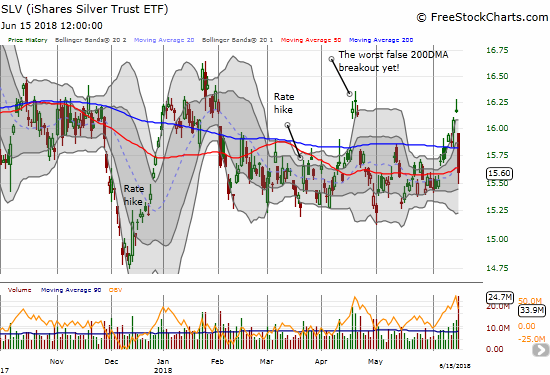
SPDR Gold Shares (GLD) and iShares Silver Trust (SLV)
The commodities sell-off snared precious metals as well. GLD gapped down for a 1.7% loss and a fresh close below its close on the day of Presidential elections. This loss confirms resistance at now converging and downward turning 50 and 200DMAs. I read a bunch of explanations for Friday’s loss, but they make little sense. Note that GLD rallied in the wake of Wednesday’s Fed rate hike in another effort to act contrary to the expected bearish relationship to rate hikes.
SLV had an even worse loss of 3.5%. Thanks to a sharp rally preceding this loss, SLV is not (yet?) back in a breakdown mode.
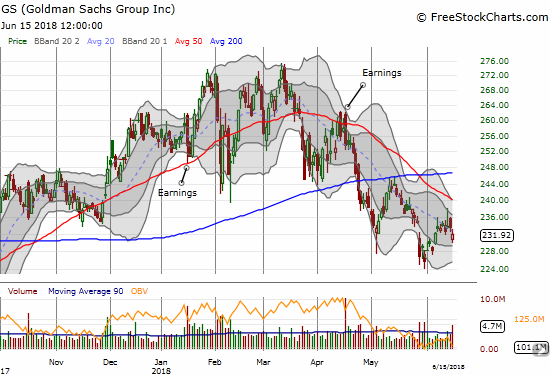
Goldman Sachs (GS)
GS is down 9.7% year-to-date and exhibiting surprising relative weakness. I was positioned with a put spread when GS gapped down and sold off at the end of May, but I waited for a follow-through that never came. I reset the bear button with a put option on Friday even as I cleared the deck of other bearish trades. I file GS in the “something’s not right” file cabinet and plan to be more diligent with bearish bets against the stock.
$GS is firmly in the "something's not right" category. It just keeps going down with relative weakness. 200DMA confirmed resistance. pic.twitter.com/gChfOcp6kJ
— Dr. Duru (@DrDuru) May 29, 2018
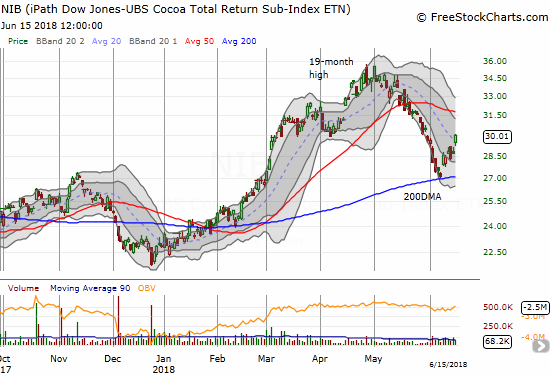
iPath Bloomberg Cocoa SubTR ETN (NIB)
I am still stunned by the precision of NIB’s bounce from 200DMA support. I think the current rally is being aided by weakness in the British pound (FXB). I was tempted to take profits on Friday, but I decided to hold to see whether buyers would follow-through on Monday. My upside target remains 50DMA resistance.
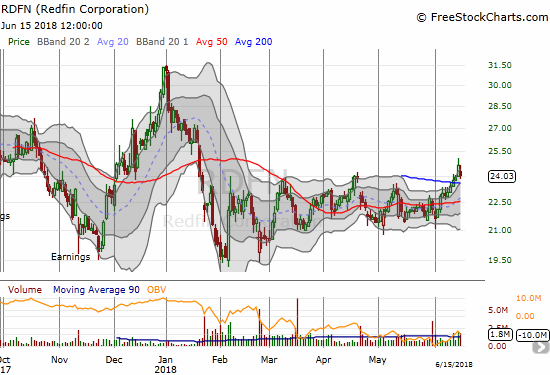
Redfin (RDFN)
RDFN is a housing market play that recently went IPO. I have been watching on the sidelines and was ready to pounce during the last two sell-offs in anticipation of getting something close to the $15 IPO price. The stock popped above its 200DMA this past week. If I were bullish on the market, I would buy right here. I would prefer to buy at 50DMA support.
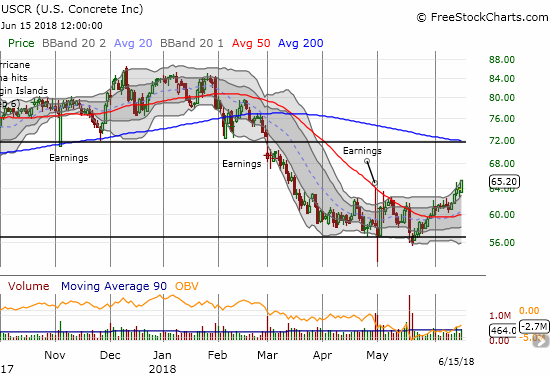
U.S. Concrete (USCR)
This week is a strange time for USCR to lift off, but I will take it. USCR is at a post-earnings high. The stock may have finally carved out a bottom. I am a holder until at least 200DMA resistance, but I hope to and expect to hold well past that. As I have explained in prior posts, the market has misjudged USCR. The stock should be a lot higher.
Other trades: took profits on Kroger (KR) call options, added another Pulte Home (PHM) call option, expired worthless: WYNN call option and FSLR call options
— – —
FOLLOW Dr. Duru’s commentary on financial markets via email, StockTwits, Twitter, and even Instagram!
“Above the 40” uses the percentage of stocks trading above their respective 40-day moving averages (DMAs) to assess the technical health of the stock market and to identify extremes in market sentiment that are likely to reverse. Abbreviated as AT40, Above the 40 is an alternative label for “T2108” which was created by Worden. Learn more about T2108 on my T2108 Resource Page. AT200, or T2107, measures the percentage of stocks trading above their respective 200DMAs.
Active AT40 (T2108) periods: Day #83 over 20%, Day #52 over 30%, Day #47 over 40%, Day #29 over 50%, Day #12 over 60% (overperiod), Day #3 under 70% (underperiod)
Daily AT40 (T2108)
")
Black line: AT40 (T2108) (% measured on the right)
Red line: Overbought threshold (70%); Blue line: Oversold threshold (20%)
Weekly AT40 (T2108)

*All charts created using freestockcharts.com unless otherwise stated
The charts above are my LATEST updates independent of the date of this given AT40 post. For my latest AT40 post click here.
Related links:
The AT40 (T2108) Resource Page
You can follow real-time T2108 commentary on twitter using the #T2108 or #AT40 hashtags. T2108-related trades and other trades are occasionally posted on twitter using the #120trade hashtag.
Be careful out there!
Full disclosure: long UVXY calls, long AA, long CORN, long GLD, long SLV, long NIB, long GS put, long USCR
*Charting notes: FreeStockCharts.com stock prices are not adjusted for dividends. TradingView.com charts for currencies use Tokyo time as the start of the forex trading day. FreeStockCharts.com currency charts are based on Eastern U.S. time to define the trading day.
Just an observation: the red line in T2108 charts seems placed at 65% level, instead of 70% level.
Keep up the good work!
You are correct. Thanks for the catch. I have fixed the line for going forward.
And thanks for reading!