
The Market Breadth Summary
- The latest wave of breakdowns and pullbacks pushed me risk off again, even as major indices masked deeper market breadth deterioration.
- A sharp pullback in precious metals reinforced the risks of parabolic moves resolving violently.
- Mixed macro catalysts, from Federal Reserve signaling to currency volatility, justified maintaining a cautious bearish stance.
- I navigated the pullback by locking in profits, leaning selectively into panic-driven sell-offs, and remaining patient for higher-probability technical entries.
Stock Market Commentary
The first month of the new year ended in an eventful fashion with significant news both good and bad, sometimes abrupt. The bad news convinced me to go risk off again as breakdowns and pullbacks weighed heavily on individual stocks. The major indices hid the extent of the underlying carnage. Granted, my eyes are finely tuned to confirming evidence given I went into the week with a bearish risk off call. Still, the week ended for me with plenty of validation.
The week included a dramatic pullback in precious metals, an event that should remind traders, once again, of the dangers of parabolic run-ups. Earnings delivered plenty of drama. The government sank into another (partial) shutdown over policy conflict on how to handle immigration enforcement. The Federal Reserve held steady on interest rates and suggested the economy is fine and inflation essentially tamed (see video below).
The President nominated Kevin Warsh, a former Federal Governor, to serve as chair after current chair Jerome Powell terms out. Warsh actually has a history of being a hawk on monetary policy (meaning he hates easy money and accommodative policy) and ran counter to his colleagues when he was a Fed governor in the last decade. Drama erupted in the currency markets with an acceleration of the sell-off in the U.S. dollar. Through all of this, cryptocurrencies once again proved they have lost their use as a hedge, refuge, or store of value as the months long sell-off in crypto accelerated.
Even if my list missed some important catalysts, this collection provides plenty of justification for going risk off again in the coming week. Fortunately, there are some technical indications that buyers could prove as eager as ever to load up on stocks no matter what is happening outside of Wall Street and corporate earnings.
The Stock Market Indices
S&P 500 (SPY)
The S&P 500 (SPY) gapped higher to an intraday all-time high hours ahead of the Federal Reserve’s announcement on monetary policy. Sellers took over from there and did not stop until after Powell finished his introductory remarks. Selling resumed the next two days. However, on each day, buyers stepped in and took the index well off its lows. Thus, there is reason to be both bearish (because of the persistent following the Fed decision) and bullish (the resilience of intraday support). On Thursday, the S&P 500 dipped low enough to approach support at its 50-day moving average (DMA) (the red line). Still, even with the index hanging in there, underlying market breadth told a different story, with serious deterioration underneath.
")
NASDAQ (COMPQ)
The NASDAQ delivered more dramatic intraday moves and slightly less eagerness to buy the dips. The tech laden index printed two tests of 50DMA support. If the NASDAQ manages to close higher then I will be inclined to buy assuming the index confirmed support. On the other hand, a close below the 50DMA will further validate my short-term bearish call given such a breakdown would confirm a double top on the NSADAQ formed by last week’s fade and pullback from the previous all-time high. Even with earnings season well underway, the technical narrative for the NASDAQ is the most compelling.
")
iShares Russell 2000 ETF (IWM)
IWM underperformed last week and was one of the main culprits dragging down market breadth. Sellers took profits from the previous week and through this week. Even though I was risk off, I decided to try one more time for my standard weekly setup for IWM calls. I used a calendar call spread because I did not think a bounce would be resolved in the coming week. At the time I placed the trade, the 20DMA (the dashed line) looked like it was holding firm. Instead, that support gave way into the close. Now I need to brace for a potential test of 50DMA support (and reflect back on a trade that leaned against my risk off trading call!).
")
The Short-Term Trading Call With Risk Off
- AT50 (MMFI) = 58.3% of stocks are trading above their respective 50-day moving averages
- AT200 (MMTH) = 61.5% of stocks are trading above their respective 200-day moving averages
- Short-term Trading Call: cautiously bearish
AT50 (MMFI), the percentage of stocks trading above their respective 50DMAs, closed the week at 58.3%. Recall that I flipped cautiously bearish by following the AT50 trading rules after my favorite technical indicator faded from the overbought threshold of 70%. The switch turned out to be timely given market breadth slid for the following week even though the S&P 500 and the NASDAQ closed the week essentially flat. The S&P 500 in particular quickly recovered from its 50DMA breakdown. Still, given the intense swirl of news and potential catalysts for fresh volatility, I am most comfortable staying risk off again. I have not yet identified any major short positions, but I do still have a March $660/$640 put spread in place.
Note that the volatility index (VIX) is poised to go higher after ending the week above the critical “pre tariff drama, trauma, and noise” threshold.
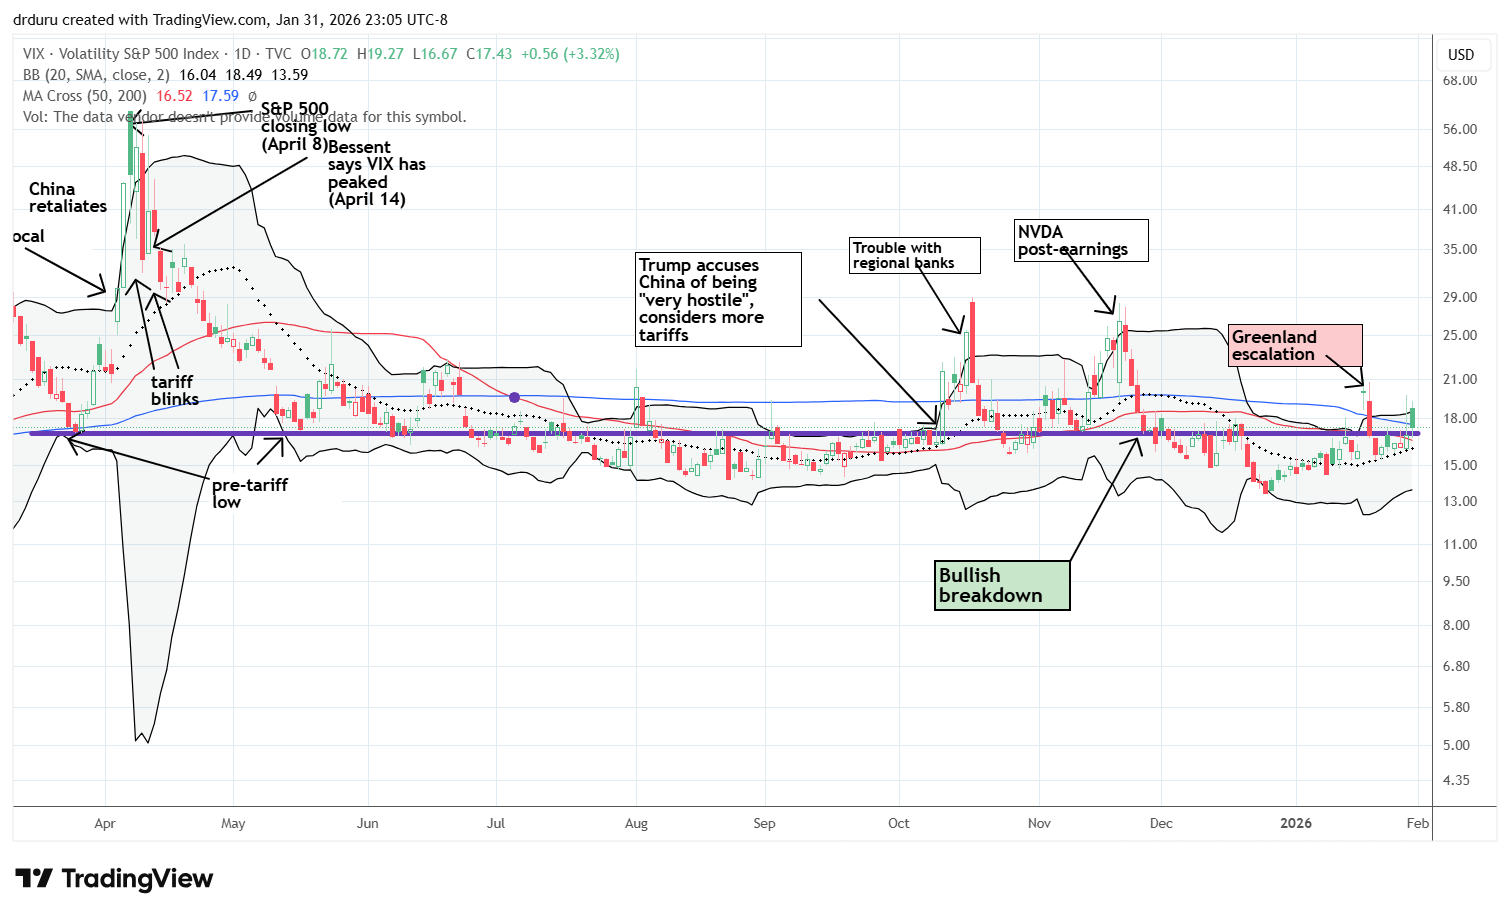
AT200, the percentage of stocks trading above their respective 200DMAs, is now below former peaks, but it remains in breakout territory. Thus, this indicator of longer-term health in market breadth provides a counter-narrative to the bearish case.
The Equities: Pullback
In case you missed it…
Last week I provided near real-time observations on the implications of the S&P 500’s 50DMA breakdown and market breadth’s parallel bearishness.
Gold SPDR Shares (GLD)
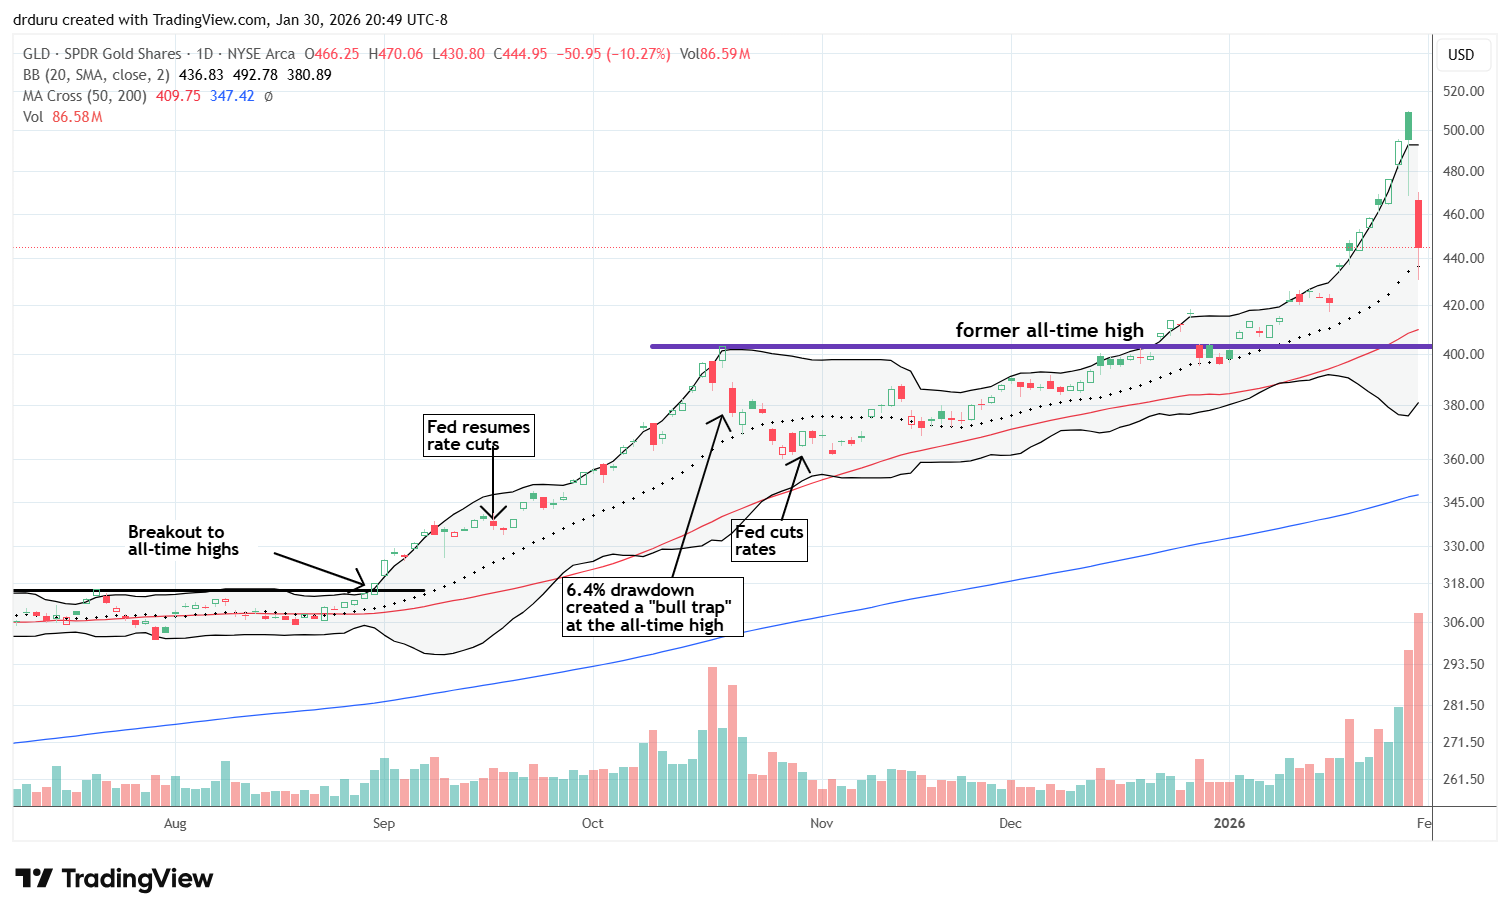
Description: Gold SPDR Shares (GLD) is an exchange-traded fund designed to track the price of gold bullion.
Technical status: Gold SPDR Shares (GLD) fell sharply after an extended parabolic run with persistent closes above the upper Bollinger Band. The violent sell-off is the typical resolution of a parabolic run-up.
Trade commentary: Precious metals sold off big time, and headlines suggested the sell-off happened because the president nominated Kevin Warsh to be the next Federal Reserve governor. Warsh has a hawkish history as a former Fed governor, but I have a hard time believing the President gave Warsh the job for any other reason than to make sure rates get cut as soon as possible. The correlation with the appointment is coincidental and/or part of a panicked move to lock in profits after an extreme run-up that went parabolic at the end. The market found its excuse to back off from the frenzied trade. Any trader worth their salt should understand that the likely end of a parabolic move is a sharp, sudden, and deep sell-off that takes no prisoners.
In my commentary about the Federal Reserve’s decision on monetary policy I warned that GLD looked ready for a pullback, but I did not anticipate a historic plunge. GLD closed with a 10.3% one-day loss and was down as much as 13.1%. Since I remain longer-term bullish in GLD I leaned against the panic to get a fresh position in place. I bought a February/April $550 calendar call spread and paid for most of it shorting a February $400 put spread. The $400 level is directly below presumed support from the previous all-time high. I am also assuming a recovering in GLD will take time; thus I do not expect GLD to cross $500 anytime soon, especially not this month. The damage in GLD runs deep. If GLD continues selling off, I will not mind owning it at $400.
Note that all of GLD’s uptrends remain intact since the ETF bounced away from 20DMA support.
Silver Trust (SLV)
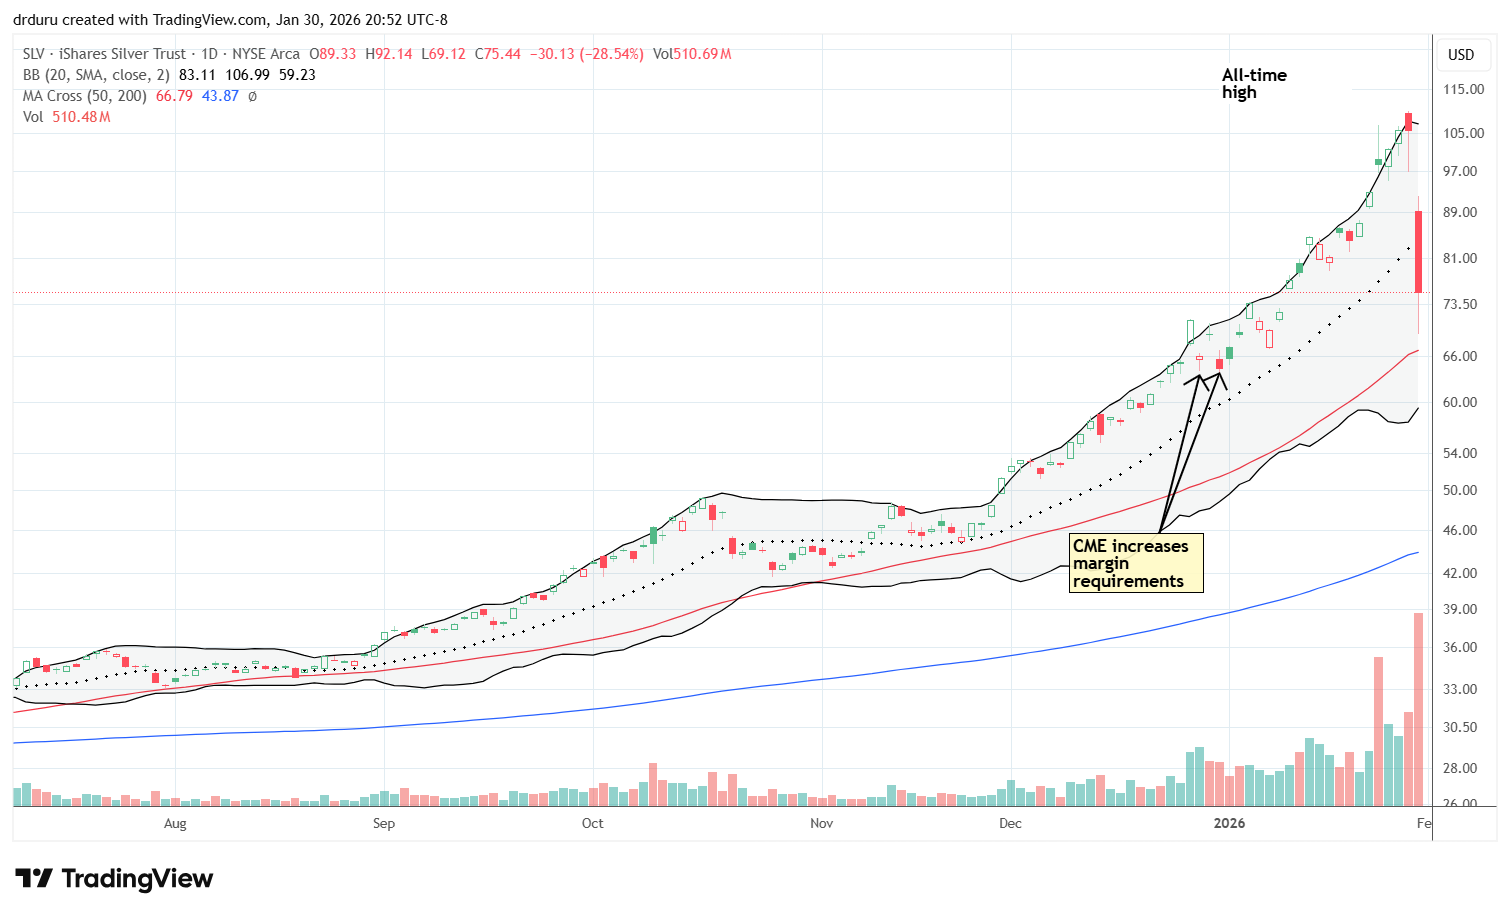
Description: Silver Trust (SLV) is an exchange-traded fund designed to track the price of silver bullion.
Technical status: Silver Trust (SLV) suffered an extreme breakdown even worse than GLD’s pullback. SLV’s parabolic move was just getting started.
Trade commentary: Silver was the real big loser. SLV closed down 28.5%, and at the lows had lost 34.1%. This sell-off was an extreme of extremes. SLV even sliced right through 20DMA support and nearly tested 50DMA support. I held off buying SLV given the potentially large GLD position. However, I will buy some on a true test of 50DMA support as that point would mark a complete reversal of SLV’s gains for the year.
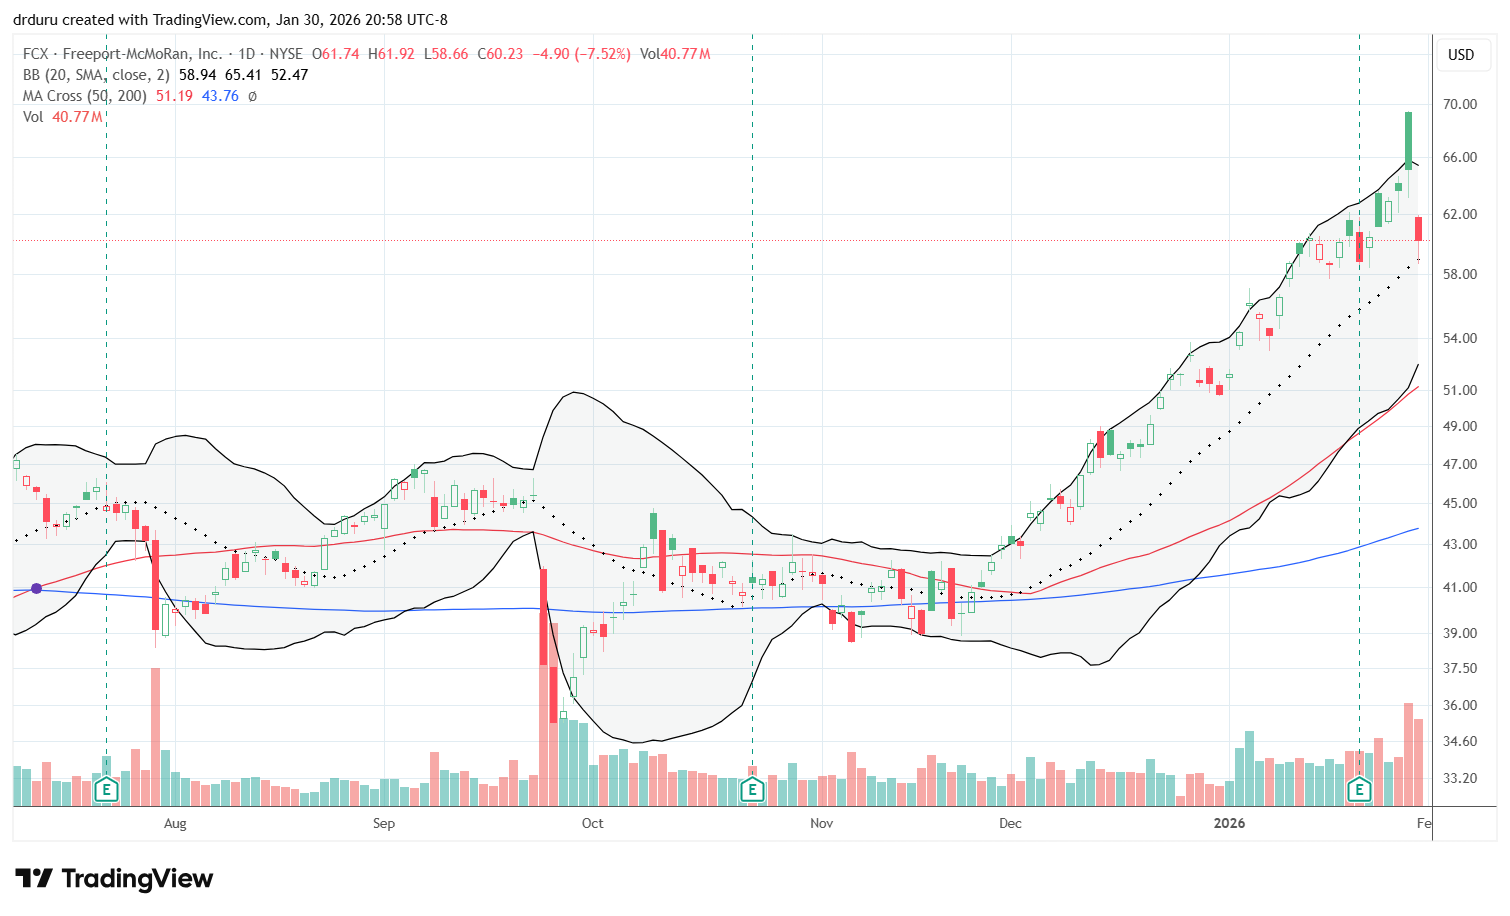
Freeport-McMoRan (FCX)
Description: Freeport-McMoRan (FCX) is a mining company that produces copper, gold, and molybdenum from operations in the Americas and Indonesia.
Technical status: Freeport-McMoRan (FCX) gapped down and sold off but maintained an intact uptrend, including a bounce that aligned with rising 20DMA, 50DMA, and 200DMA support.
Trade commentary: The overall sell-off in precious metals carried across commodities including copper. FCX fell 7.5%. As soon as I noticed the gap down at the open, I moved to lock in my remaining profits. Those profits will now buffer my GLD position. I remain bullish on FCX and will buy at tests of support like the 50DMA. For now, FCX is holding 20DMA support after a picture perfect bounce of that trendline.
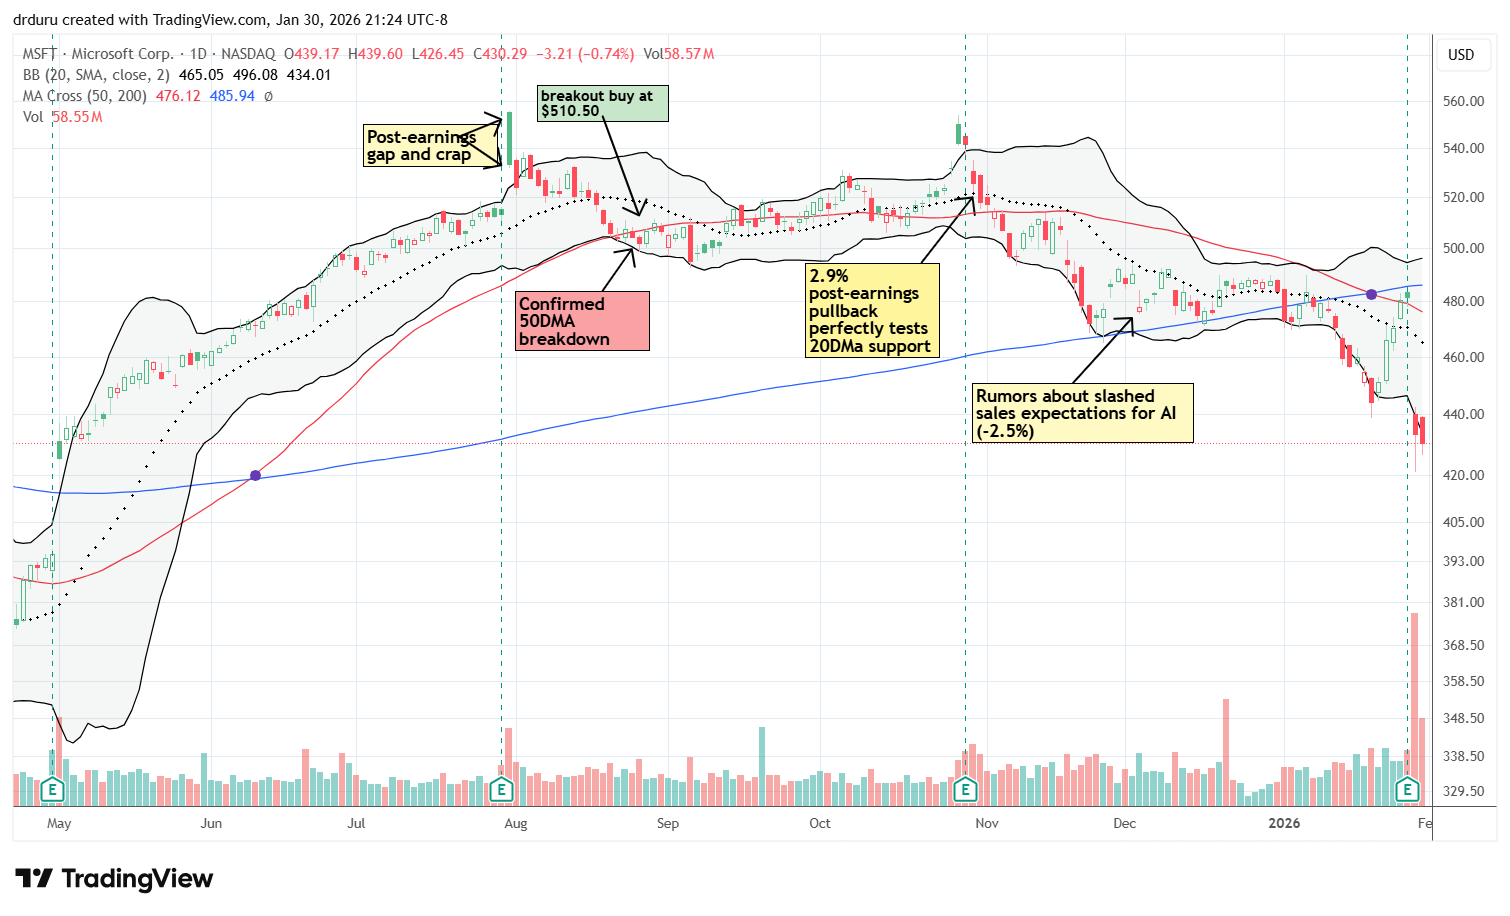
Microsoft (MSFT)
Description: Microsoft (MSFT) develops and sells software, cloud services, devices, and enterprise solutions including the Azure cloud platform.
Technical status: Microsoft (MSFT) confirmed a topping pattern with a sharp 10.0% post-earnings breakdown and an 8-month low. The stock failed perfectly at 200DMA resistance.
Trade commentary: While I noted the ugly chart in MSFT two weeks ago, I did not expect such an ugly post-earnings sell-off. Moreover, the sharp rally going into earnings seemed to signal that earnings would be OK. Instead, MSFT plunged 10.0% and closed at an 8-month low on fears over Azure growth. The pullback reconfirmed topping action in MSFT, further highlighted by a picture-perfect fade from 200DMA resistance. With this bearish setup worsening, I am in no rush to add more shares to my long-term investment in MSFT.
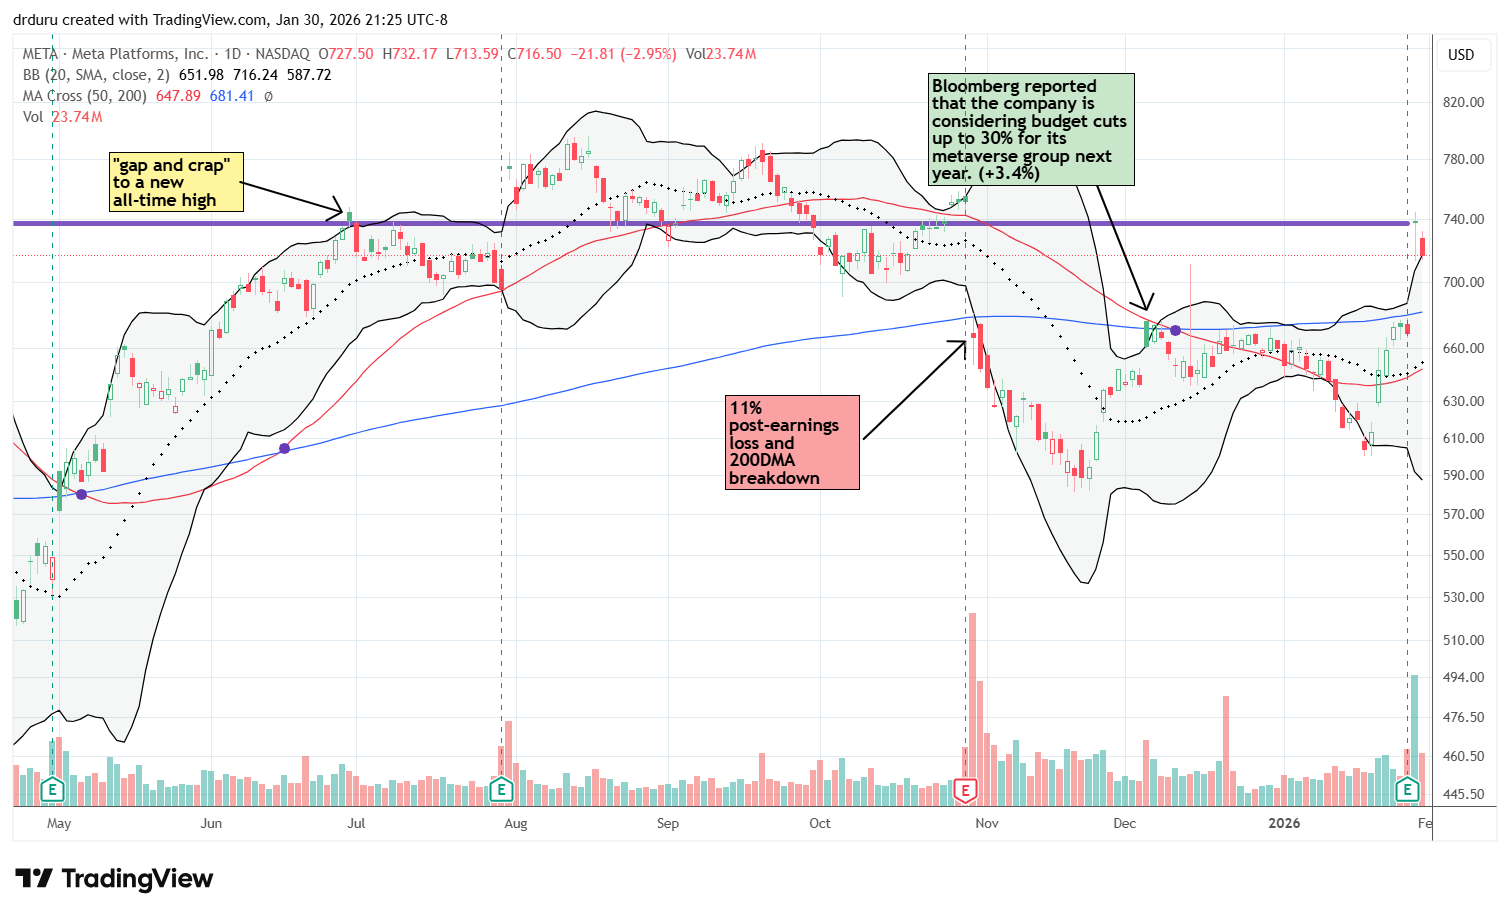
Meta Platforms (META)
Description: Meta Platforms (META) operates social media and communication platforms and sells digital advertising across its apps and services.
Technical status: Meta Platforms (META) surged on earnings into a prior gap-and-crap level near a former all-time high and then pulled back 3% as buyers proved overextended.
Trade commentary: Of all the big cap tech earnings this week, MSFT was the lowest on my radar for risk. I thought META carried the highest risk. I even put on a trade shorting an “iron condor” (out of the money call and put spreads), thinking META might linger around the pre-earnings price. Instead META shot higher to a 10.4% gain – right to resistance at the former all-time high. Sellers took over from there on Friday. META looks positioned to test 200DMA support.
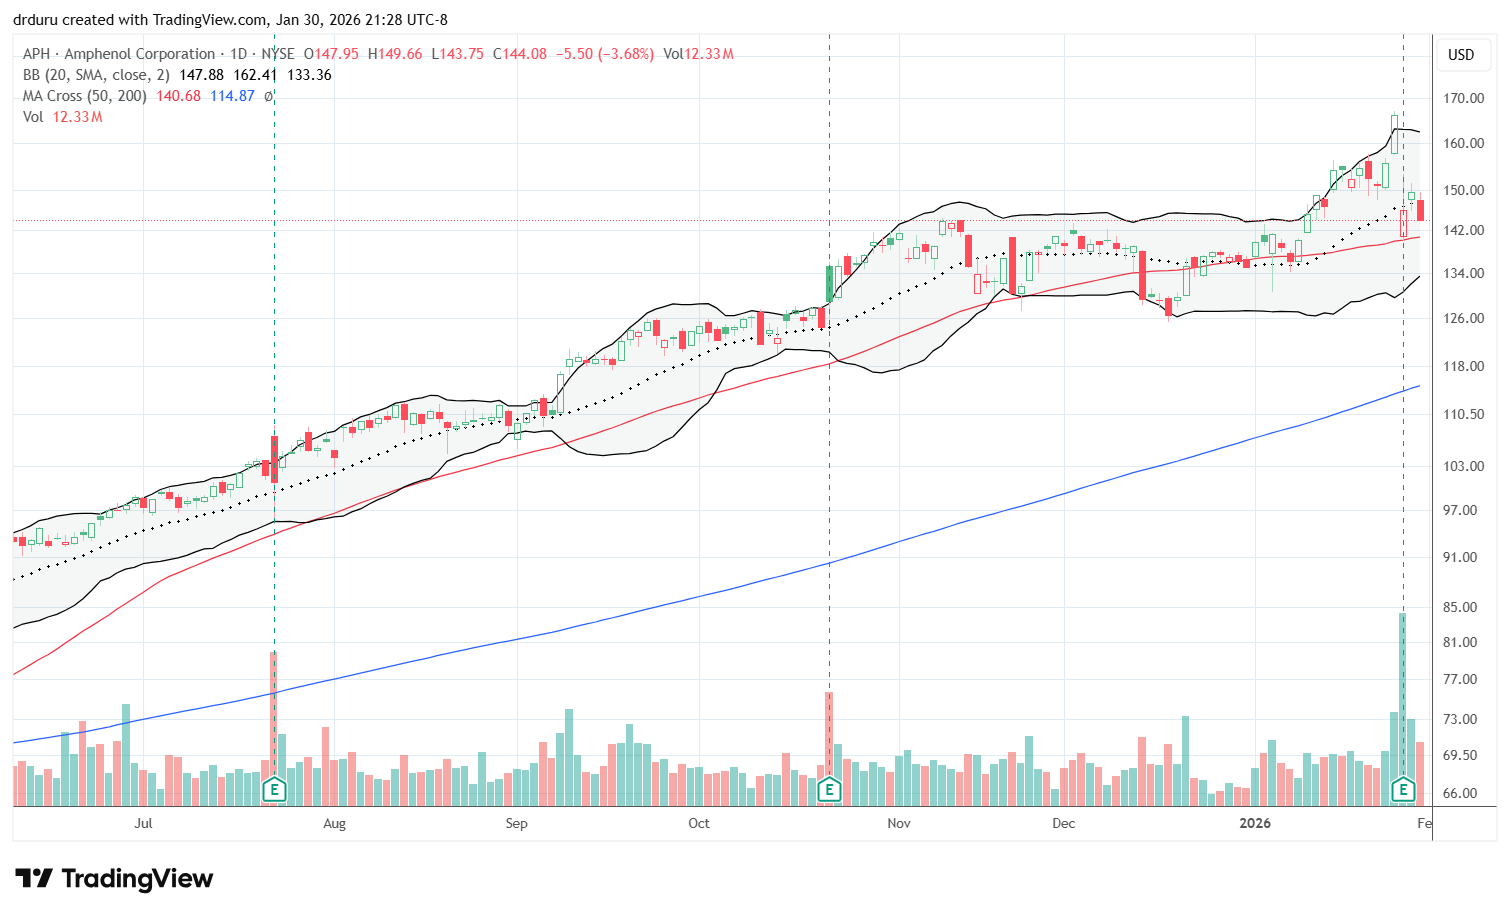
Amphenol Corporation (APH)
Description: Amphenol Corporation (APH) designs, manufactures, and sells electronic and fiber optic connectors, interconnect systems, sensors, and related products.
Technical status: Amphenol (APH) reversed a parabolic pre-earnings pop and dropped to 50DMA support with a 12.2% post-earnings decline. While I did a quick swing trade off 50DMA support, I am looking for a long-term entry point.
Trade commentary: Headline earnings for Amphenol looked fine. However, an over-extended surge ahead of earnings likely setup high expectations and created the conditions for disappointment on anything less than amazing. APH dropped right to 50DMA support with a 12.2% post-earnings loss. I went into swing trade mode and bought near the 50DMA; I took profits the next day (with risk off on my mind of course). Now I am watching for an entry for a long-term position.
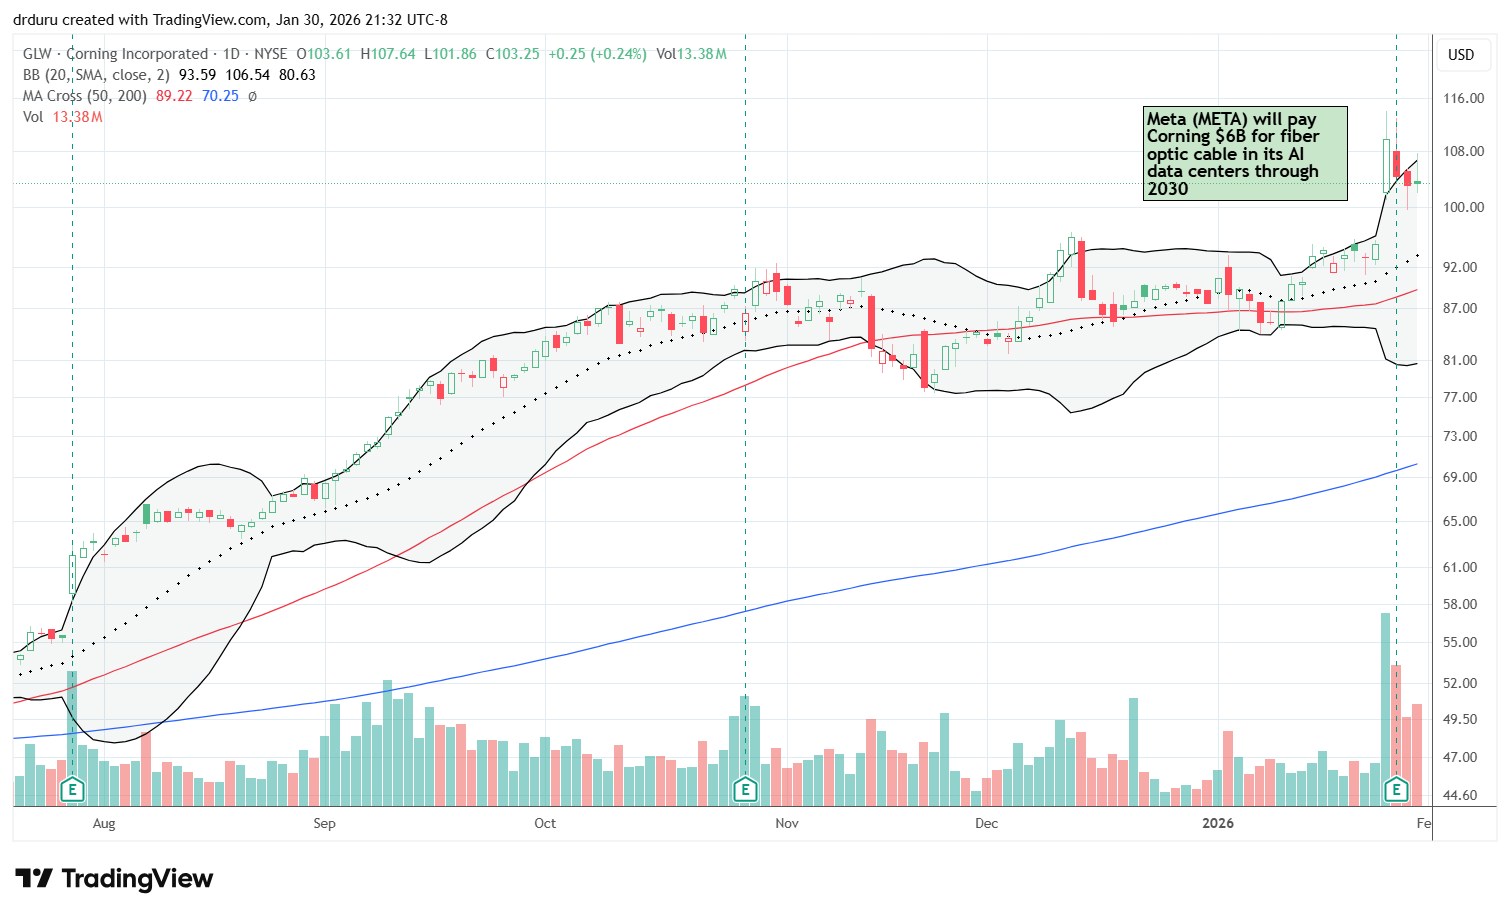
Corning (GLW)
Description: Corning (GLW) manufactures glass, ceramics, and optical communications products including fiber optic solutions for networks and data centers.
Technical status: Corning (GLW) surged 16% well above its upper Bollinger Band on a deal with META. I locked in profits as part of my risk off positioning.
Trade commentary: I reentered a trade in GLW at the beginning of January. A subsequent 50DMA breakdown put me on the edge of jumping out of the position. Instead, the stock quickly rebounded and kept me positioned for last week’s good news. Corning opened Tuesday with news that Meta would pay Corning $6 billion for fiber optic cable in AI data centers. Since I was risk off, I locked in profits after GLW soared 16% on the news, well above its upper Bollinger Band (BB).
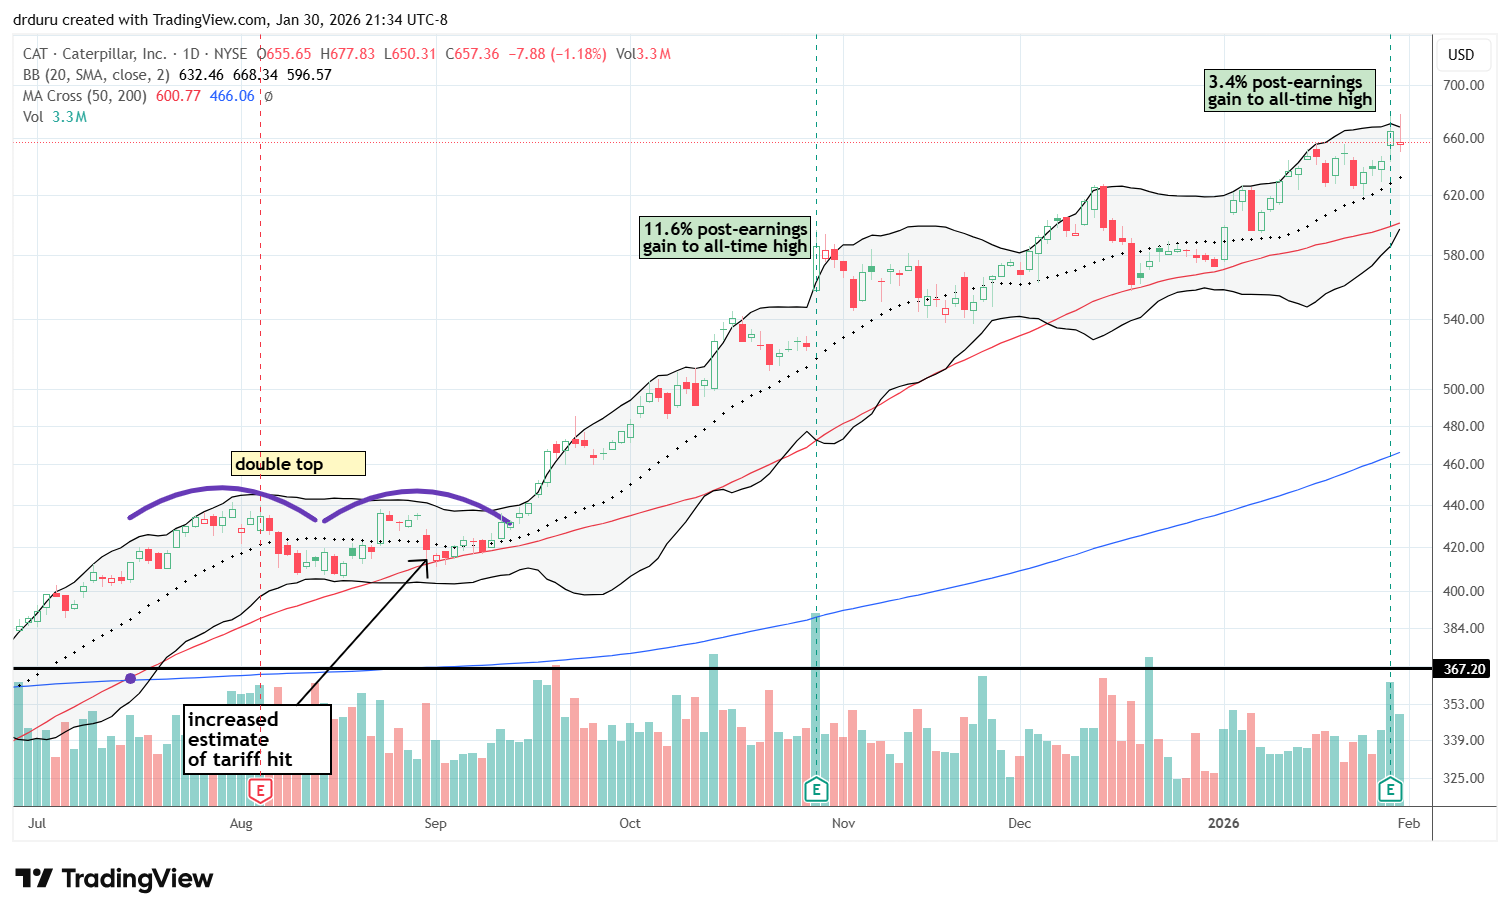
Caterpillar (CAT)
Description: Caterpillar (CAT) manufactures construction and mining equipment, engines, and power generation systems and provides related services.
Technical status: Caterpillar (CAT) broke out to a new all-time high after a 3.4% post-earnings gain on more bullish news from its AI-related businesses.
Trade commentary: CAT gained 3.4% post-earnings to an all-time high. I thought Caterpillar had become an AI story because of construction equipment needed to build data centers, but I newly learned that Caterpillar also has strong business in mobile natural gas power generators sold to data centers trying to get up and running fast. Caterpillar’s competitors in that segment are apparently sold out for years to come, so Caterpillar has a long runway to profit. Thus, CAT is not just a bullish AI trade but a core AI trade, probably for the year, maybe longer. I am on the lookout for a good risk/reward technical entry point like a successful test of support at an uptrending moving average.
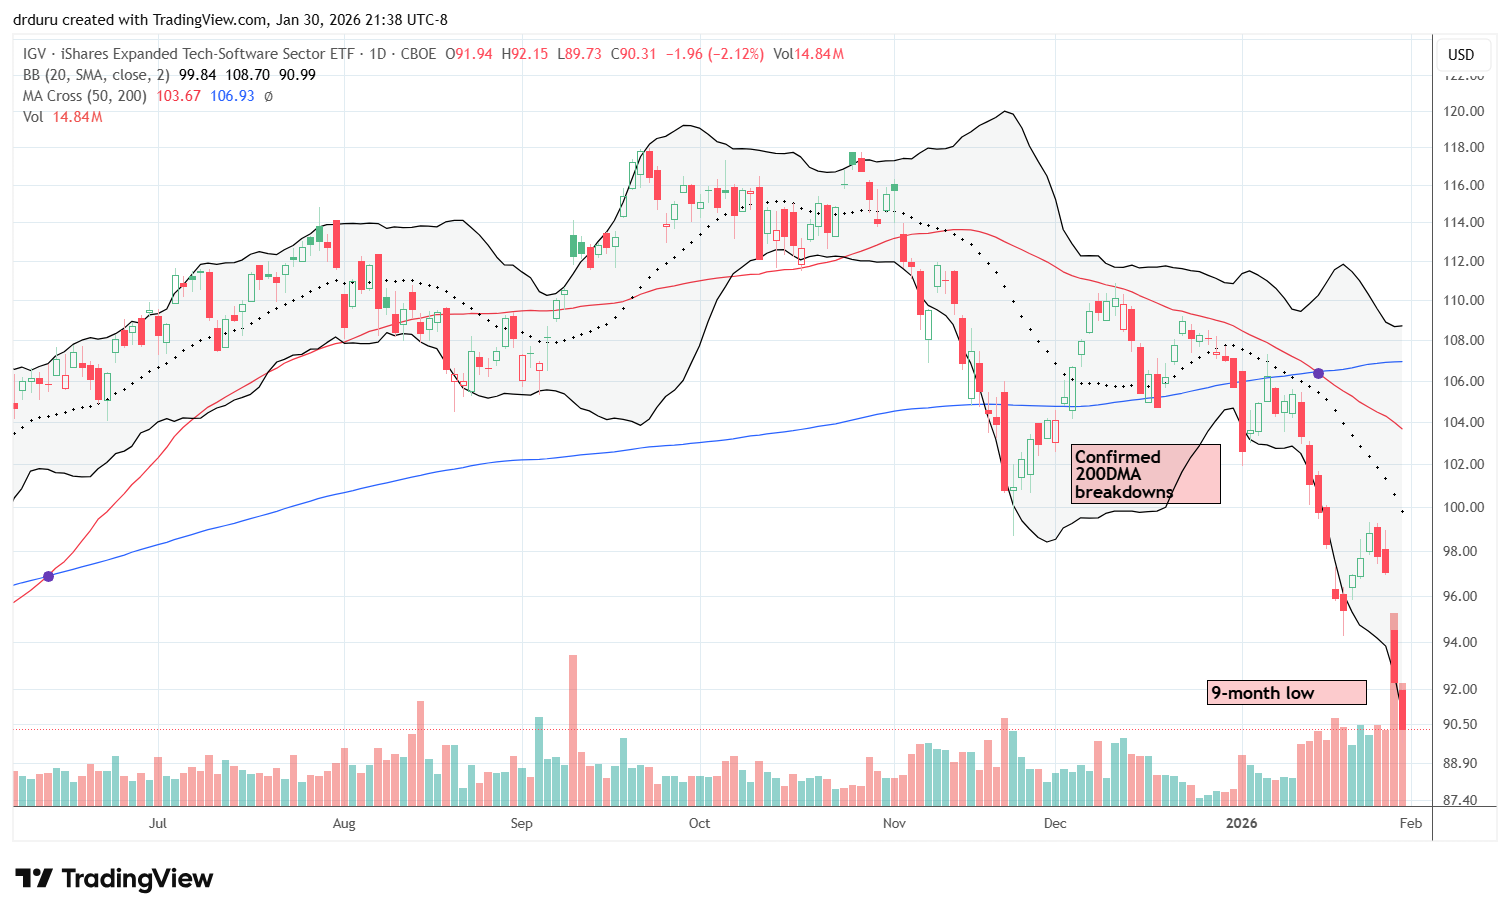
iShares Expanded Tech-Software Sector ETF (IGV)
Description: iShares Expanded Tech-Software Sector ETF (IGV) is an exchange-traded fund that holds U.S. software and tech-services companies.
Technical status: Catalyzed by MSFT’s collapse, the iShares Expanded Tech-Software Sector ETF (IGV) slid to a new 9-month low and a bear market.
Trade commentary: Microsoft helped IGV collapse on Thursday. IGV dropped 4.9% and sellers continued the pressure with another 2.1% loss on Friday. Buying beaten up software stocks is one of my themes for this year, but I did not expect to get swift and deeply discounted opportunities like this. Too many software stocks are in “falling knife” mode where support does not exist. These price dynamics are classic for the bear market IGV now finds itself in. As a result, I am staying patient and picking spots slowly but surely and strategically. I also now have time to study the space more closely as in “BOX Caught in an AI-Driven Software Selloff: Identifying Platform Opportunities Amid Market Fear“. I will be writing more pieces like this one in the months to come.
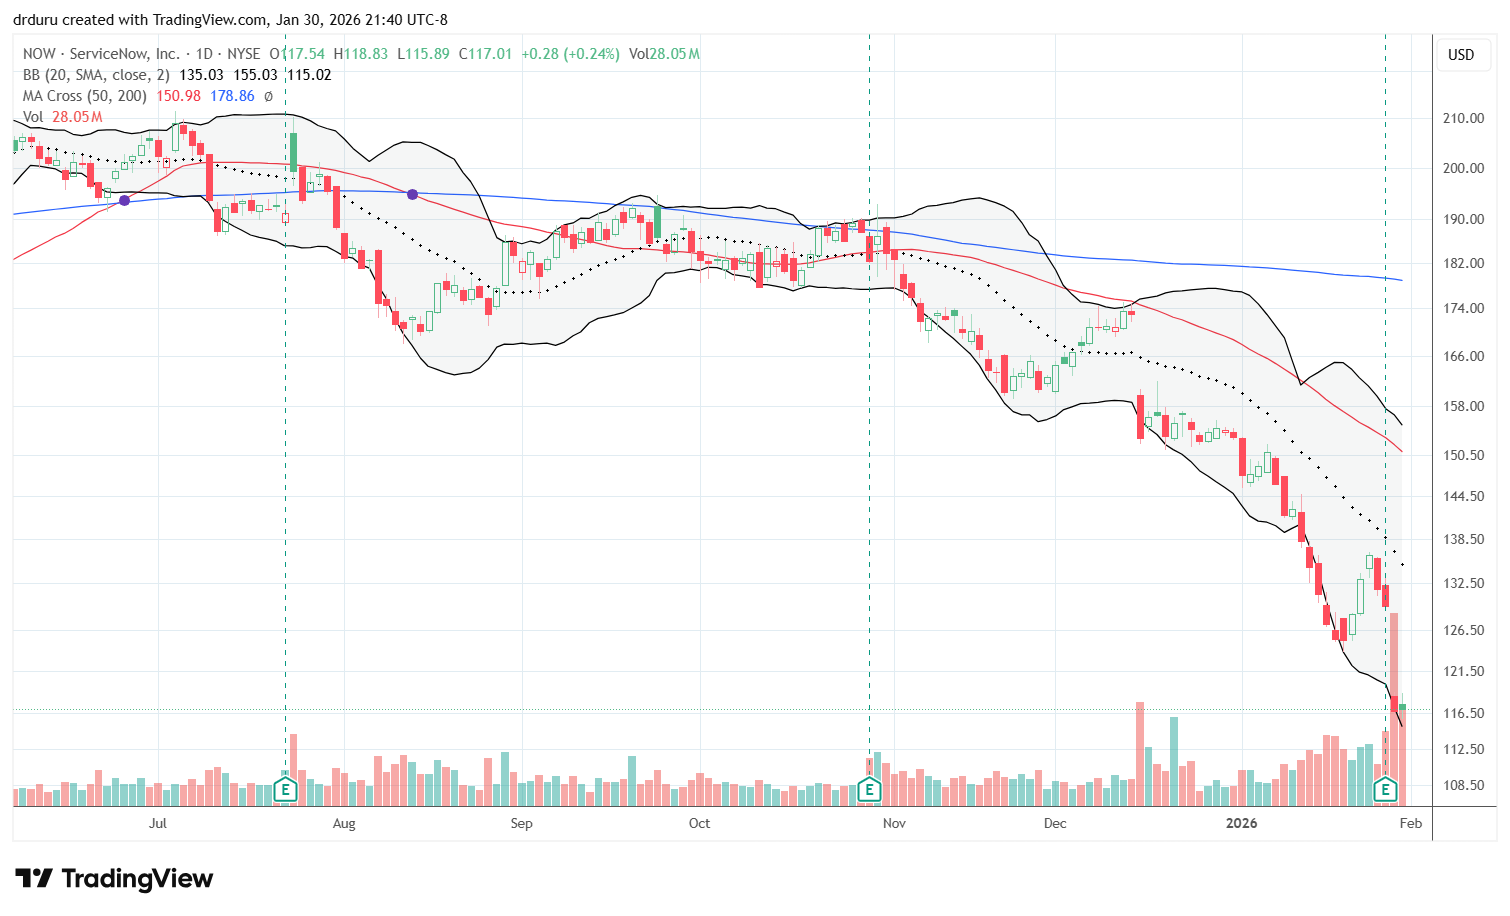
ServiceNow (NOW)
Description: ServiceNow (NOW) provides cloud-based workflow software platforms for IT service management, operations, and enterprise automation.
Technical status: ServiceNow (NOW) dropped 9.9% post earnings to a 26-month low. Hopefully Friday’s pause is the tentative start of stabilization.
Trade commentary: The AI-driven panic about software companies ironically loomed over the earnings results for ServiceNow. By all accounts, the company generated strong results that demonstrated the benefits of deeply integrating AI into the platform. Yet, my contrarian position in NOW reversed all my previous gains on a 9.9% post-earnings loss. NOW likely got ensnared by the fear and panic that Microsoft generated through the software sector. NOW last traded this low in November, 2023. I plan to add more shares at a later time.
Palantir (PLTR)
Description: Palantir (PLTR) develops data analytics and software platforms used by government and commercial organizations for decision-making and operations.
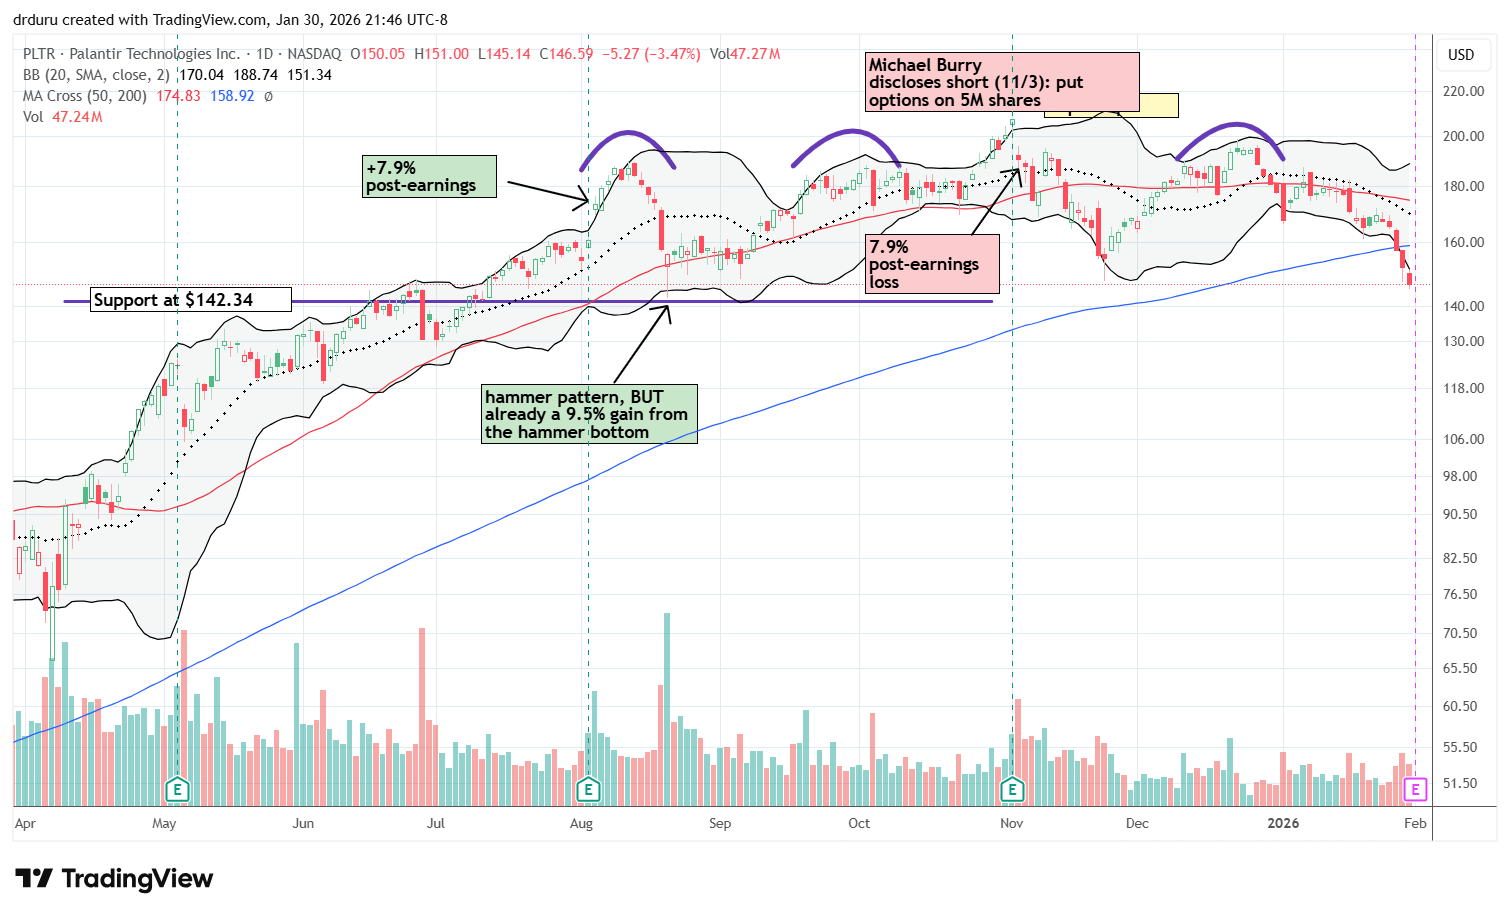
Technical status: Palantir (PLTR) broke down below its 200DMA in bearish confirmation of an extended topping process.
Trade commentary: Palantir sits at the nexus of software and AI. The stock now has a major topping pattern in place. Michael Burry put on a major short position on November 3rd that now looks prescient. PLTR has been stuck going nowhere since last summer. Moreover, PLTR printed what I will call a triple top with a neck or head in the middle. That brief all-time high ahead of November earnings was a major fakeout in the middle of what now looks like major distribution (the slow selling of shares from profit-takers to bag holders). Last week’s confirmed 200DMA breakdown essentially confirms the top. This week’s earnings needs to deliver a major upside catalyst for the stock. To the downside, PLTR has major support right around the corner at $142.34 where it printed a bottoming hammer in August.
Robinhood Markets (HOOD)
Description: Robinhood Markets (HOOD) operates a trading platform that offers brokerage services, cryptocurrency trading, and financial products for retail customers.
Technical status: Robinhood Markets (HOOD) confirmed a 200DMA breakdown with a 5-month low.
Trade commentary: HOOD is another stock that snuck under its 200DMA. A 1.7% loss on Friday confirmed the breakdown. HOOD last traded this low back in August, 2025. While I see a topping pattern developing, I remain a fan of the platform and the stock. So unlike PLTR, I am primed to look for a (deep) discount to buy as a part of this pullback. Note how HOOD has not been the same since it lost 10.8% following its last earnings report. A now downtrending 50DMA has effectively defined price resistance.

Booz Allen Hamilton (BAH)
Description: Booz Allen Hamilton (BAH) provides management and technology consulting services, primarily to U.S. government agencies and related clients.
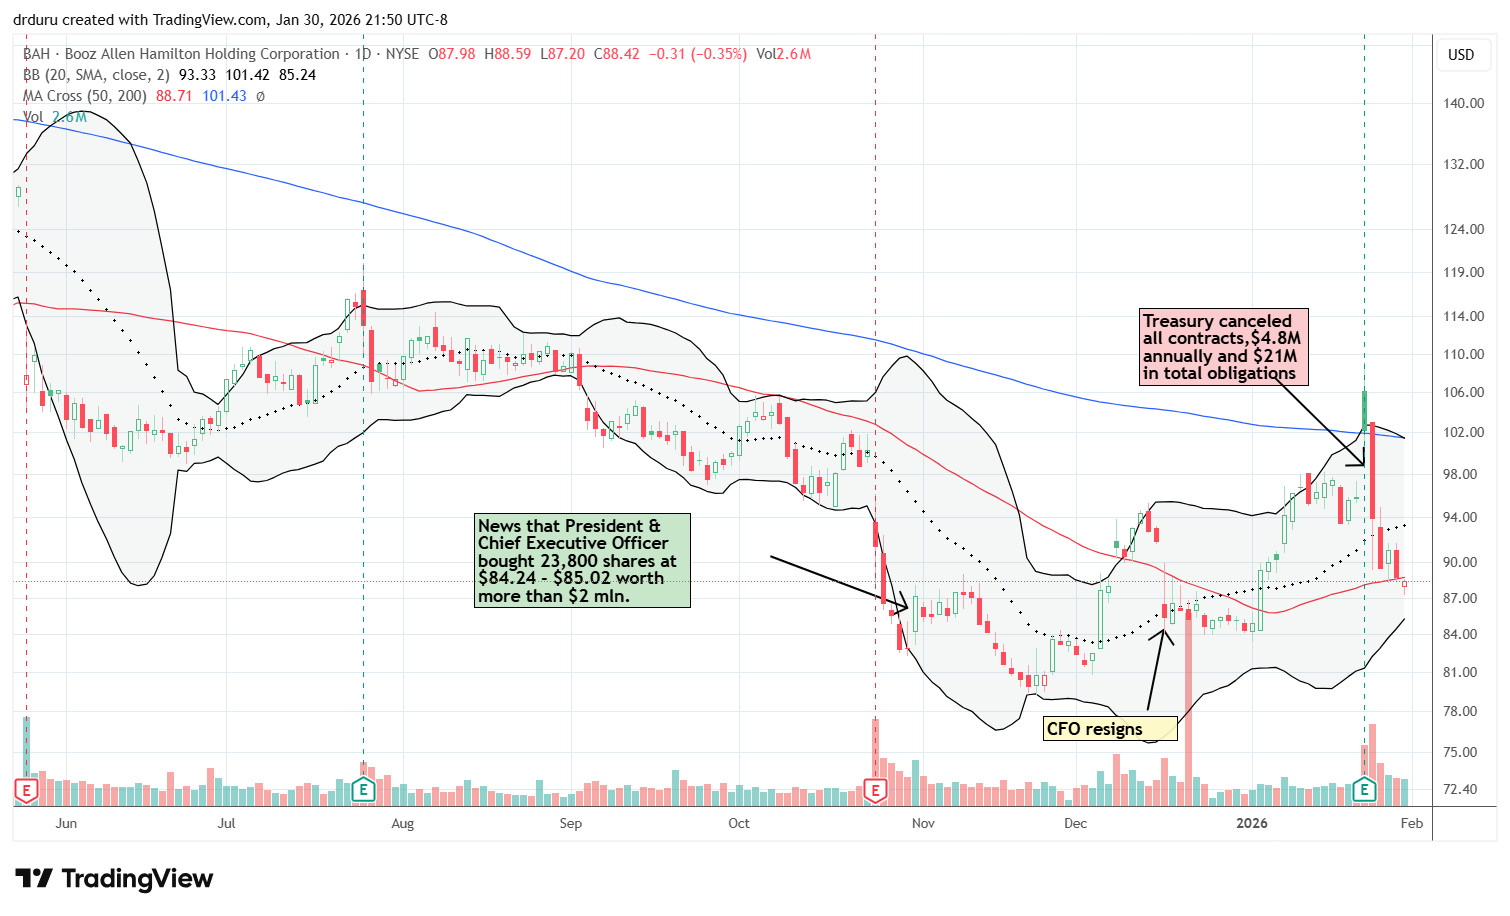
Technical status: Booz Allen Hamilton (BAH) suffered a sharp reputational rebuke from a cancellation of contracts with the Treasury Department. After failing to hold 200DMA support, BAH is right back to 50DMA support.
Trade commentary: I did not expect so much excitement and volatility in BAH. Just a week ago, I mapped out a plan for buying back into the stock on a successful test of 200DMA support. Instead, the stock collapsed right back to 50DMA support and quickly lost its post-earnings gains. I went from expecting I might have to chase BAH on a post-earnings breakout to relief that I took profits ahead of earnings.
The week opened with news that the Treasury Department cancelled all contracts after an insider was convicted of leaking private IRS information. The $24M loss in business pales in comparison to Booz Allen’s $12B in revenue in 2025, but the reputational risk looms large. Perhaps the CFO’s resignation in December was a telltale sign. Regardless, I am keeping BAH on my shopping list. At some point the reputational hit will fade, and the stock will once again present a major value, the kind of value I recognized after the President and CEO loaded up on shares last October.
IonQ (IONQ)
Description: IonQ (IONQ) develops quantum computing hardware and related software and cloud-access offerings.
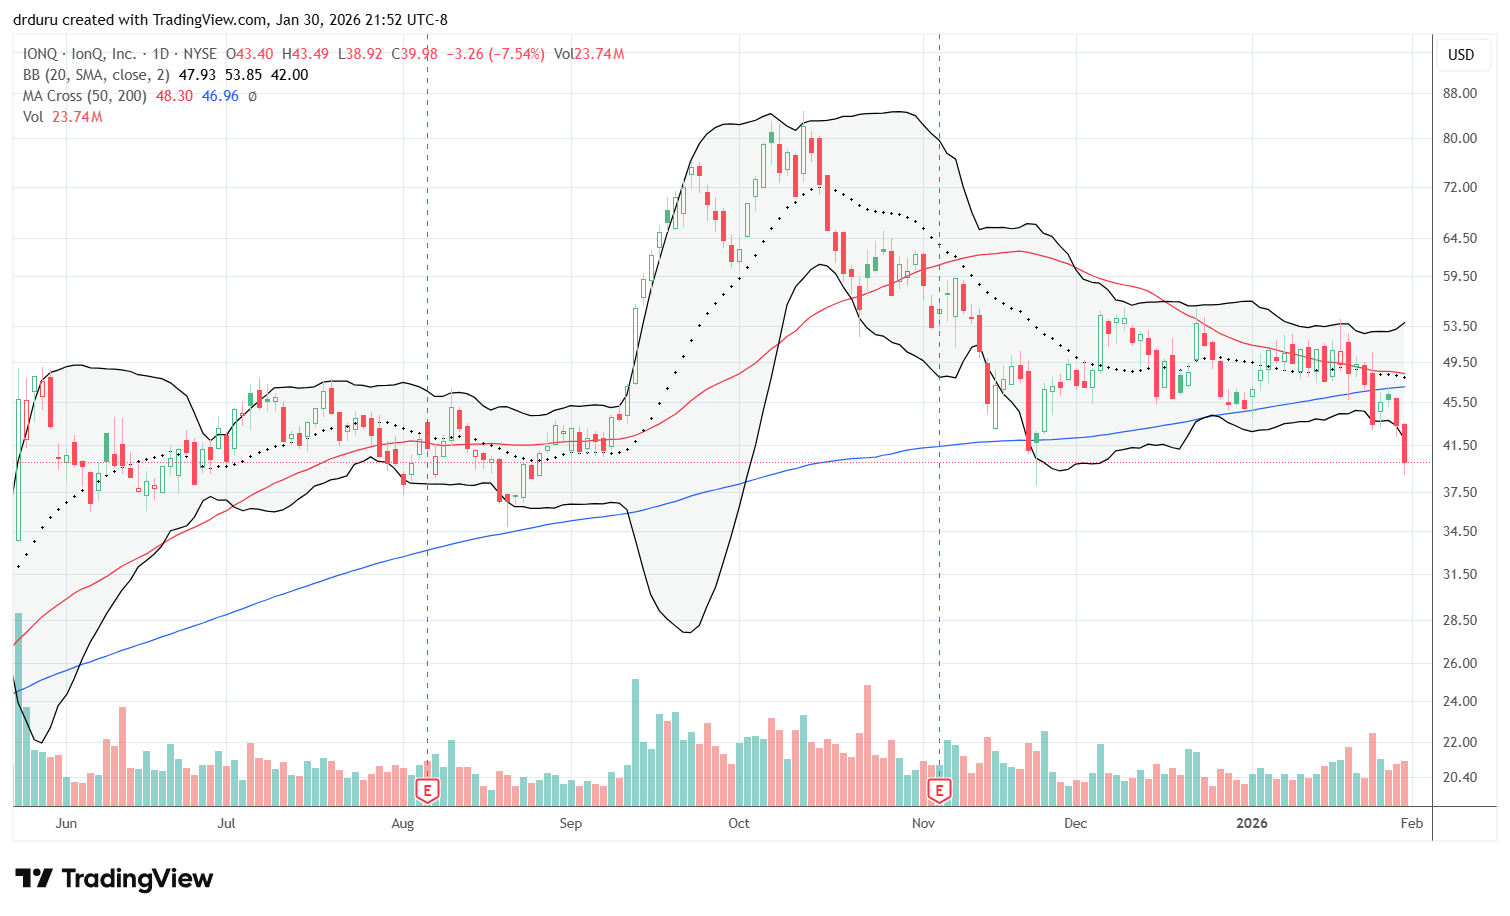
Technical status: IonQ (IONQ) confirmed a 200DMA breakdown with converging moving-average resistance overhead, leaving the stock vulnerable absent a strong positive catalyst.
Trade commentary: IONQ is another speculative stock with a confirmed 200DMA breakdown. Converged resistance from the 20DMA, 50DMA, and the 200DMA will make it difficult for IONQ to rally in the short-term. As a fan of IONQ – it is the only quantum computing stock that I trade – I am resigned to stay patient for the next buying opportunity given the bearish positioning for the stock. From here, I will only get interested in taking a fresh risk at much lower prices, like $18 to $21 from the 2025 lows.
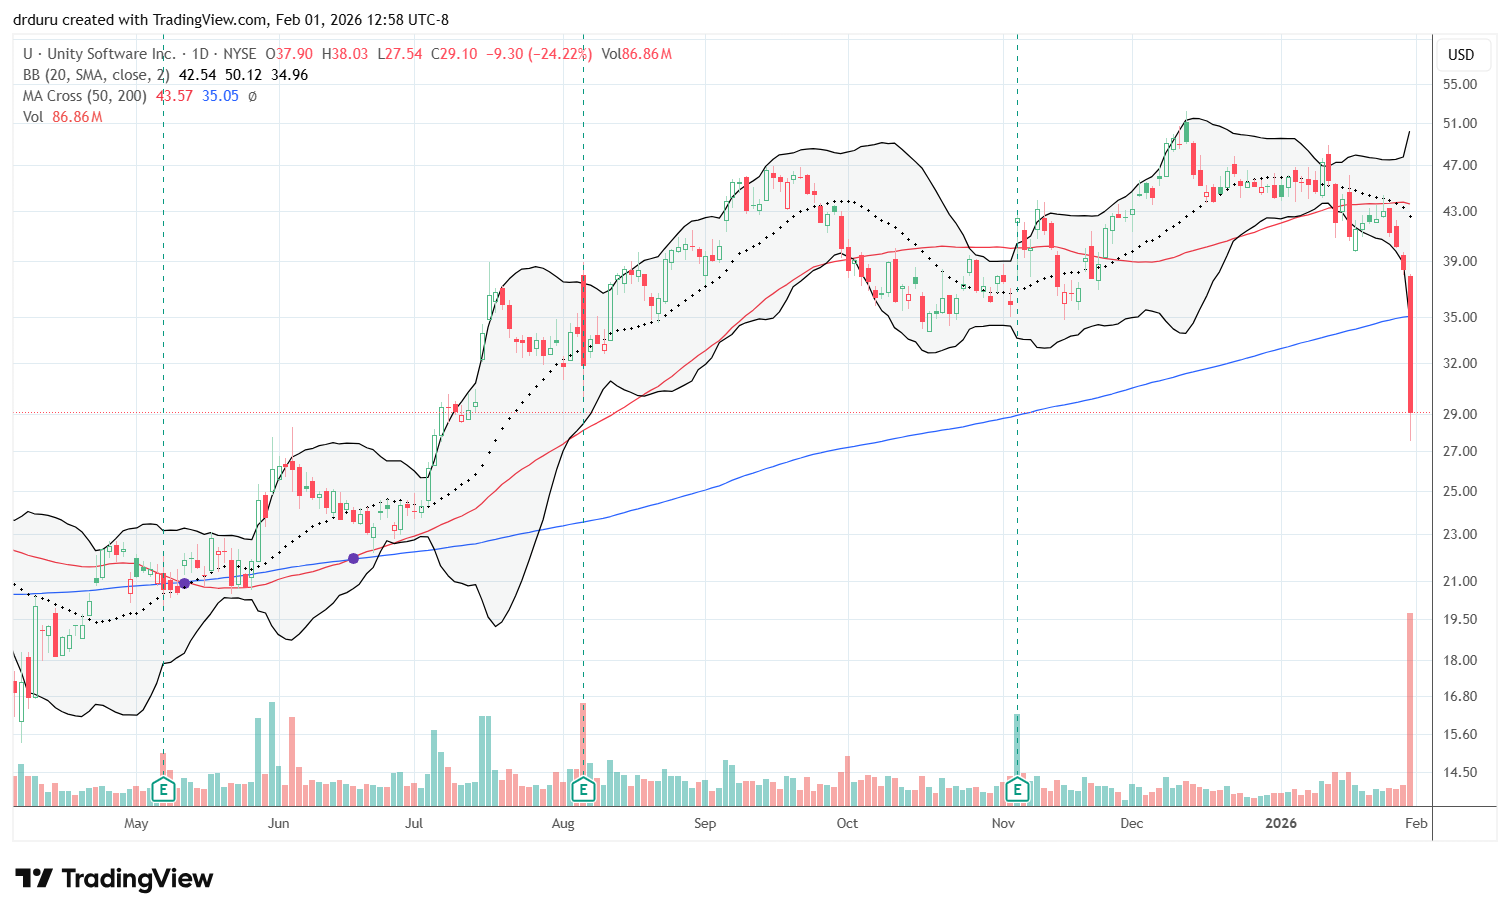
Roblox (RBLX)
Description: Roblox (RBLX) operates an online platform that enables users to create and play interactive experiences and social games.
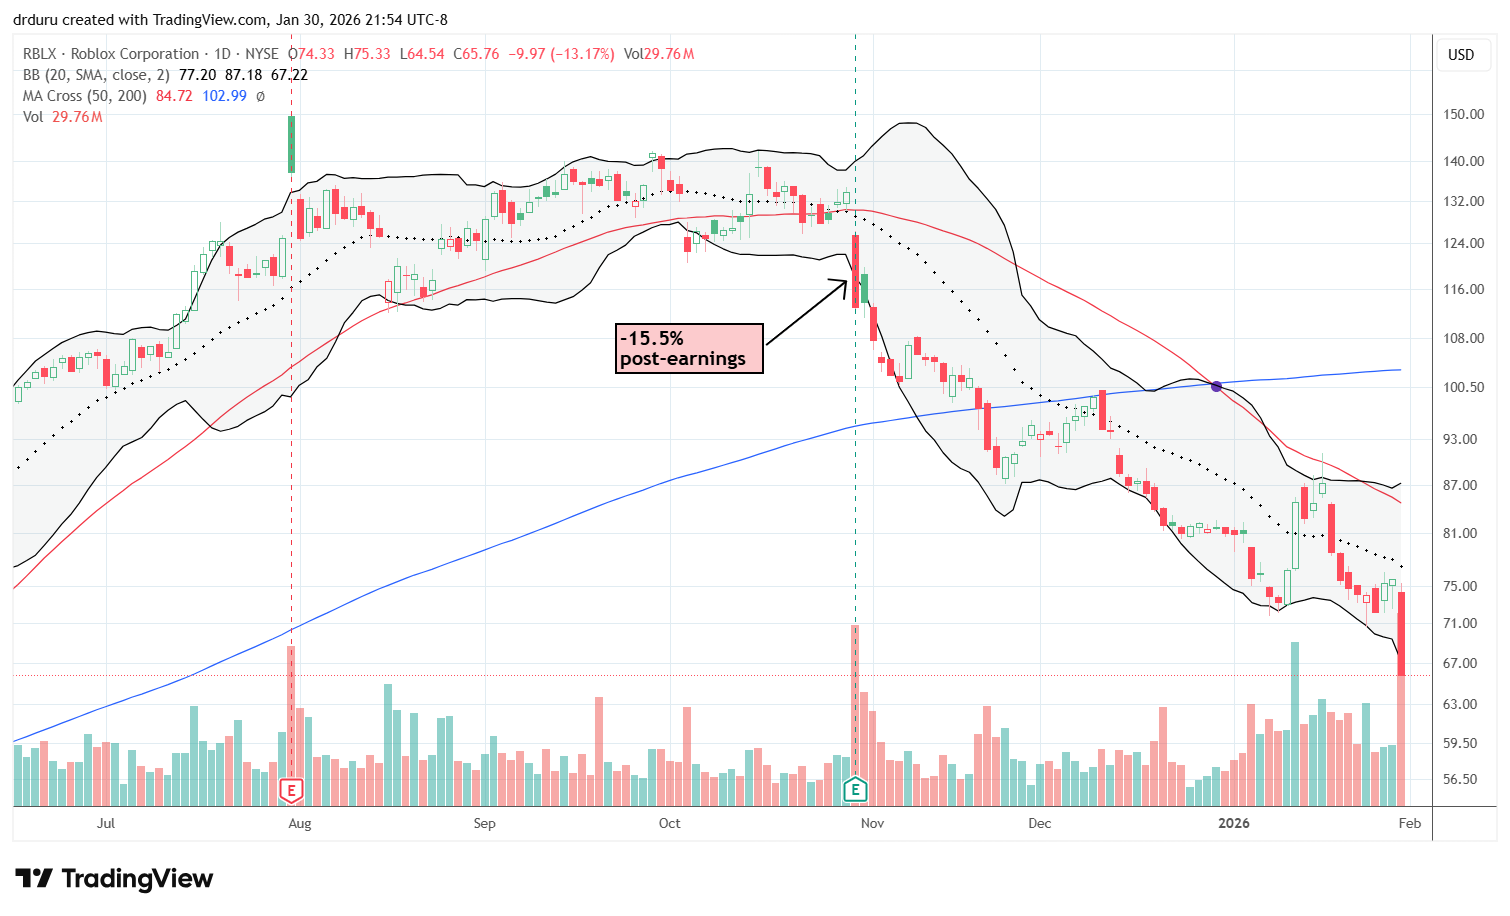
Technical status: Roblox (RBLX) extended a post-200DMA breakdown into a steep downtrend and sold off 13.2%, reinforcing the bearish signal of a fade from 50DMA resistance.
Trade commentary: Roblox snuck under its 200DMA back in November. The bearish signal was subsequently confirmed twice, first with a failed test of 200DMA resistance and then later a rejection from the downtrending 50DMA. The last bounce stopped short of downtrending 20DMA resistance thanks to a 13.2% pullback on a new AI game design tool from Google. Stock across the gaming platform sector, including Unity Software (U), sold off sharply. I am guessing that this news served as a reminder to refresh selling in software stocks on AI fears. Like the panic in software stocks, I suspect this gaming panic is overdone as well. However, I see no natural support for RBLX until around $50, the low from last April. I will revisit the stock on a test of that support.
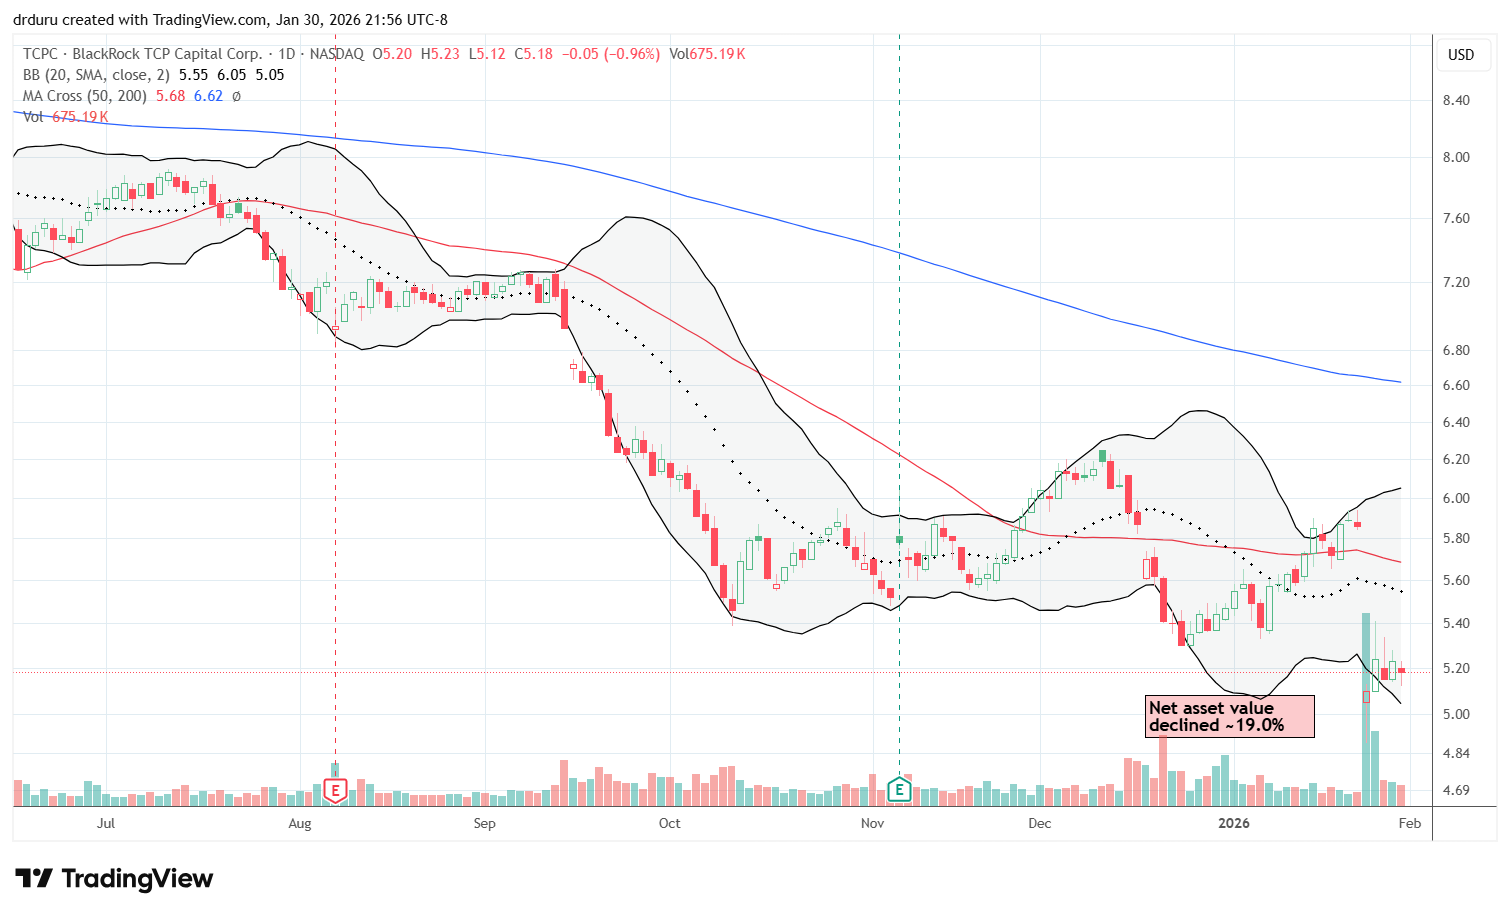
BlackRock TCP Capital (TCPC)
Description: BlackRock TCP Capital (TCPC) is a business development company that provides private credit financing to middle-market companies.
Technical status: BlackRock TCP Capital (TCPC) plunged after a 19% net asset value decline disclosure and continued a long-term downtrend that left the stock near pandemic-era lows.
Trade commentary: TCPC is a new stock for me. This private credit company has been in decline since a peak in 2021 which was the end of a sharp rebound from a pandemic collapse. Thus, more bad news and an accompanying pullback looks like no surprise. The company disclosed that net asset value declined 19%, and TCPC fell near pandemic lows. There is no reason to invest in a stock like this. Any guesses on a bottom need to come with tight stops and a strong technical setup. Let me know if you come up with one!
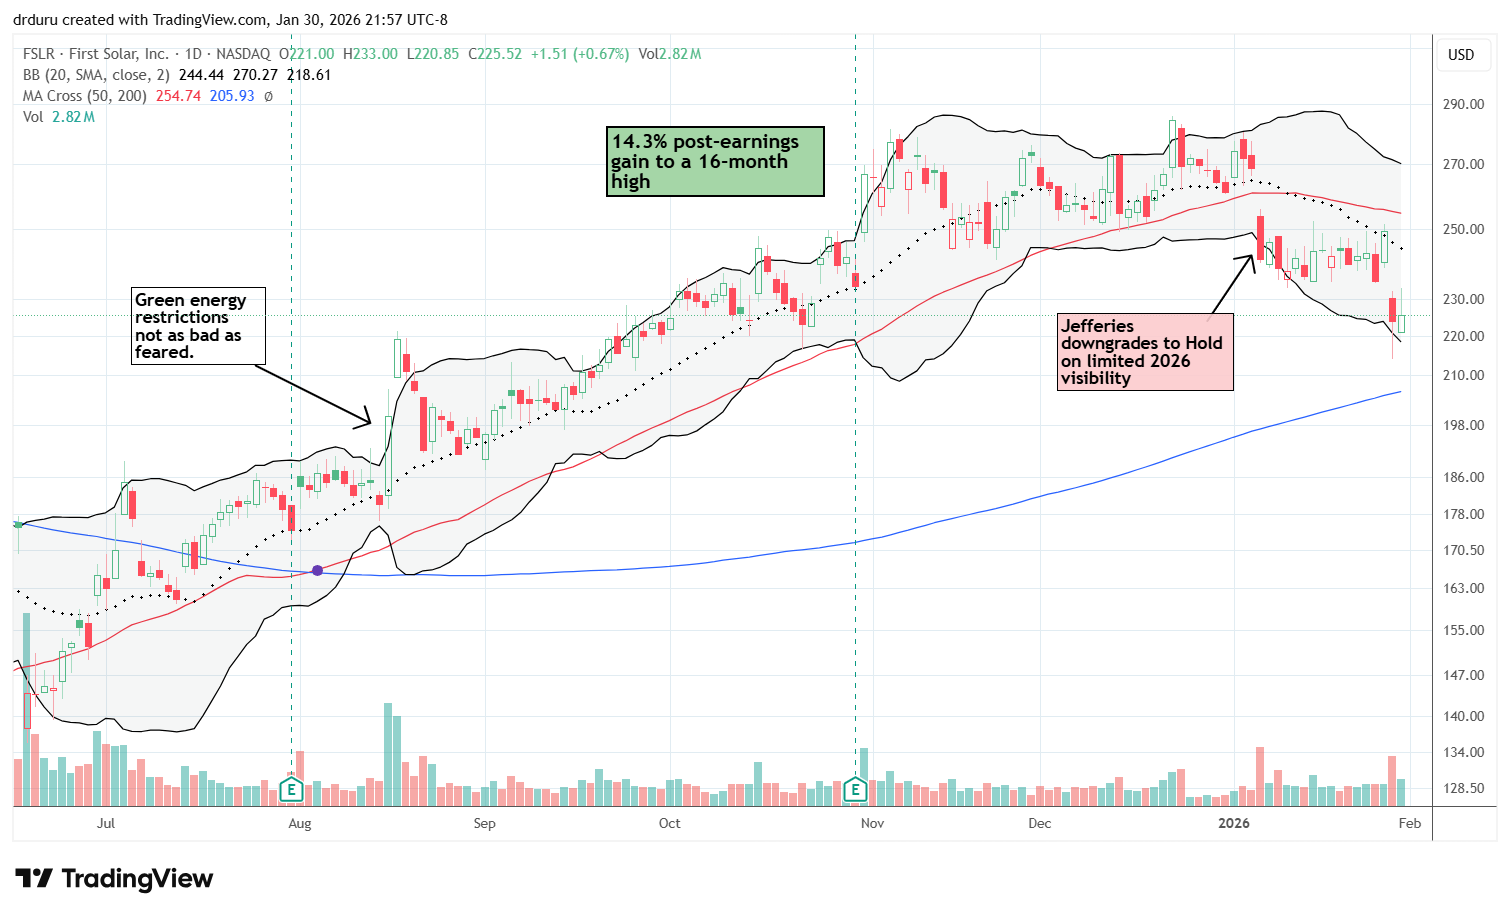
First Solar (FSLR)
Description: First Solar (FSLR) manufactures solar photovoltaic modules and provides related solar energy technology solutions.
Technical status: First Solar (FSLR) confirmed bearish territory with a renewed breakdown on a 10.2% loss. Support at the 200DMA is in play.
Trade commentary: Last month, I provided my case for taking profits on FSLR. I did not like the breakdown below the 50DMA. Last week, the stock broke down again with a 10.2% loss and is surprisingly diverging from the solar ETF TAN. The failure at 20DMA resistance validates my technical concerns. At some point, I will get back into FSLR. A test of 200DMA support will be the next point for me to review. I will remain patient.
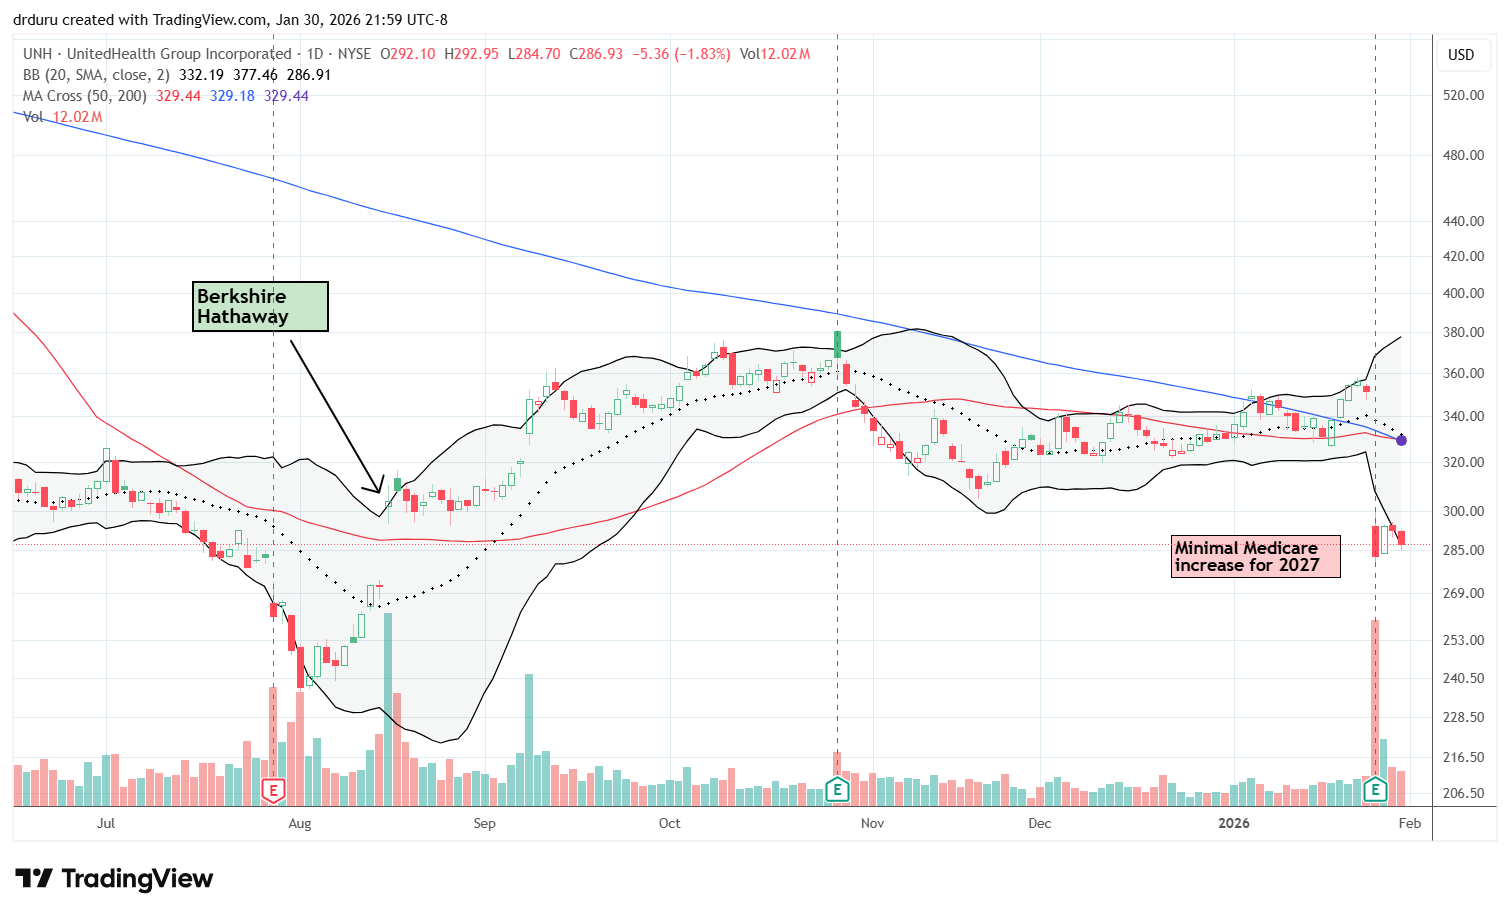
UnitedHealth Group (UNH)
Description: UnitedHealth Group (UNH) operates health insurance and healthcare services businesses through insurance plans and healthcare delivery and technology services.
Technical status: UnitedHealth Group (UNH) cratered nearly 20% on earnings and news of a minimal increase in Medicare rates for 2027. I flipped a short put option in the middle of the panic selling.
Trade commentary: I have been angling for a long-term investment in UNH ever since the stock broke out above its 50DMA resistance with news of a Berkshire investment. At that time, I sold a put option that worked out well. However, I was slow to buy shares as I wanted to see the stock pull off a 200DMA breakout. It failed nearly perfectly after reporting October earnings. The stock drifted lower from there.
I went right back to selling a put on last week’s 19.6% decline. The reaction seemed overdone, especially with the volume surge. The stocks 4.0% rebound the next day reduced the value of the put by 61%. I took profits there and decided not to press my luck. Given the latest news, I highly doubt UNH will pull off a 200DMA breakout for many months to come.
Stride, Inc (LRN)
Description: Stride (LRN) provides education technology and online learning programs and services for K–12 students and schools.
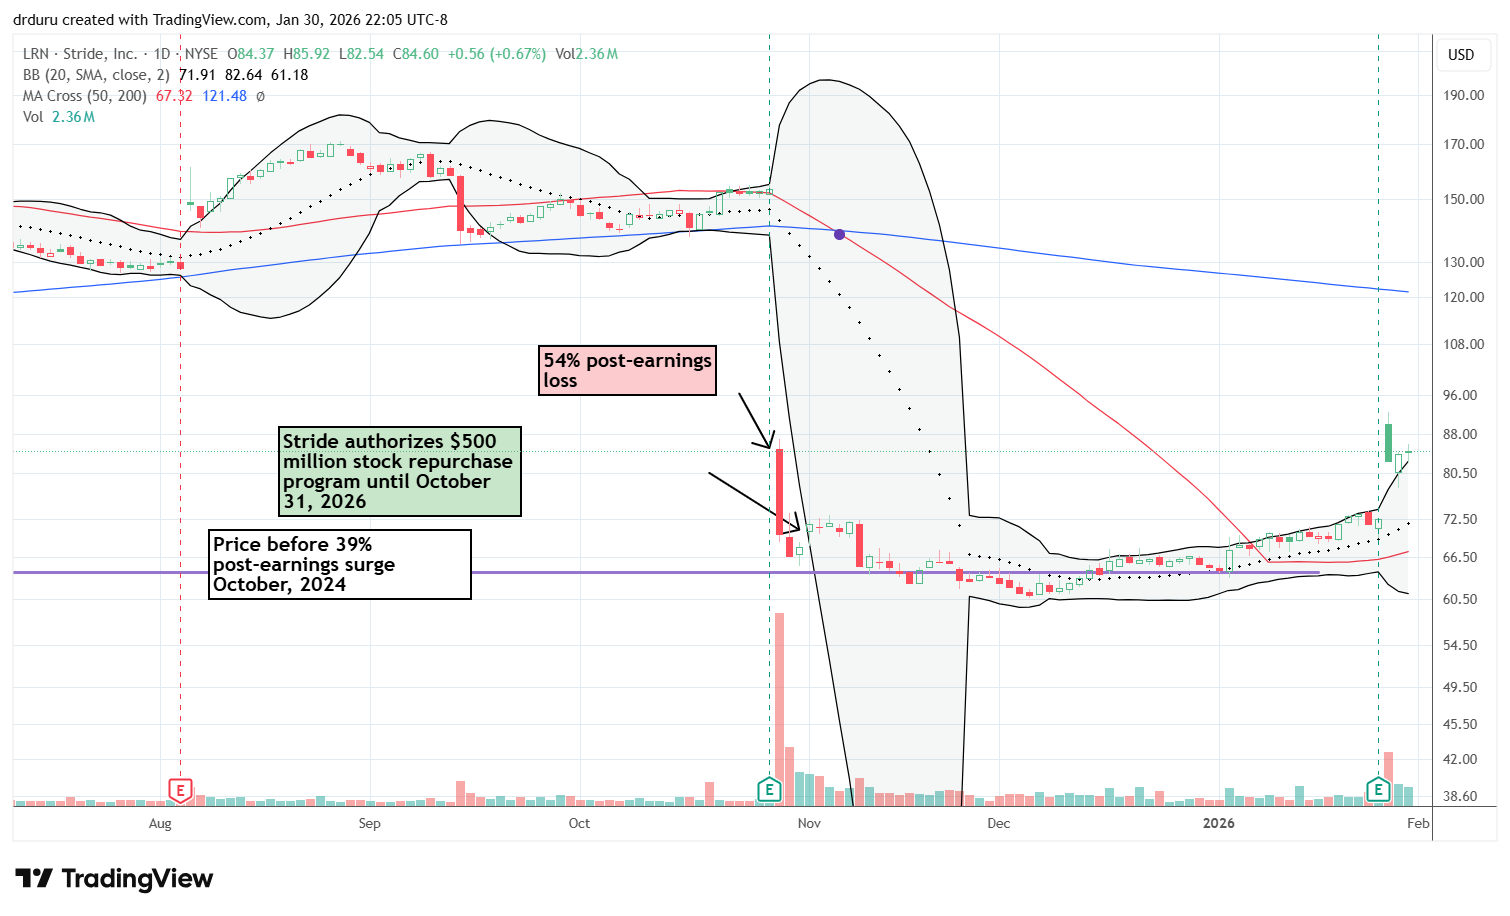
Technical status: Stride, Inc (LRN) gapped and crapped post-earnings with a +14.3% gain at the close. I took profits soon after the open. Subsequent market buying may be stabilizing the stock.
Trade commentary: I put LRN on my radar after a massive 54% post-earnings collapse. Soon after, the company announced a $500M buyback that convinced me to buy shares, and I added more shares after the stock experienced a pullback even after that announcement.
The payoff came a lot faster than I expected. LRN soared after hours as much as 34% following its earnings report. I was tempted to take profits there, but I decided to hold to see whether the stock could hold up in the subsequent regular session. It did not. LRN gapped higher about 24% and pulled back the rest of the day. The stock looked stable at the 18% point of gains, but I decided to close the position out there. LRN ended the day with a 14% gain. The confirmed lesson here is that an open significantly lower than the after hours mark represents a significant fade with momentum to be respected. The stock looks like it is stabilizing again, but I am unlikely to press my luck at higher prices. I am content to wait for the next pullback….if one comes.
Dollar Tree (DLTR)
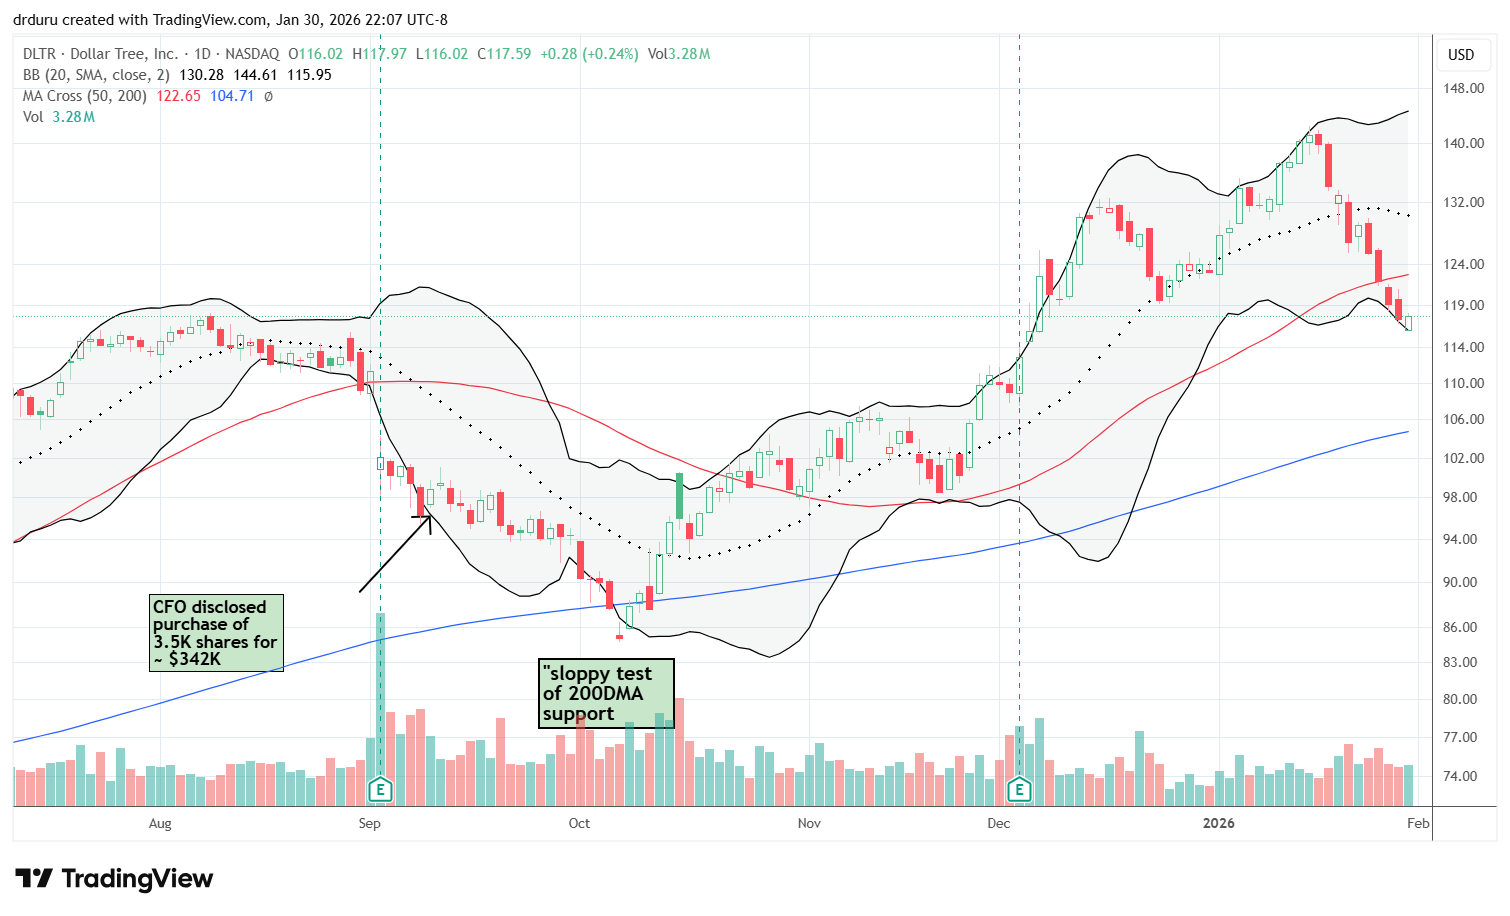
Description: Dollar Tree (DLTR) operates discount retail stores that sell consumables and household merchandise at value-oriented price points.
Technical status: Dollar Tree (DLTR) confirmed a 50DMA breakdown with a breach of December support. Support at its 200DMA may be in play.
Trade commentary: When I discussed my trade in DLTR in December, I assumed the stock would generally continue trending higher for some time. After surviving a pullback to 20DMA support the stock ran up to new highs. At that point, I realized DLTR was in a zone of significant resistance built from years of trading churn from 2021 to 2024. So I took profits and waited for the next pullback. That opportunity came right away, and I jumped back into the stock with a small position at 50DMA support. That support failed to hold, so now DLTR is in a bearish position. If DLTR survives a test of 200DMA support, I will add more shares. Otherwise, I am on hold.
")
")
Be careful out there!
Footnotes
Subscribe for free to get email notifications of future posts!
“Above the 50” (AT50) uses the percentage of stocks trading above their respective 50-day moving averages (DMAs) to measure breadth in the stock market. Breadth defines the distribution of participation in a rally or sell-off. As a result, AT50 identifies extremes in market sentiment that are likely to reverse. Above the 50 is my alternative name for “MMFI” which is a symbol TradingView.com and other chart vendors use for this breadth indicator. Learn more about AT50 on my Market Breadth Resource Page. AT200, or MMTH, measures the percentage of stocks trading above their respective 200DMAs.
Active AT50 (MMFI) periods: Day #160 over 20%, Day #49 over 30%, Day #47 over 40%, Day #42 over 50% (overperiod), Day #1 under 60% (underperiod), Day #133 under 70%
Source for charts unless otherwise noted: TradingView.com
Full disclosure: long IWM shares and calendar call spread, long SPY put spread, long GLD calendar call spread and short put, long MSFT, long NOW shares and call spread, long DLTR
FOLLOW Dr. Duru’s commentary on financial markets via StockTwits, BlueSky, and even Instagram!
*Charting notes: Stock prices are not adjusted for dividends. Candlestick charts use hollow bodies: open candles indicate a close higher than the open, filled candles indicate an open higher than the close.
* Blog notes: this blog was written based on the heavily edited transcript of the following video that includes a live review of the stock charts featured in this post. I used ChatGPT to process the transcript.