

Stock Market Commentary
Last week’s trading had something for almost everyone: volatility, churn, recovery, and a bank scare. A familiar story about renewed U.S.–China trade tensions expanded into a larger mosaic of market stress and resilience. Still, given market breadth remains broken, I see a market skating on the edge.
The volatility index (VIX) summarizes the week of churn. Monday’s rebound ignited by the President’s reassurance that everything will be fine with China took the VIX down 12.2%, reversing about half of the previous Friday’s surge. While the S&P 500 churned for the rest of the week, the VIX drifted higher until surging to a new 6-month high on Thursday as a mini panic erupted about bad loans in select regional banks. The faders stepped in with full force after the VIX gapped higher on Friday; presumably strong earnings from select regional banks provided a sliver of reassurance. The dust settled on a full reversal of Thursday’s surge. This bullish signal contrasts with the broken market breadth. The resolution of the push and pull will likely come from the technicals of resistance and support on the major indices as described below.
")
The Stock Market Indices
S&P 500 (SPY)
The S&P 500 gapped up Monday but immediately lost momentum. The 20-day moving average (DMA) (the dotted line) capped all trading action for the week. This trendline flipped from reliable support since the April breakout into into clear resistance. The tight range now holds the key to the next trading direction. A breakout above 20DMA resistance signals the next phase of the melt-up that has dominated trading for months. Moreover, a breakout would signal an end to the seasonal October pullback and setup the next several months of seasonal strength. A breakdown below the 50DMA (the red line) would be the first close below this important trendline since April. Even the previous Friday’s sharp pullback failed to test 50DMA support. Thus, a 50DMA breakdown could be a significantly bearish development.
")
NASDAQ (COMPQX)
The NASDAQ looks just like the S&P 500. Unlike the S&P 500, the tech-laden index has tested its 50DMA during this multi-month rally (just once). Still, the same breakout versus breakdown trading strategy applies to the NASDAQ.
")
iShares Russell 2000 ETF (IWM)
Unlike the S&P 500 and the NASDAQ, IWM surged to a new all-time high last week. This surprising relative strength is IWM’s strongest showing in a long time. Even though the ETF of small cap stocks pulled back to close the week just below its uptrending 20DMA, the overall 2.4% gain for the week adds to the positive side of the trading ledger. The surge in IWM allowed me to take my largest gain on IWM call options in a long time as well. Like clockwork, I established a new call option position on the pullback to the 20DMA. Given elevated volatility, I bought a call spread (Oct 24 247/257).
")
The Short-Term Trading Call With Melt-Up Vanished
- AT50 (MMFI) = 42.1% of stocks are trading above their respective 50-day moving averages
- AT200 (MMTH) = 56.1% of stocks are trading above their respective 200-day moving averages
- Short-term Trading Call: neutral
AT50 (MMFI), the percentage of stocks trading above their respective 50DMAs, closed the week at 42.1%. My favorite technical indicator made a valiant attempt to recover from the previous Friday’s plunge. However, after completing the recovery midweek, the mini scare about bad loans in regional banks tanked market breadth all over again. Although AT50 recorded a small gain for the week, market breadth remains broken. Accordingly, I remain wary about the underlying health of the market. My neutral rating for the short-term trading call now reflects my desire to wait for a breakout above the 20DMA or a breakdown below the 50DMA before committing to a bullish or bearish trading call respectively. AT50 is low enough for me to flip bullish on the next positive catalyst. Moreover, the seasonally strong period for the stock market starts after the maximum drawdown in October.
The Equities: Broken
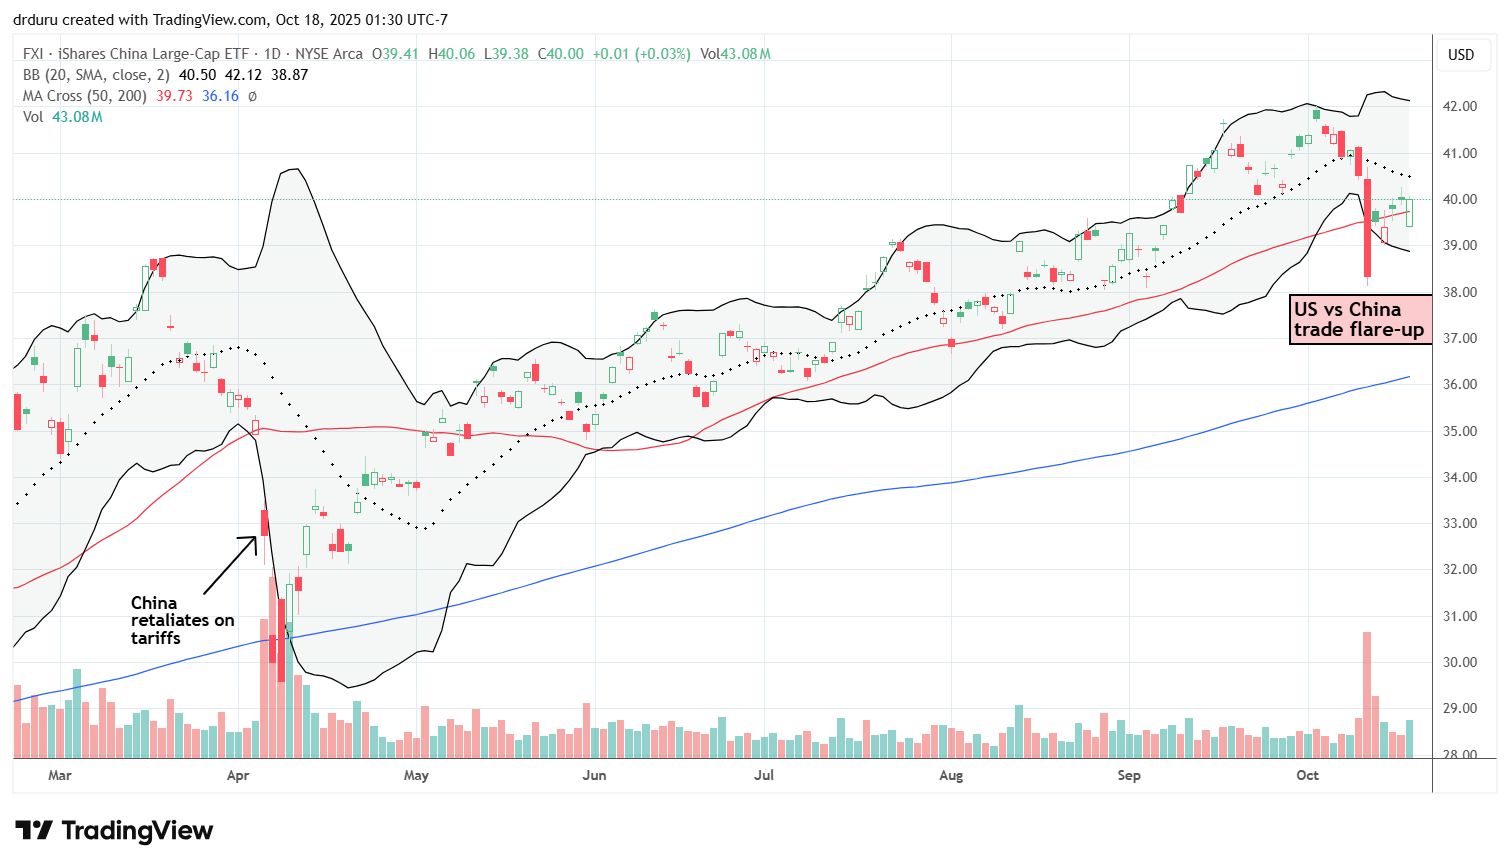
iShares China Large-Cap ETF (FXI)
Description: FXI tracks large-cap Chinese companies traded in Hong Kong.
Technical status: FXI dropped 5.4% last Friday amid renewed U.S.–China tensions, then recovered 3.1% Monday before turning choppy around its 50DMA. The 20DMA is now sloping downward, signaling potential resistance.
Trade commentary: I am not trading FXI but use it as a barometer for how bilateral tensions affect both U.S. and Chinese equities. Notice how the 50DMA supported FXI since the April tariff drama, trauma, and noise until the latest convulsions. I see poetry in the immediate rebound to a pivot around the 50DMA.
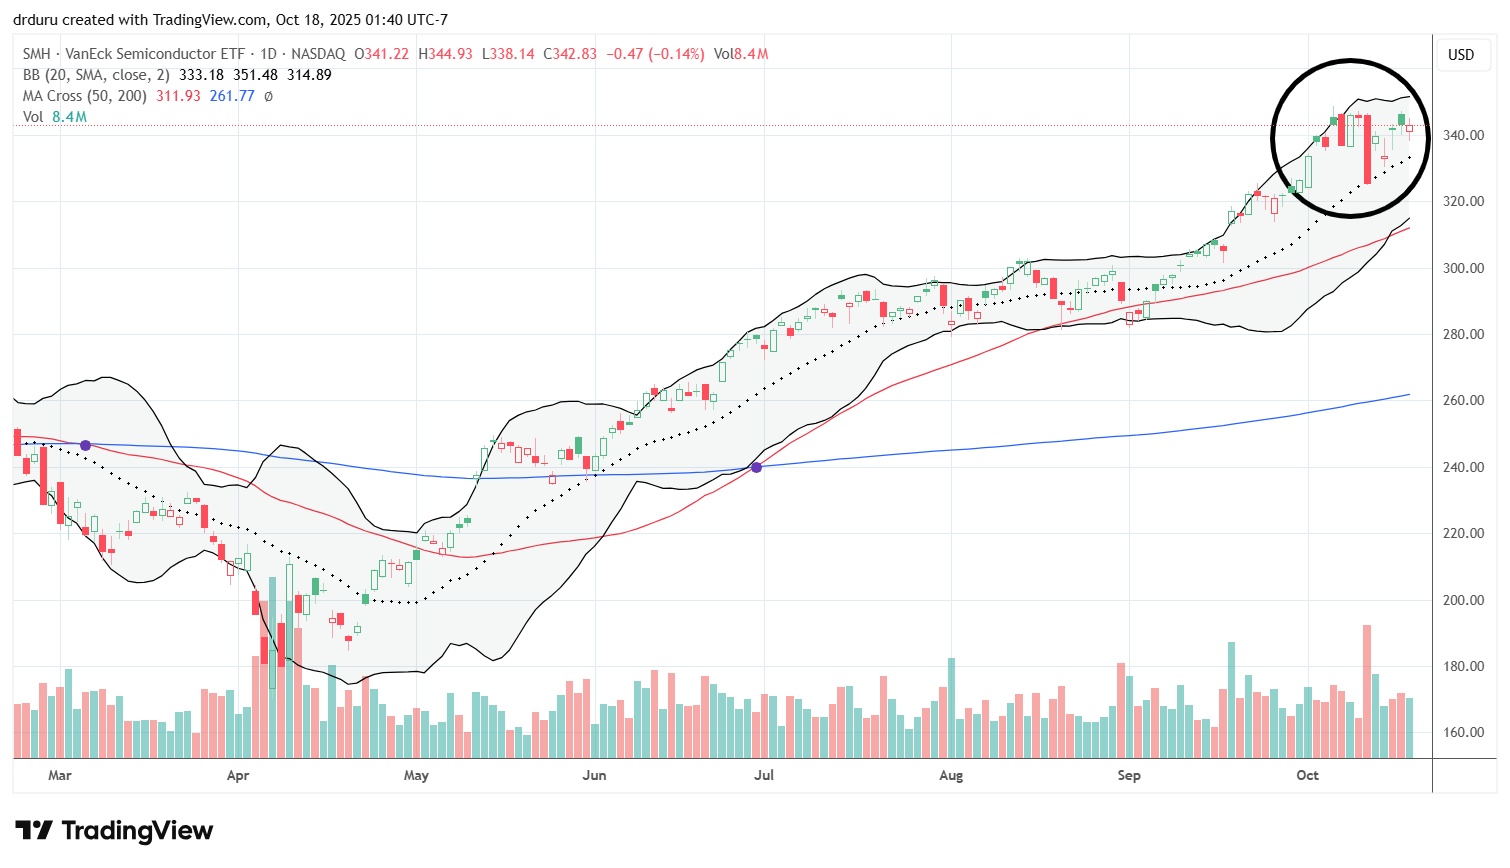
VanEck Semiconductor ETF (SMH)
Description: SMH tracks leading U.S. semiconductor stocks.
Technical status: SMH fell 5.8% the previous Friday but rallied 4.4% Monday. The ETF of semiconductors held 20DMA support despite a 1-day bout of underperformance on Tuesday’s 1.8% loss.
Trade commentary: The semiconductor sector’s resilience highlights its leadership even amid macro volatility. SMH should remain solidly bullish.
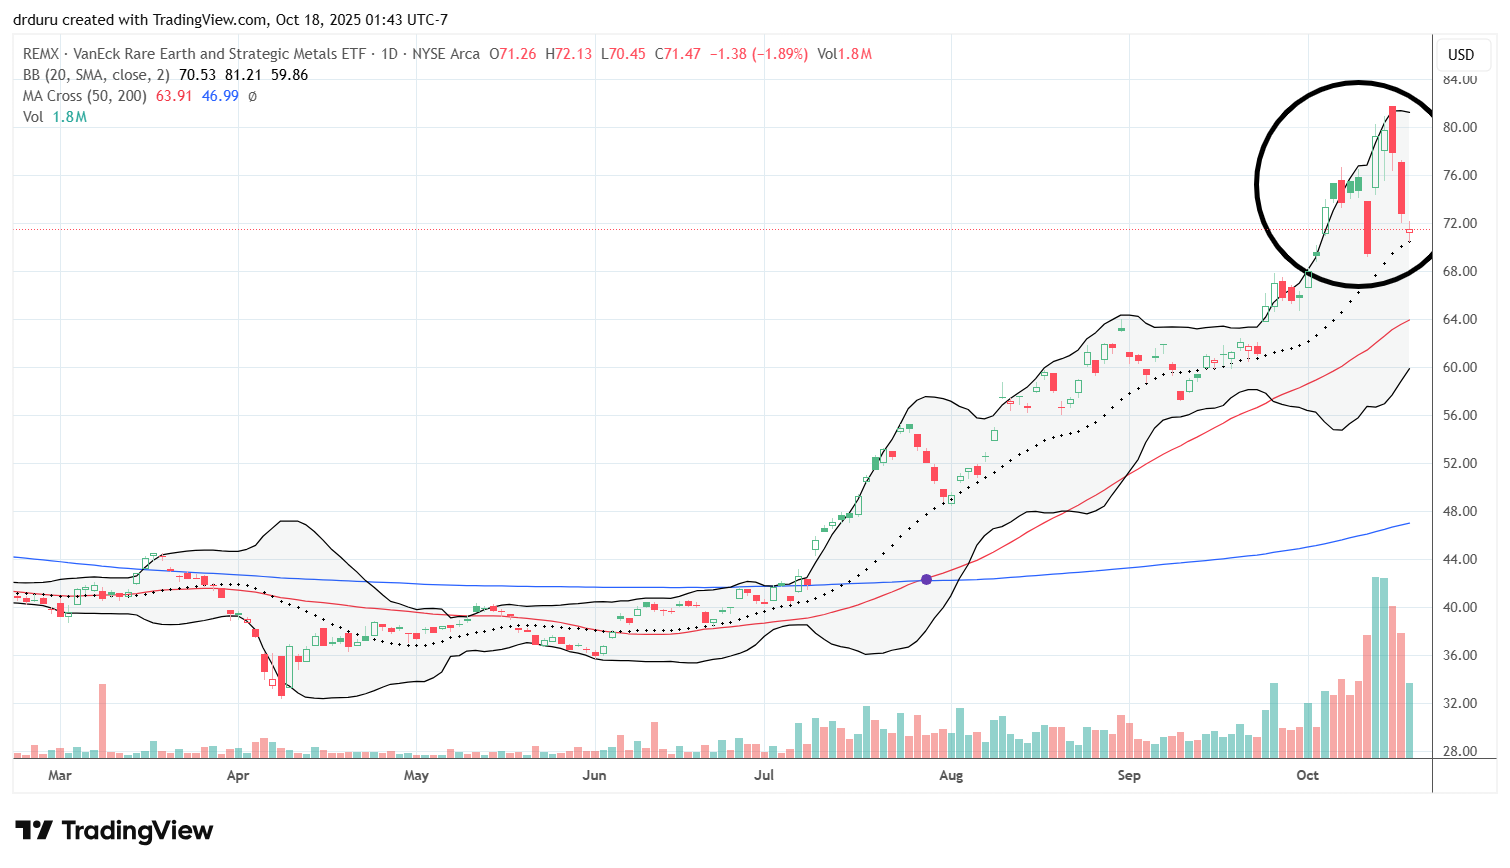
VanEck Rare Earth and Strategic Metals ETF (REMX)
Description: REMX tracks companies involved in rare earth and strategic metal production.
Technical status: REMX dropped 7.1% the previous Friday but then surged 14% Monday, setting a new 2+ year high. The subsequent cool-down set up a picture-perfect test of uptrending 20DMA support.
Trade commentary: After missing the entire rally, I was happy to get a chance to buy the pullback to support for a no regrets trade. I did not understand why REMX fell sharply on the China trade tensions when REMX includes companies that benefit from domestic development. However, there are also companies dependent on China’s rare earth materials and processing. Regardless, the recent big moves are large convulsions that likely mark a transition. If REMX trades lower, I will accumulate more at support levels like the 50DMA around $64. (Note Albemarle Corporation (ALB) is a large component, so buying REMX gets me back in after deciding to take profits in the stock).
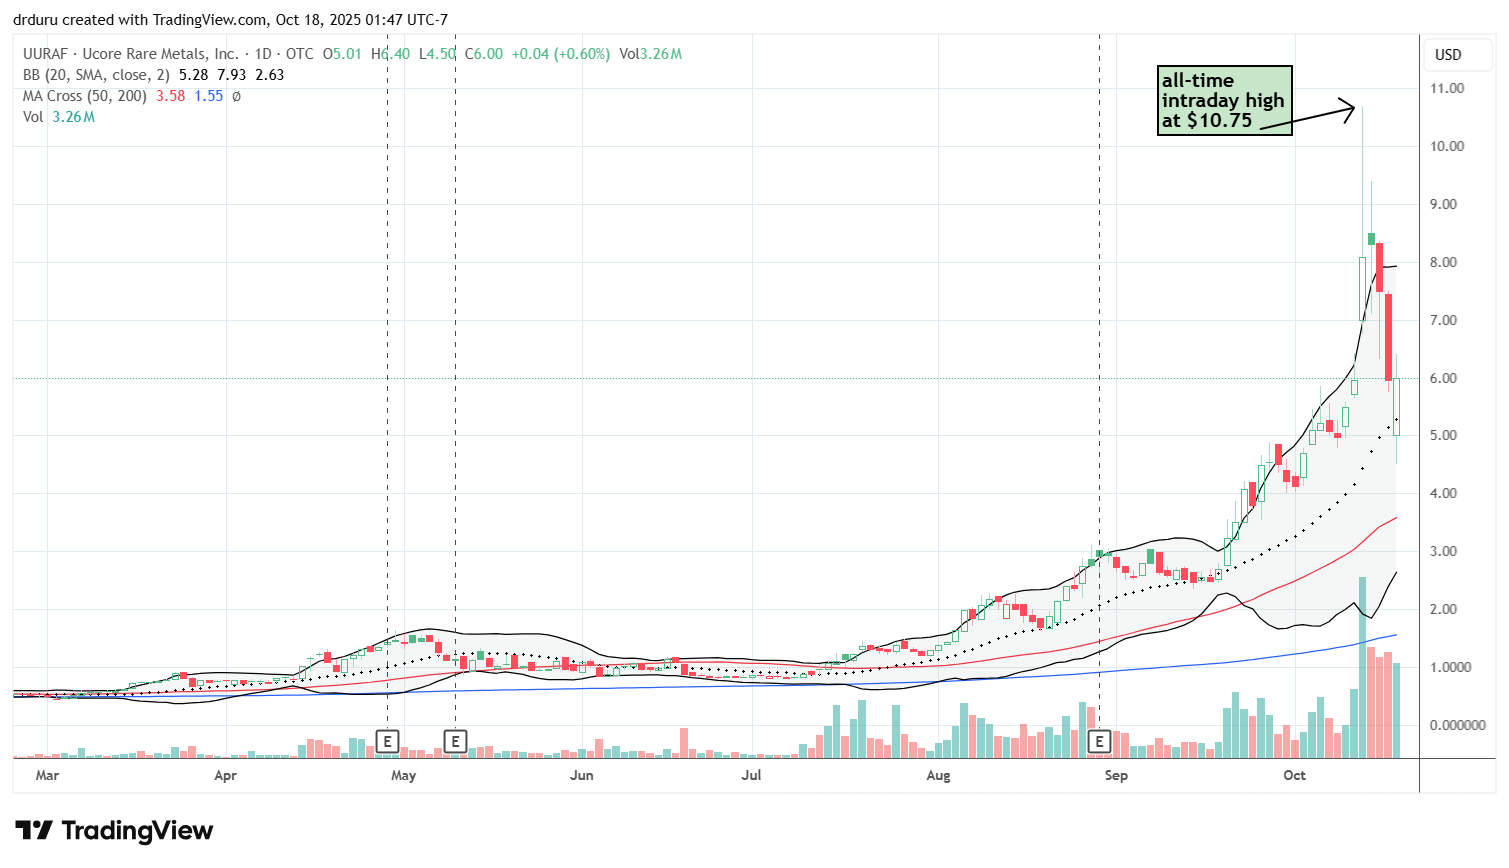
Ucore Rare Metals (UURAF)
Description: Ucore Rare Metals is a Canadian technology company focused on developing and commercializing a proprietary process for separating and purifying rare earth and critical metals, while also developing its heavy rare earth element resource in Alaska.
Technical status: UURAF fell to 20DMA support near $4.57 after a massive run from under $1 to over $10 earlier in the year.
Trade commentary: I bought on the dip at 20DMA support as another no regret trade. UURAF fell as much as 60% from its recent intraday all-time high, a substantial pullback but paling in comparison to the overall run-up. The sharp and immediate rebound on the day from support was a pleasant surprise.
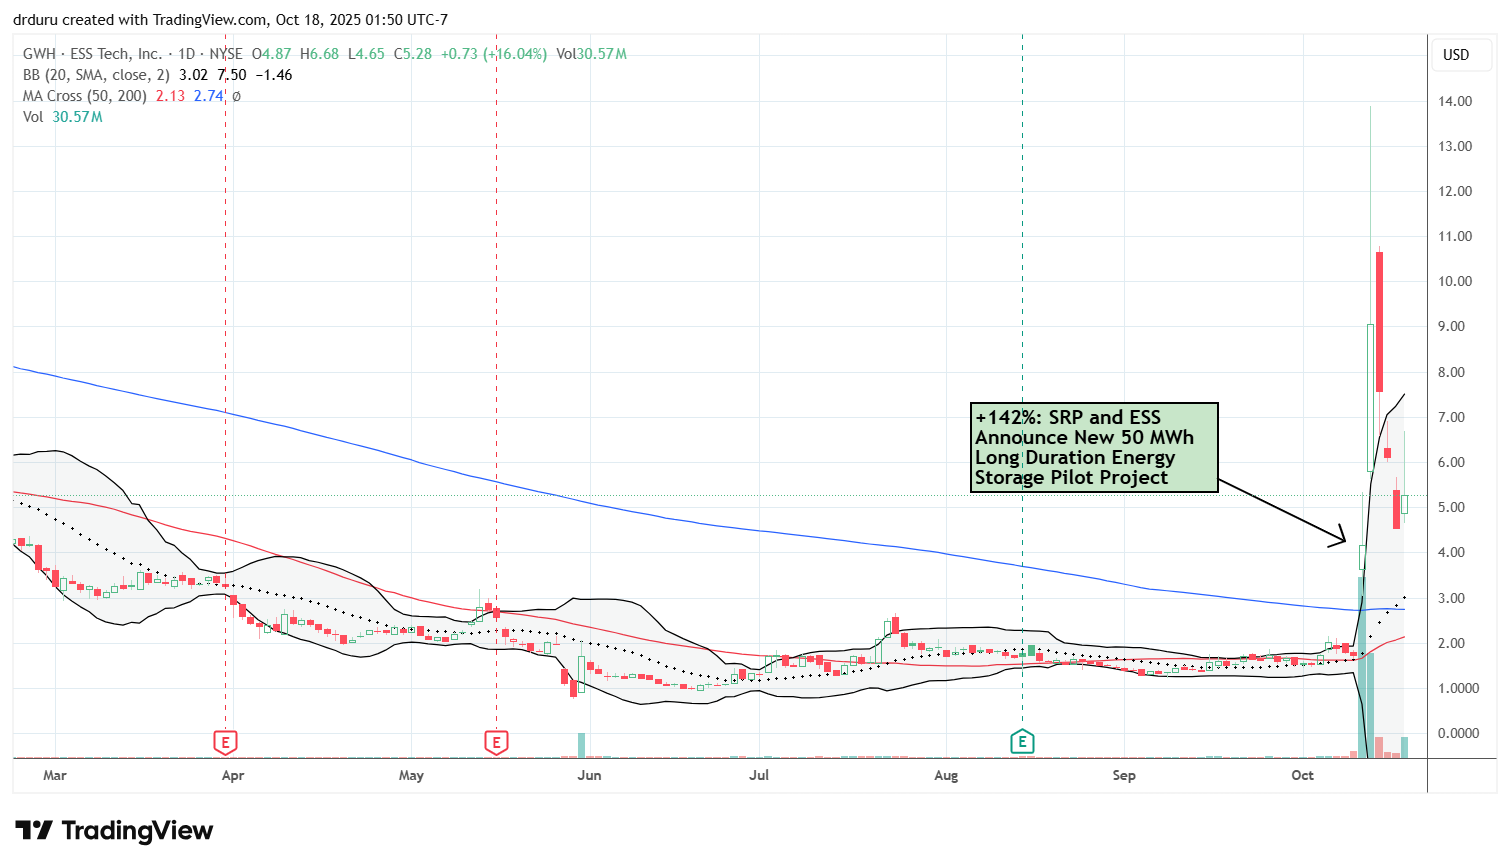
ESS Tech (GWH)
Description: ESS Tech develops iron flow battery solutions for energy storage.
Technical status: GWH soared 142% Friday on on news of a new 50 MWh long duration energy storage pilot project. The stock followed through the next day with a gain as much as 233% before settling for a 117% gain. A gap up the next day finally exhausted buyers. GWH ended the week down 62% from the intraday high of the week.
Trade commentary: On theme, I eyed GWH for a no regrets trade. After three straight down days, I determined to buy on Friday. I nibbled on shares as soon as I saw the positive open and was shocked to see the stock soar all over again, but I held on. I am prepared to add more if GWH returns toward 200DMA support near $2.80.
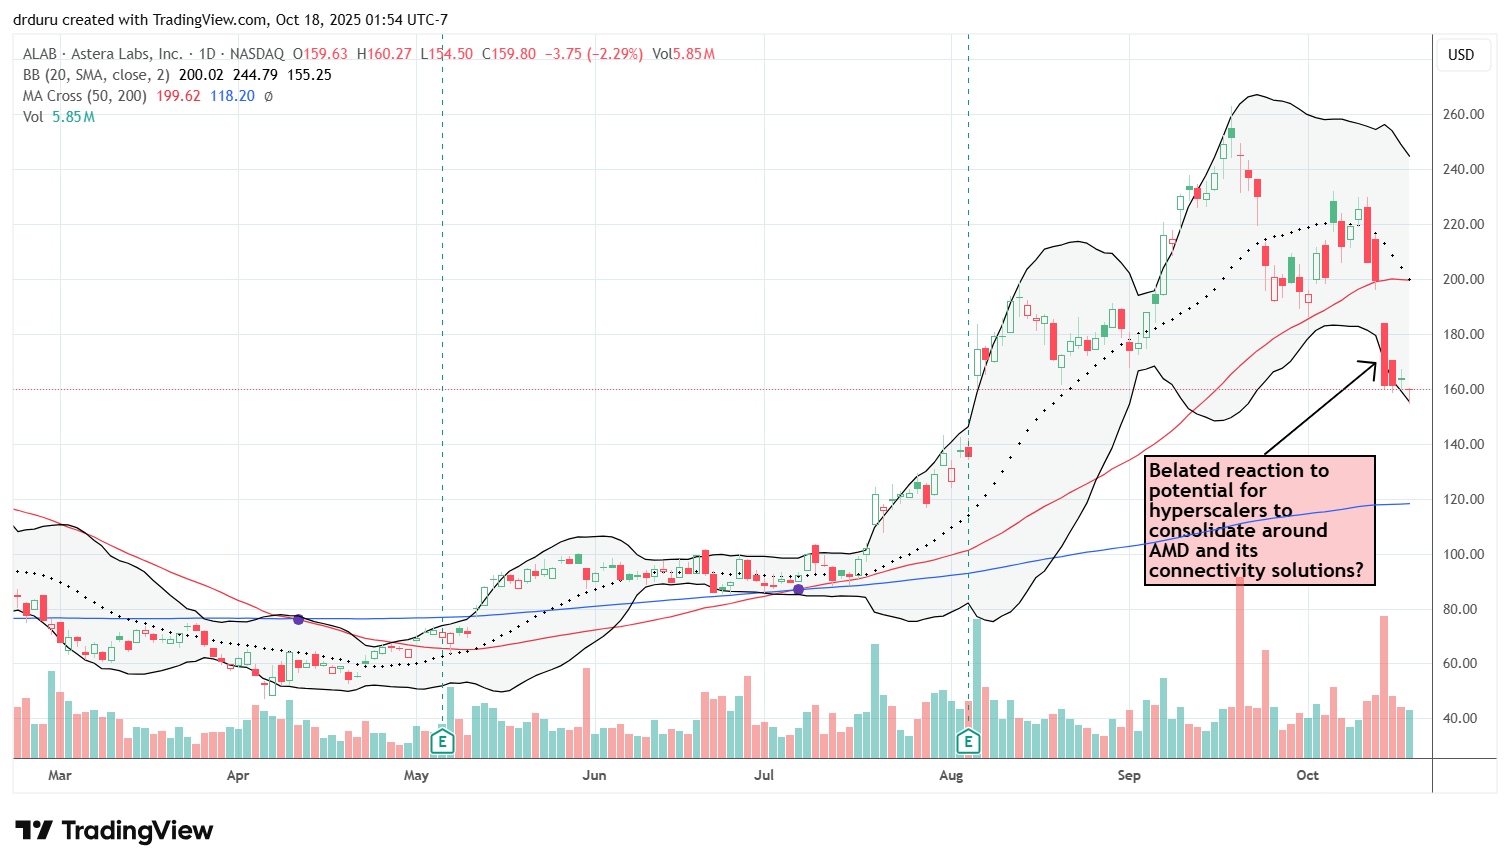
Astera Labs, Inc (ALAB)
Description: Astera Labs designs connectivity solutions for data centers and AI infrastructure.
Technical status: ALAB plunged 19% Tuesday, breaking its 50DMA and entering bearish territory.
Trade commentary: When Advanced Micro Devices (AMD) soared on news of a mega-deal with OpenAI, I never considered negative impacts on competitors. I first learned about ALAB last week when the market sold off ALAB in some kind of delayed reaction. While I have no interest in buying ALB here, I added the stock to my (growing) list of AI-related stocks.
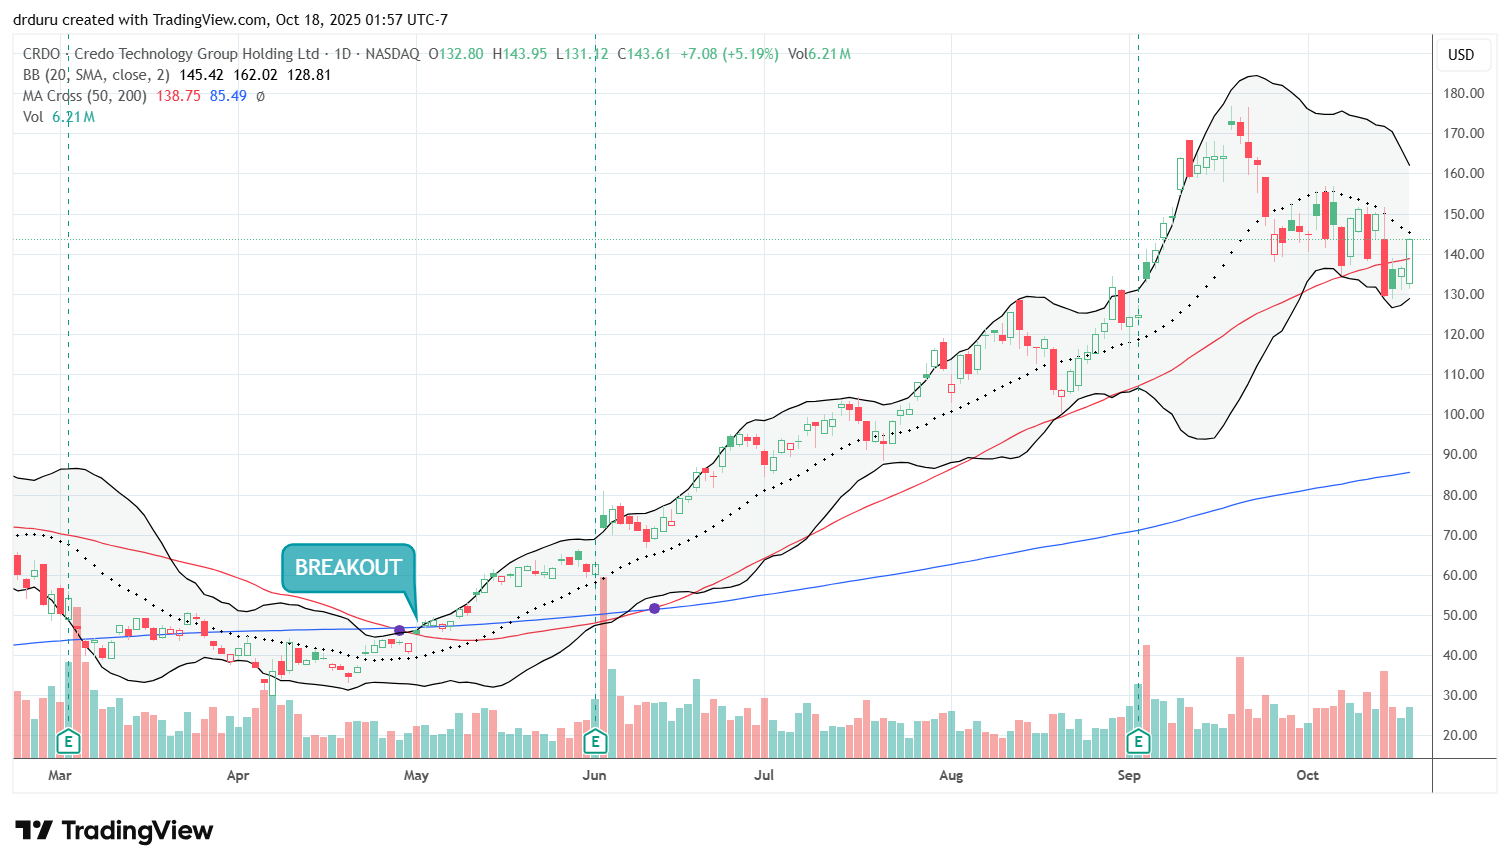
Credo Technology Group (CRDO)
Description: Credo develops high-speed connectivity solutions for data infrastructure.
Technical status: CRDO has struggled under its 20DMA after topping earlier this year. It’s now pivoting around its 50DMA.
Trade commentary: I checked out CRDO after seeing ALAB sell-off. Sure enough, CRDO sold off 13% in sympathy. Unlike ALAB, CRDO recovered by the end of the week. Still, its 20DMA held as resistance. I bought the big breakout for CRDO and took profits well ahead of the final topping pattern. CRDO still has my interest but the AMD twist on the narrative makes the trade riskier than I previously thought.
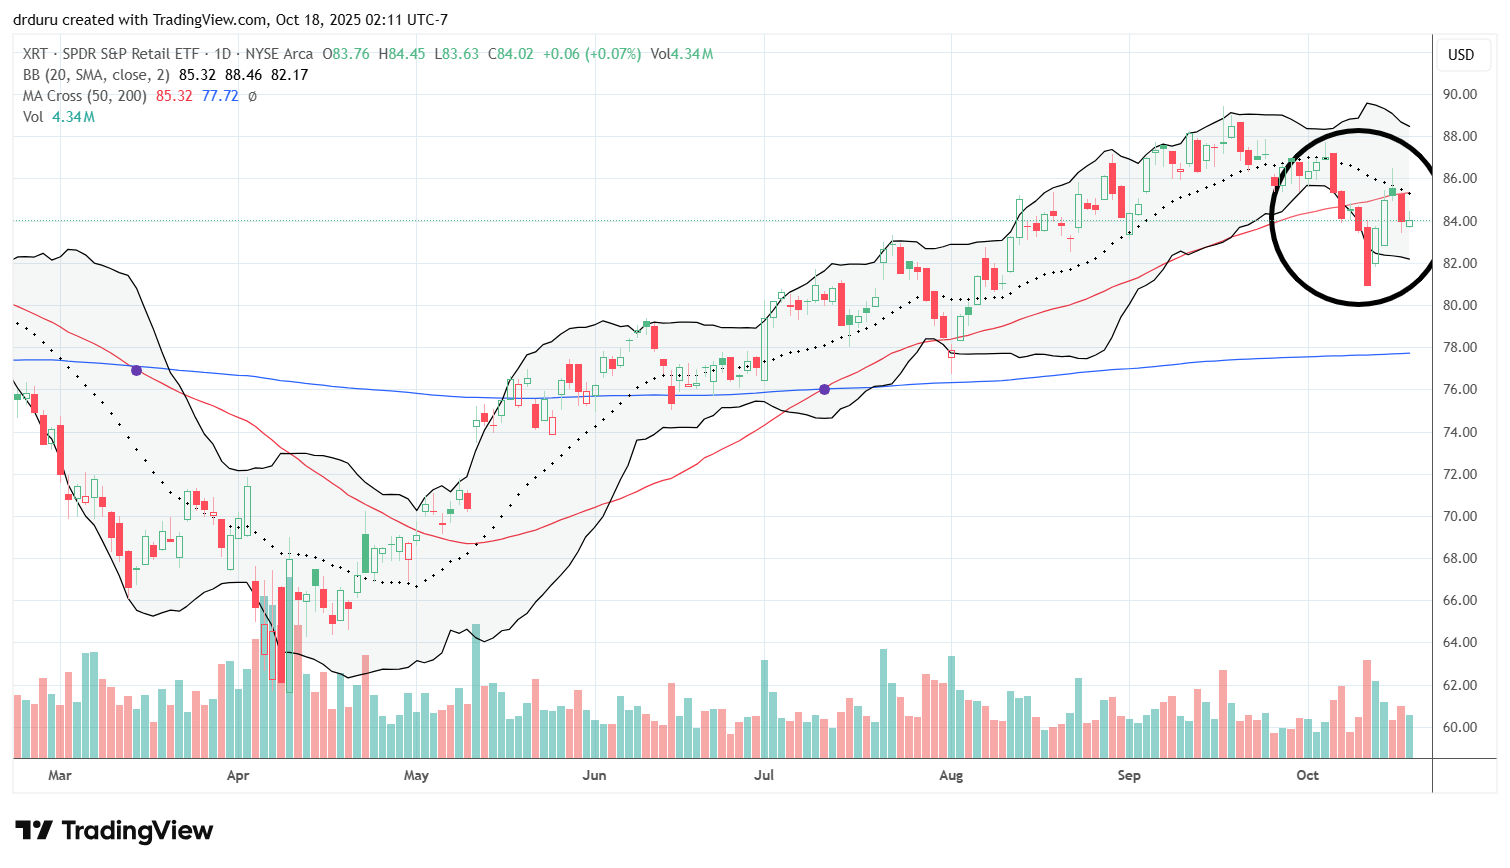
SPDR S&P Retail ETF (XRT)
Description: XRT is an equal-weighted exchange-traded fund managed by State Street Global Advisors that seeks to track the performance of the S&P Retail Select Industry Index, providing diversified exposure to U.S. retail companies across both traditional and online segments.
Technical status: SPDR S&P Retail ETF (XRT) confirmed a 50DMA breakdown to a 2+ month low before sharply rebounding. XRT remains bearish with 50DMA resistance holding and a declining 20DMA.
Trade commentary: I have my eyes on going short XRT especially as a hedge on bullish trades. I was surprised to see XRT rebound so effectively from the previous Friday’s sell-off. Now XRT looks like it is rolling over.
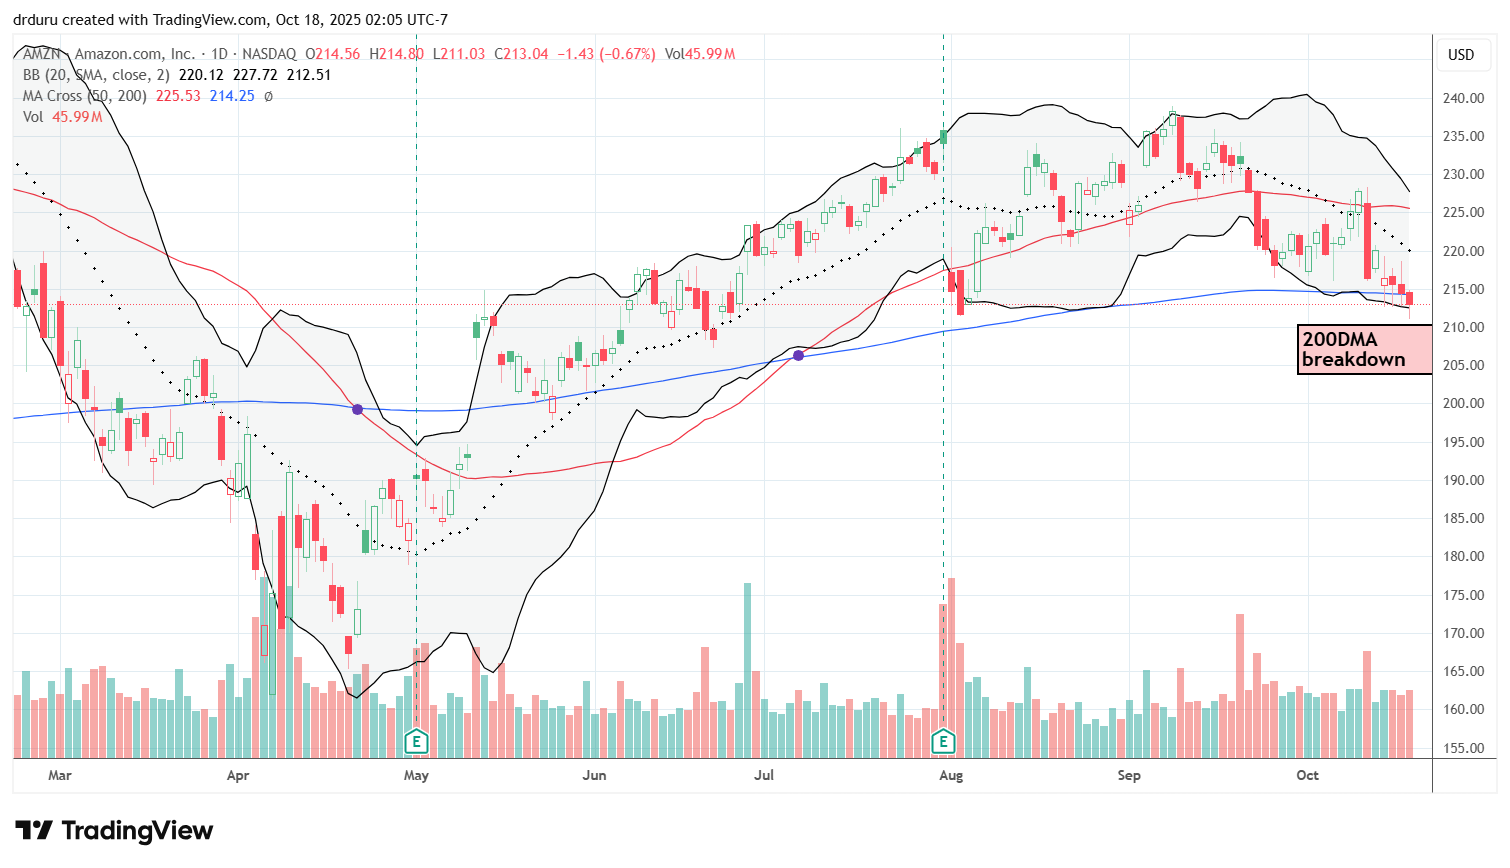
Amazon (AMZN)
Description: Amazon provides global e-commerce, cloud, and digital services.
Technical status: AMZN broke below its 200DMA after failing at 50DMA resistance, marking a bearish setup. Note how AMZN topped out just after reversing its last post-earnings loss.
Trade commentary: Speaking of retail, I am surprised to see AMZN trading so bearishly. My warning radar is definitely up!
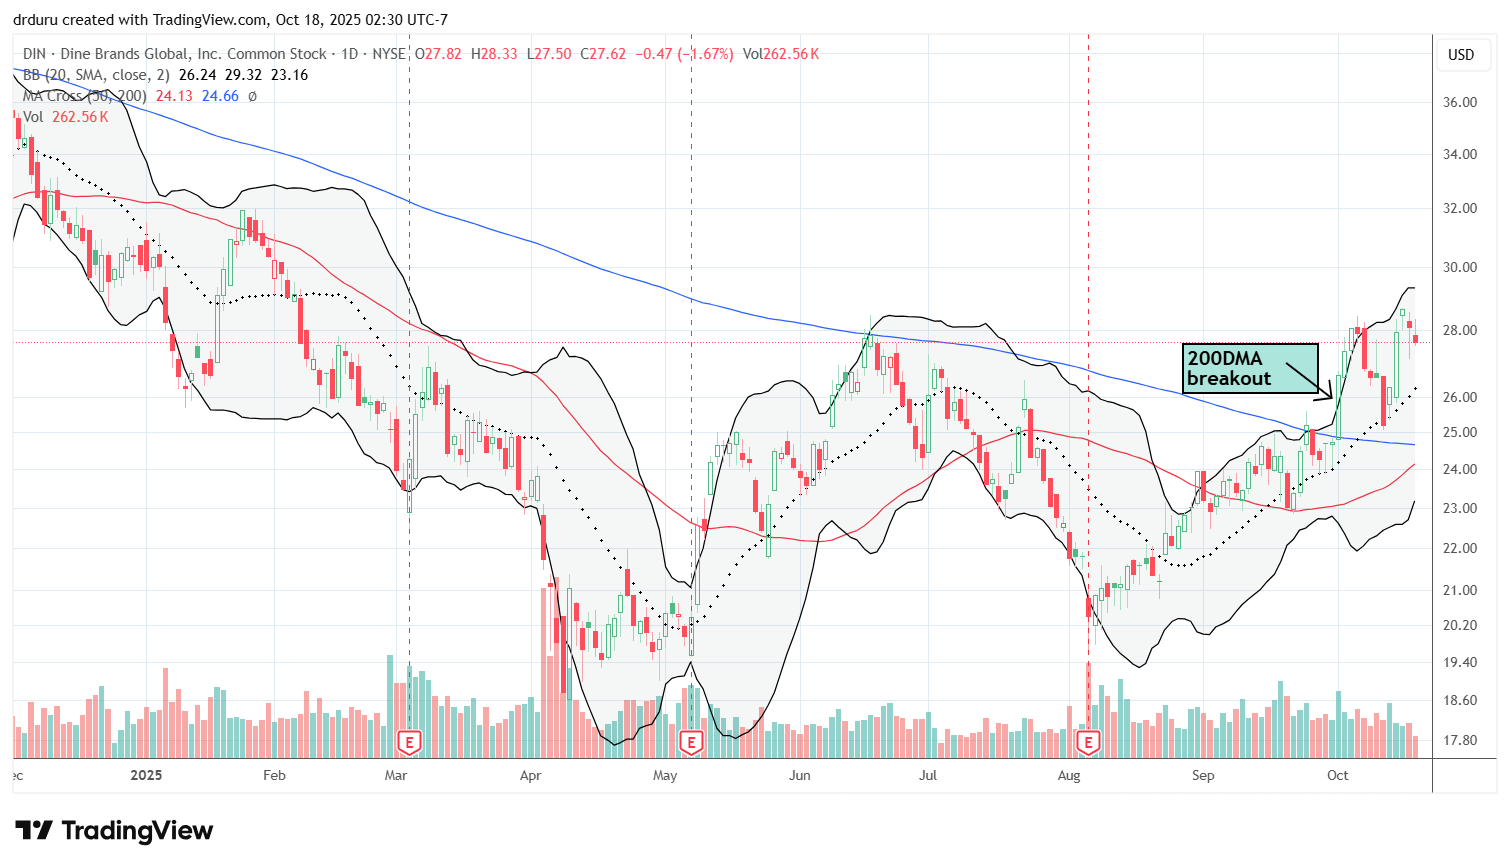
Dine Brands Global (DIN)
Description: Dine Brands operates restaurant chains including IHOP and Applebee’s.
Technical status: DIN achieved a bullish 200DMA breakout and then pulled back to its 20DMA.
Trade commentary: I speculated on DIN after its positive open following the test of 20DMA support. I took profits after a 6.2% gain the next day. DIN intrigues me as a potential bearish to bullish trade despite growing signs of weakening across consumer-facing stocks.
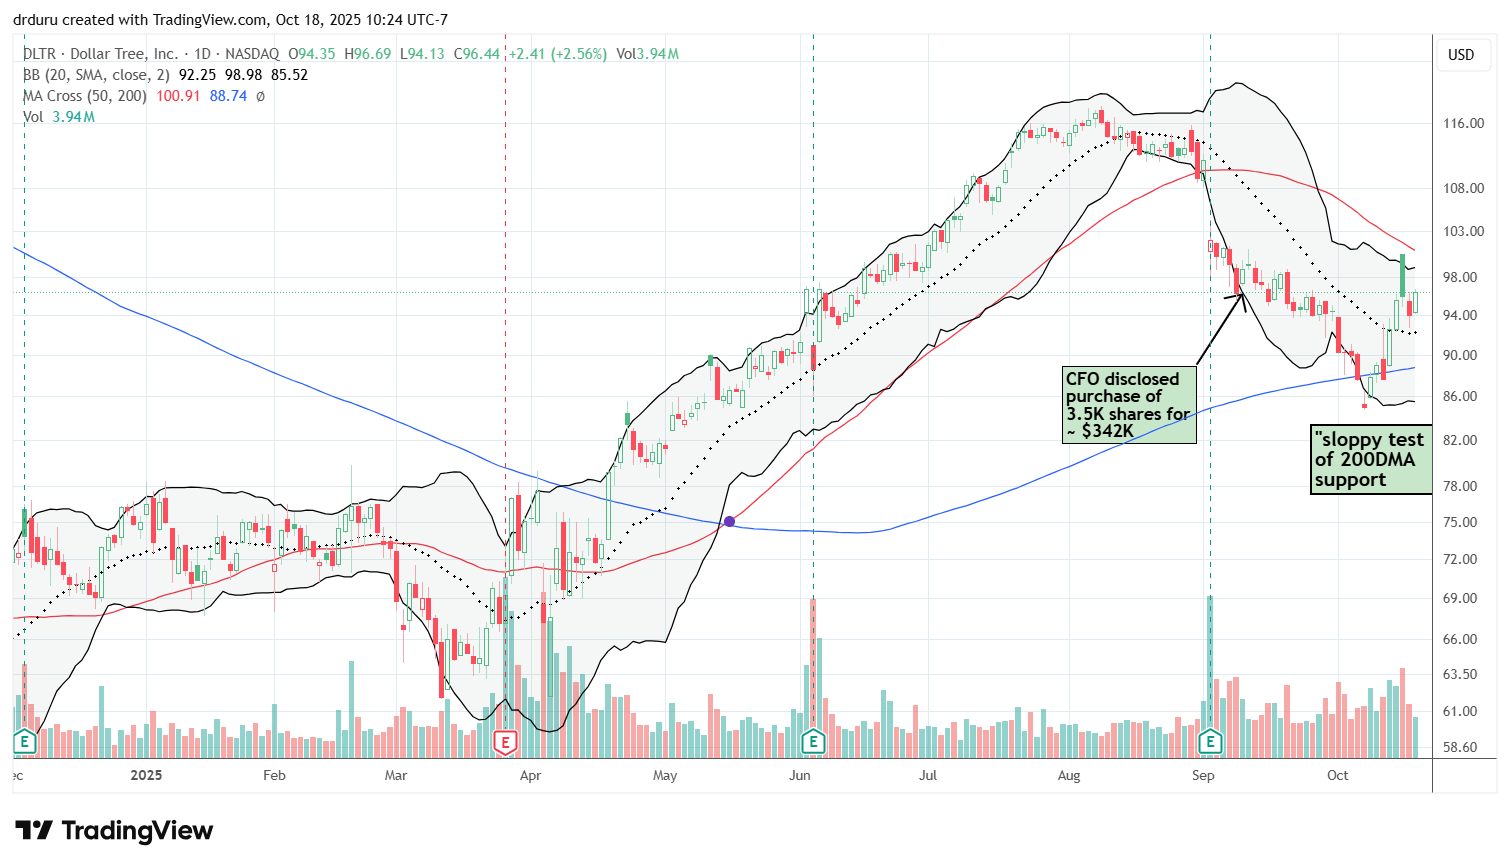
Dollar Tree (DLTR)
Description: Dollar Tree operates discount retail stores across North America.
Technical status: DLTR rebounded sharply from 200DMA support after prolonged post-earnings weakness.
Trade commentary: I sold a put earlier, which expired worthless, and now I am watching for a sustainable reversal above the 50DMA. I saw no news to explain the sudden surge in interest in DLTR. The sudden jump is particularly intriguing given the market failed to respond to news on the CFO’s share purchase.
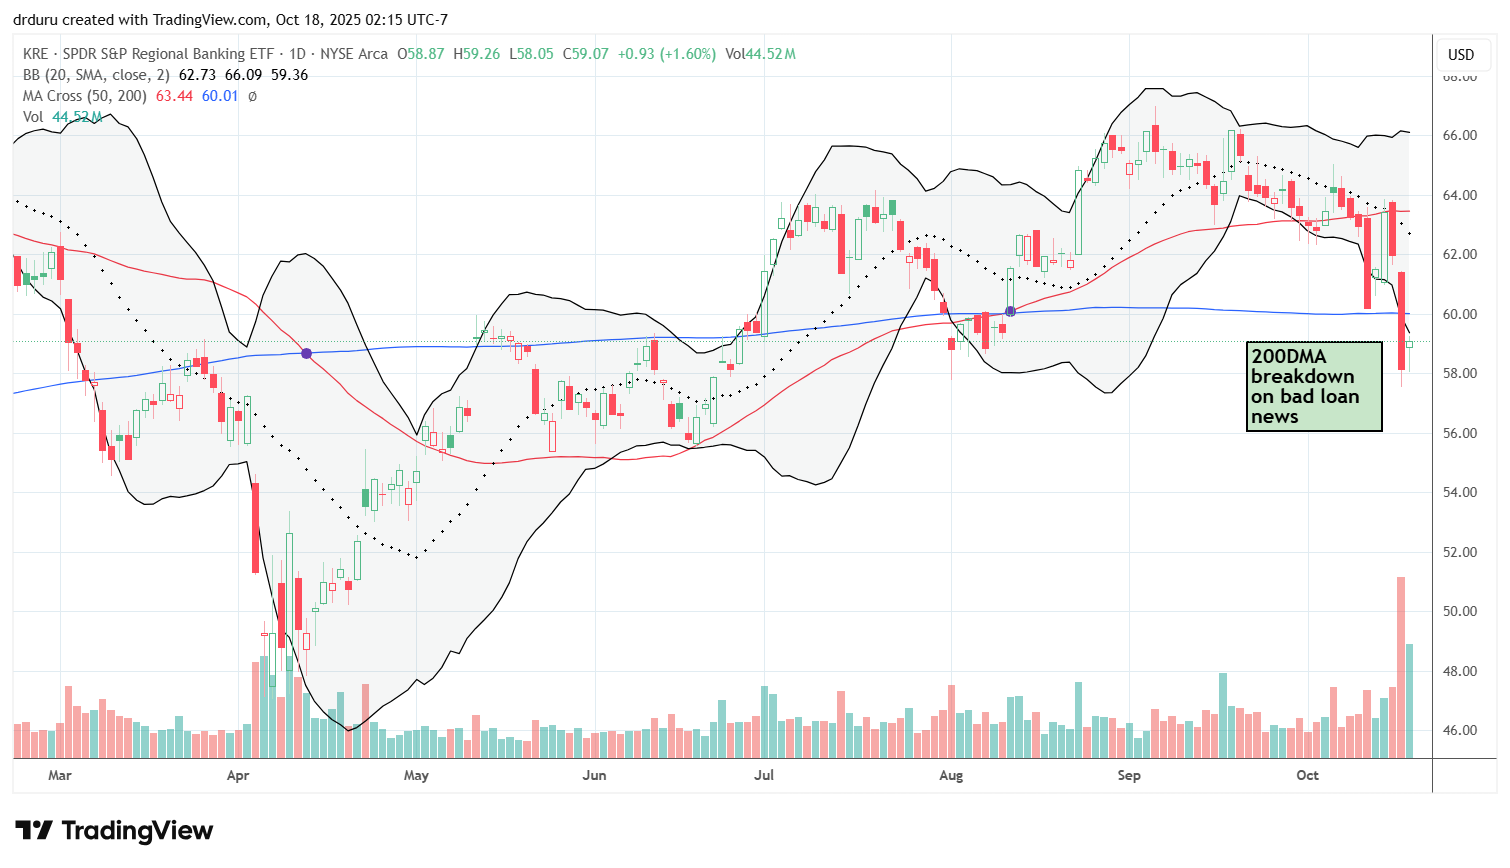
SPDR S&P Regional Banking ETF (KRE)
Description: KRE tracks U.S. regional bank stocks.
Technical status: KRE is bearish. The ETF of regional banks closed below its 200DMA, after wild swings.
Trade commentary: A mini panic over bad loans in individual regional banks touched off two days of sharp selling and a 200DMA breakdown. Good earnings news on Friday stopped the bleeding but the 200DMA breakdown remains intact. Given the economic and financial risks involved with KRE convulsions, I am buying puts on a lower close despite trading below the lower Bollinger Band (BB).
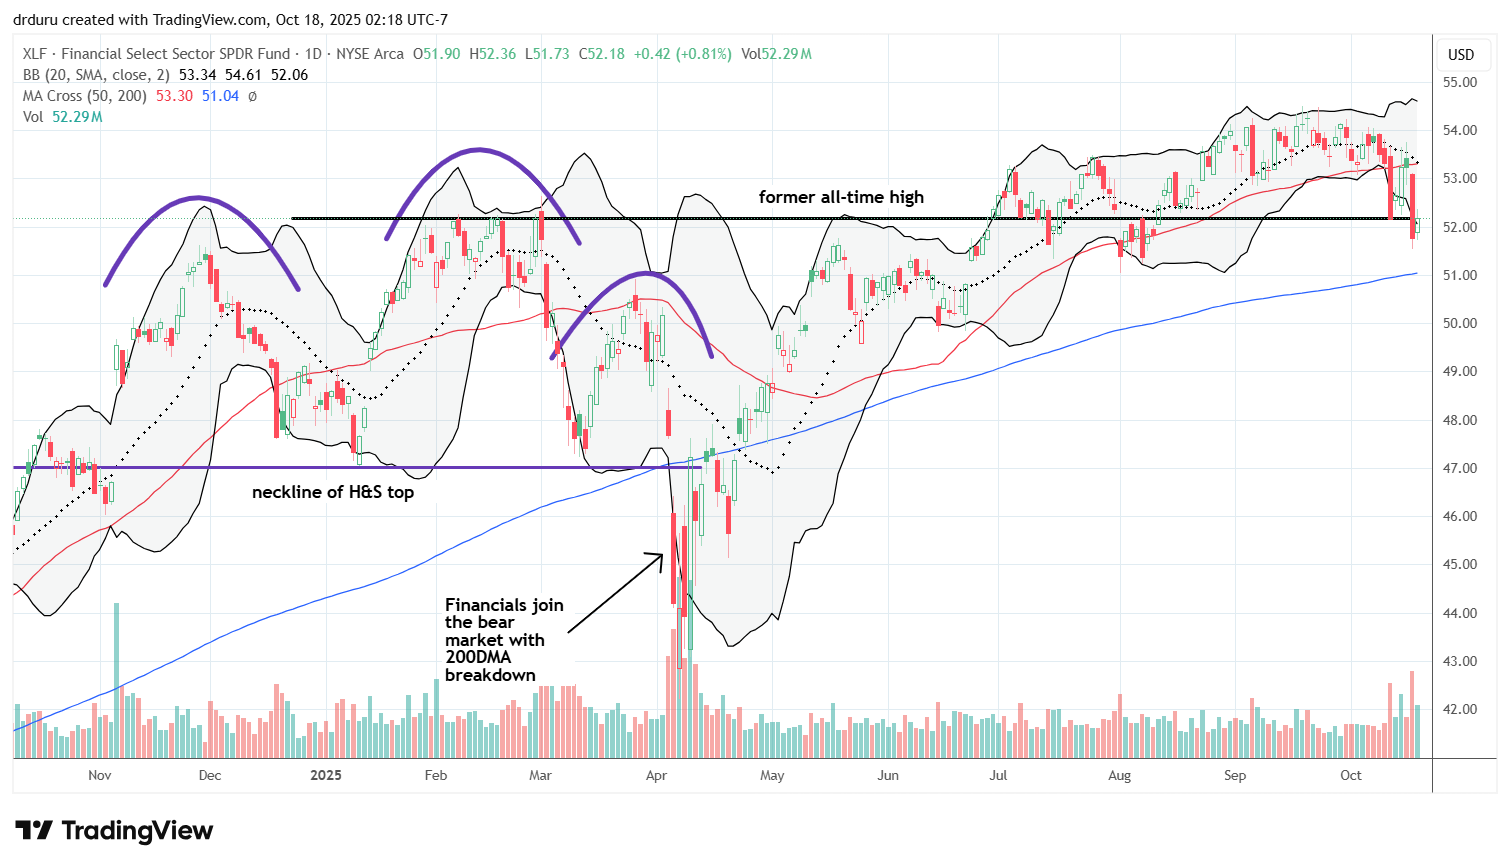
Financial Select Sector SPDR Fund (XLF)
Description: XLF tracks large-cap financial sector companies.
Technical status: XLF failed at converged 20DMA and 50DMA resistance and slipped back below its former highs. While the 200DMA looks poised to provide technical support, I am increasingly wary about the inability of XLF to pull away from the head and shoulders top (pictured below with the purple curves)
Trade commentary: I would only consider buying XLF on a successful test of 200DMA support.
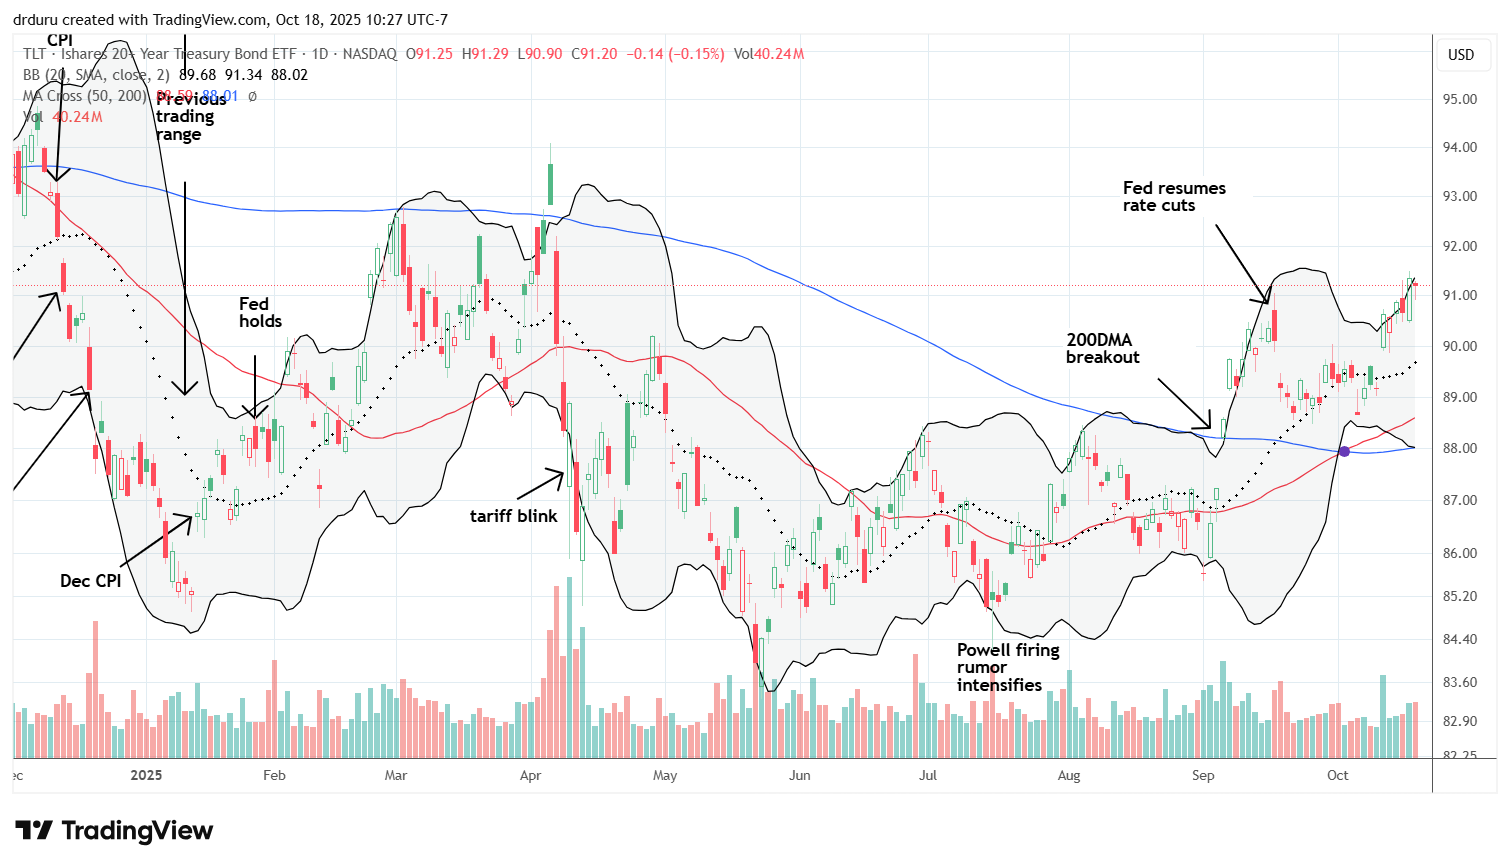
iShares 20+ Year Treasury Bond ETF (TLT)
Description: TLT tracks long-term U.S. Treasury bond performance.
Technical status: TLT has trended higher since last Friday’s 1.6% surge as investors sought safety. The bond ETF now trades at 6-month highs.
Trade commentary: Bonds may be signaling growing concern about economic and financial conditions rather than optimism about easing policy. I have stopped fading TLT with put options since there are plenty of catalysts available to provide tailwinds to TLT.
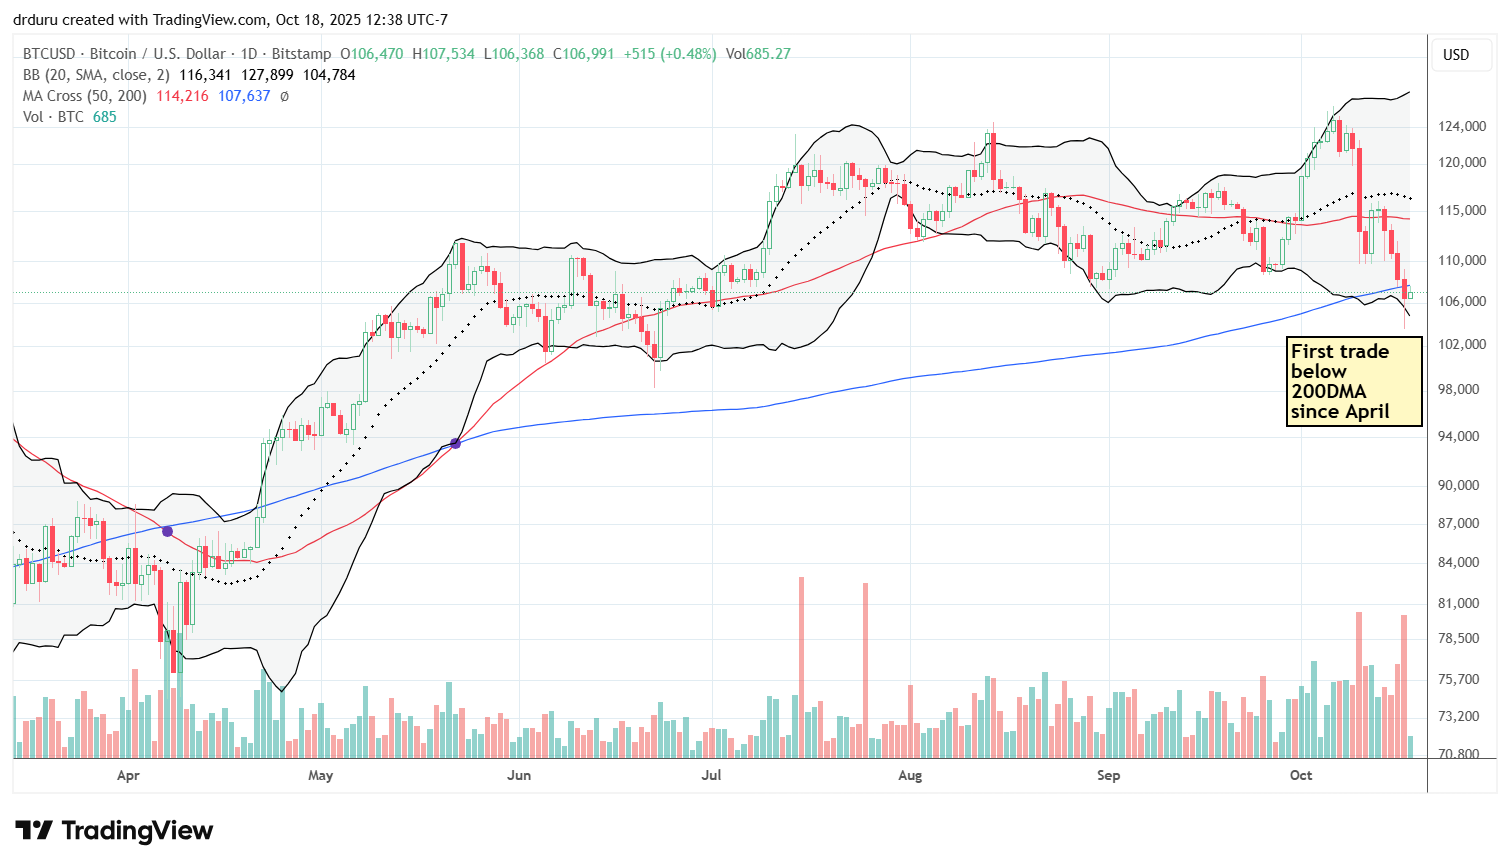
Bitcoin (BTC/USD)
Description: Bitcoin is a decentralized digital currency.
Technical status: Bitcoin fell below its 200DMA, ending a long uptrend and confirming risk-off sentiment.
Trade commentary: My strategy has not changed on Bitcoin and other cryptocurrencies: buy the dips (aggressively on crashes) and sell the rallies. I have been accumulating for much of the current trading range.
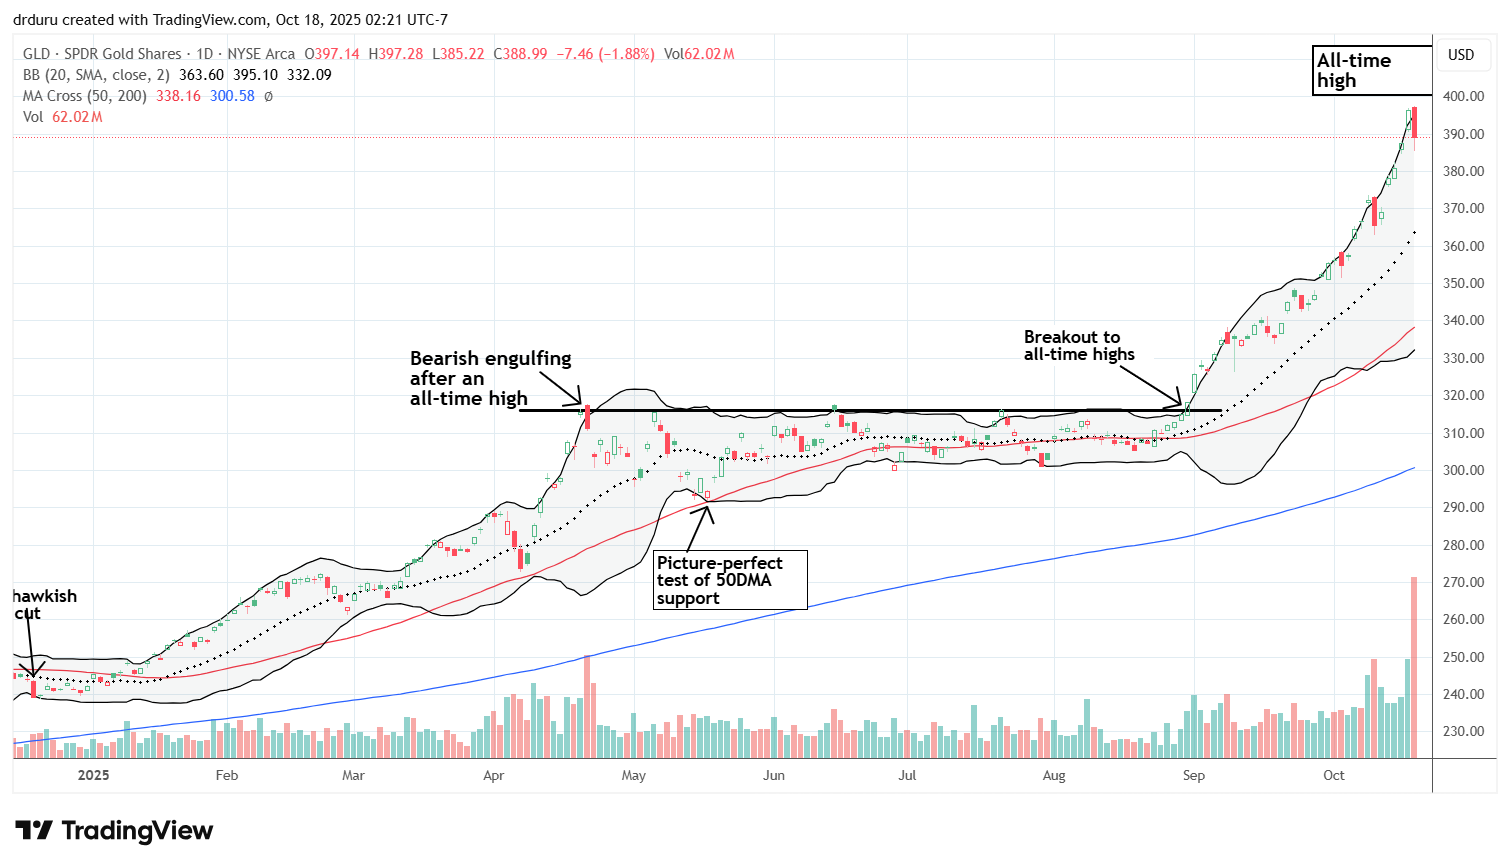
SPDR Gold Shares (GLD)
Description: GLD tracks gold bullion prices.
Technical status: On Friday, GLD’s near-parabolic run stalled with a 1.9% drop and record volume, forming a bearish engulfing top.
Trade commentary: Gold has consistently warned of economic and/or financial troubles all year and especially after its breakout in September. Gold bugs are one of the few segments of the market that seem to care about the implications of the shutdown of the U.S. government. Since I no longer have a position, I am applying the “no regrets” principle here. I am patiently waiting for a pullback to support, like the uptrending 20DMA, before dipping in again.
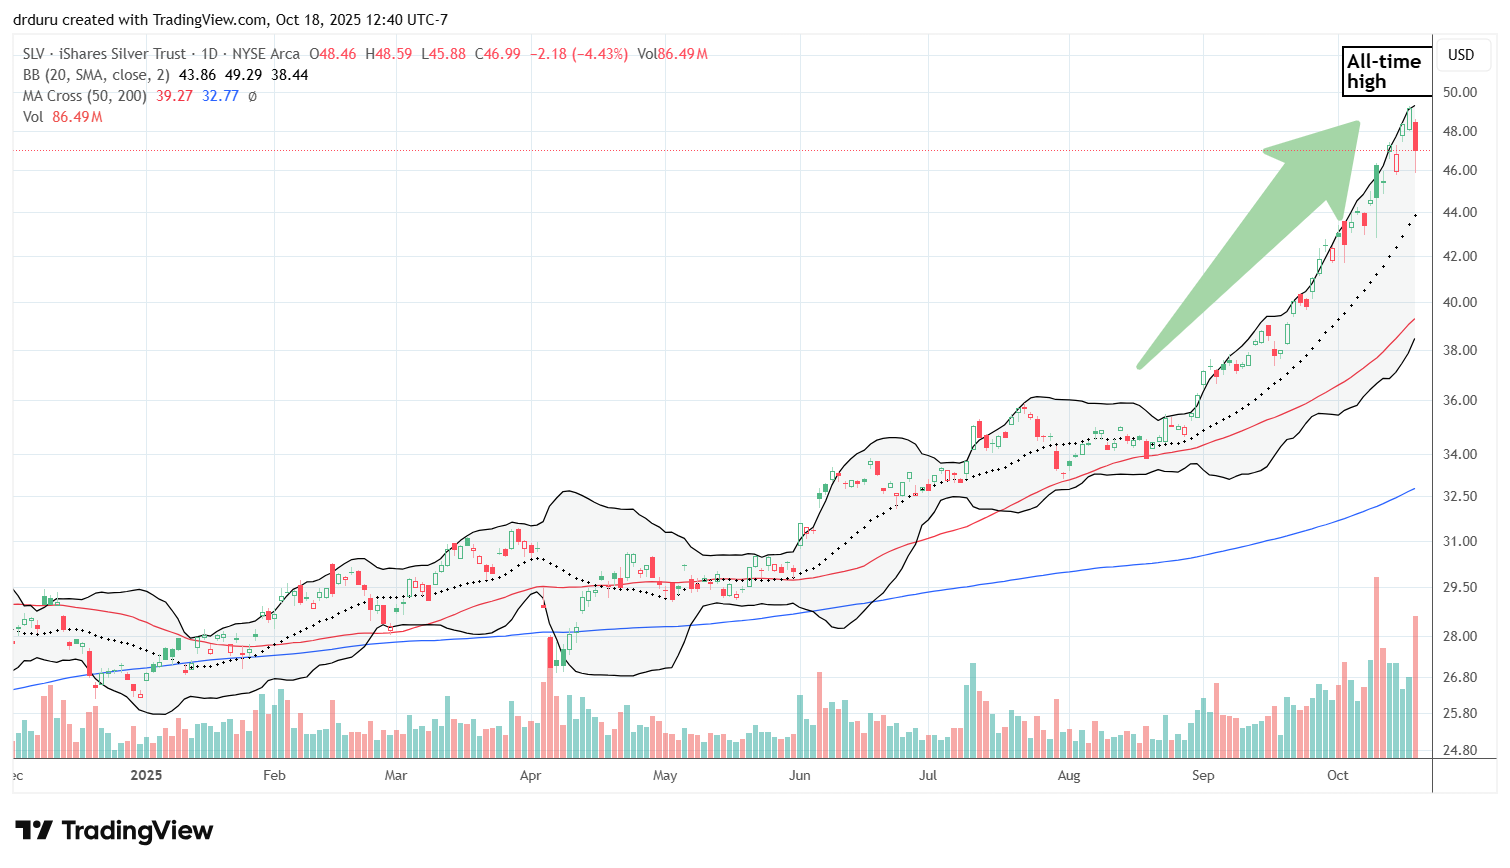
iShares Silver Trust (SLV)
Description: SLV tracks the price of silver.
Technical status: SLV gapped down from its all-time high and closed Friday down 4.4%. This price action is actually not a topping pattern. In fact, under specific conditions the setup is bullish. Per swingtradebot, SLV set up a potential slingshot bullish pattern: 1) Yesterday, stock makes a 2-month high, 2) Today’s low is at least 10 cents lower than yesterday’s low, 3) For the buy: either today or tomorrow when the stock trades 10 cents above yesterday’s high, 4) Initial stop: 2 points under entry price.
Trade commentary: I will follow the slingshot bullish rules. Otherwise, like GLD, I am content to wait for a pullback to 20DMA support.
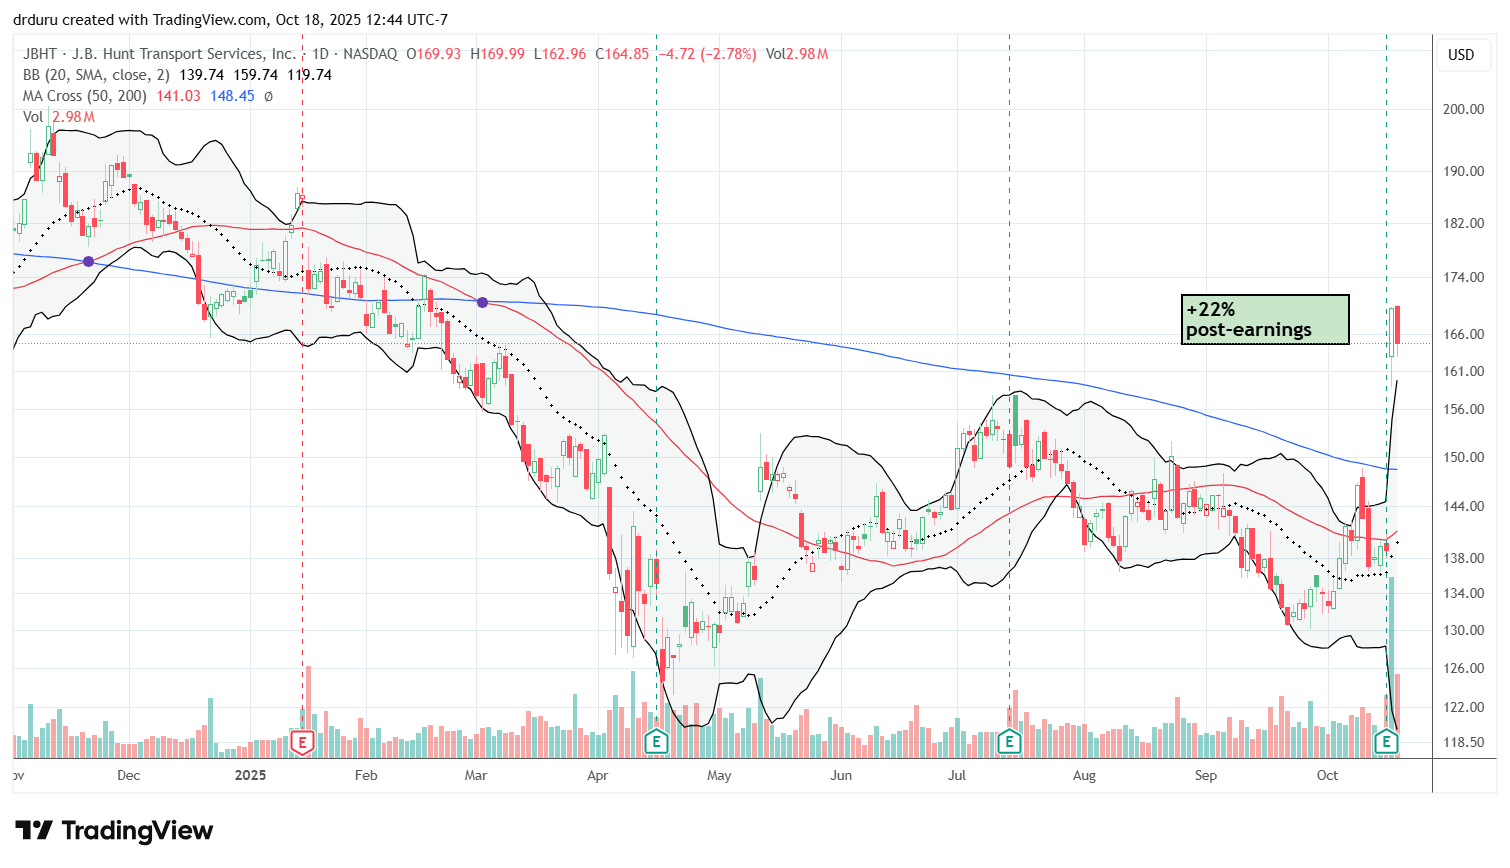
JB Hunt Transport Services (JBHT)
Description: JB Hunt provides logistics and trucking transportation services.
Technical status: JBHT surged 22% on strong earnings, breaking out of a 20-month long downtrend.
Trade commentary: I expected JBHT to have a poor earnings report given the on-going chaos and burdens from tariffs. This move bullishly shifts at least part of the industrial narrative.
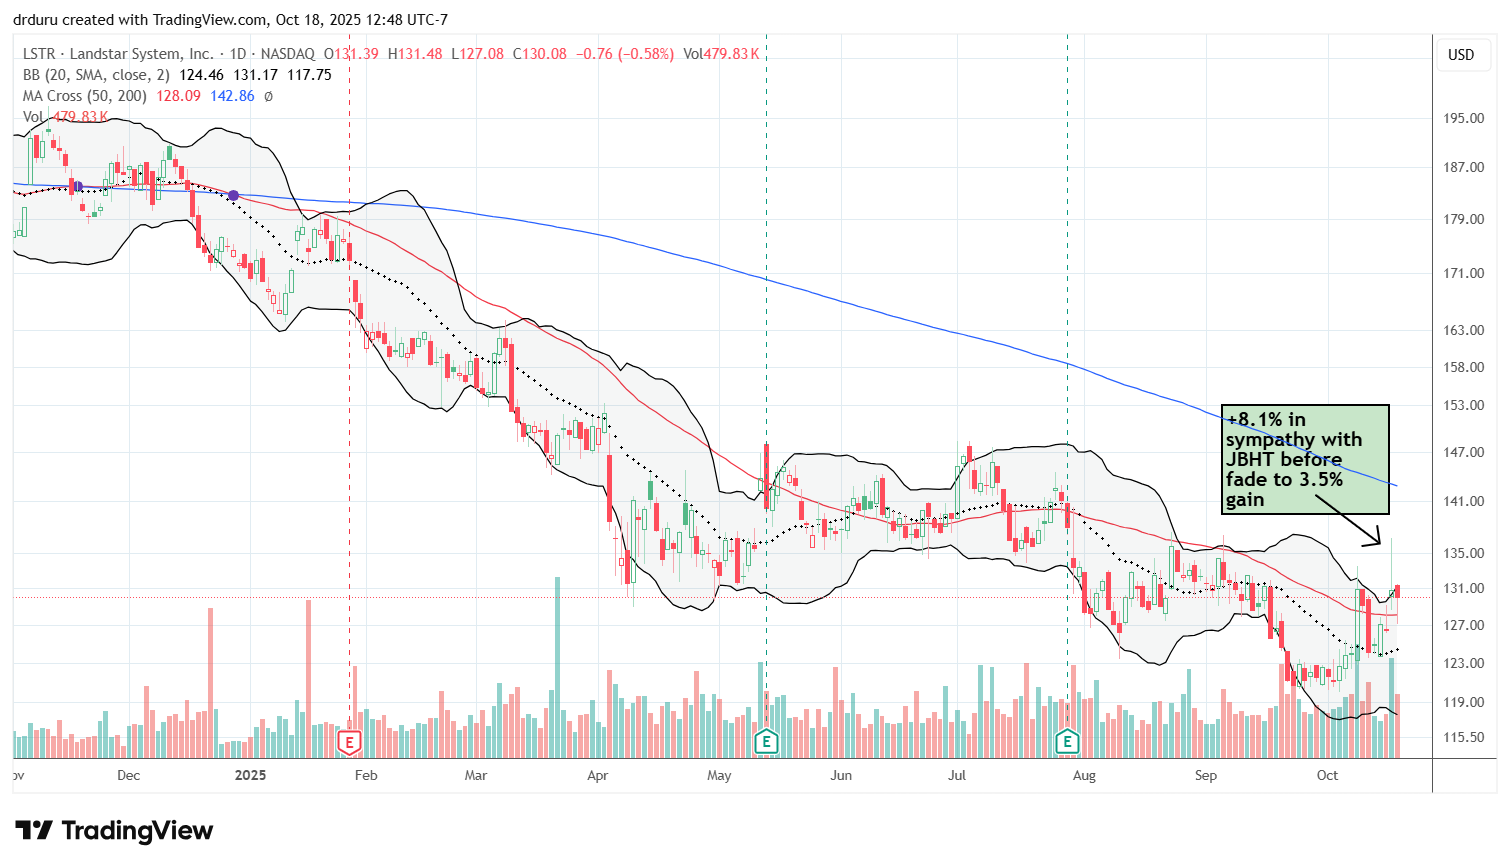
Landstar System (LSTR)
Description: Landstar System provides third-party logistics and freight transportation services.
Technical status: LSTR rallied alongside JBHT but faded sharply from its intraday high. While the stock closed above 50DMA resistance, it still looks vulnerable to a resumption of a long-term downtrend.
Trade commentary: Back in May, I identified LSTR as a key victim of the tensions in trade between the U.S. and its bordering neighbors Canada and Mexico. When LSTR made a new low, I opened a short position. The stock mainly churned from there, and I closed my short after the strong open in sympathy with JBHT. While LSTR is not in a bullish position, the risks are now higher than I can accept given the JBHT news.
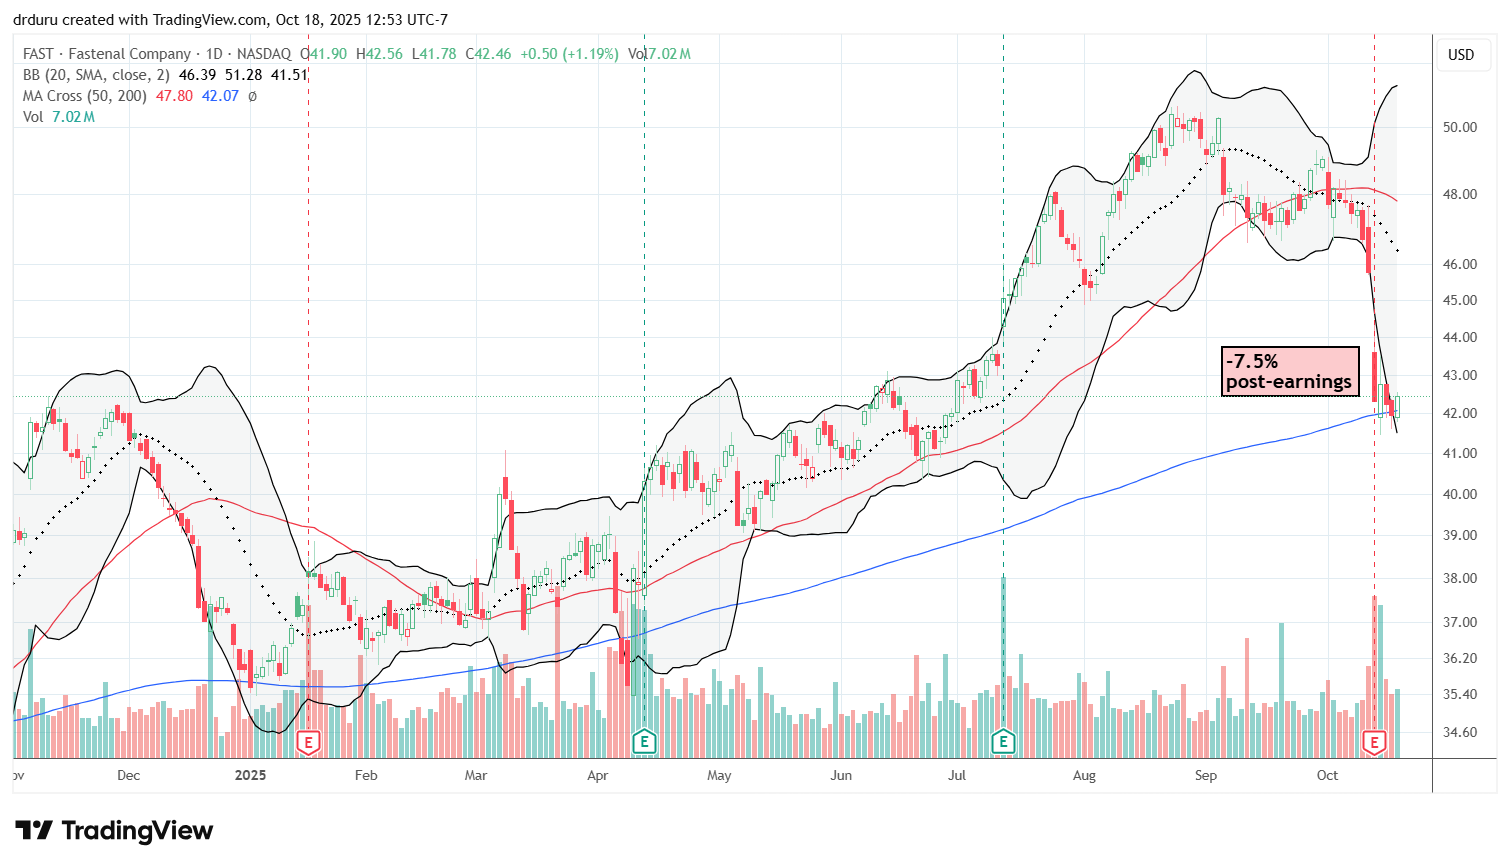
Fastenal (FAST)
Description: Fastenal manufactures and distributes industrial and construction supplies.
Technical status: FAST fell 7.5% post-earnings and is now clinging to 200DMA support.
Trade commentary: FAST is a multi-decade winner, so I decided to use this pullback as a buying opportunity. I first sold a put option. With that position expiring profitably, I bought shares. I plan to accumulate from here and treat the position as a long-term hold.
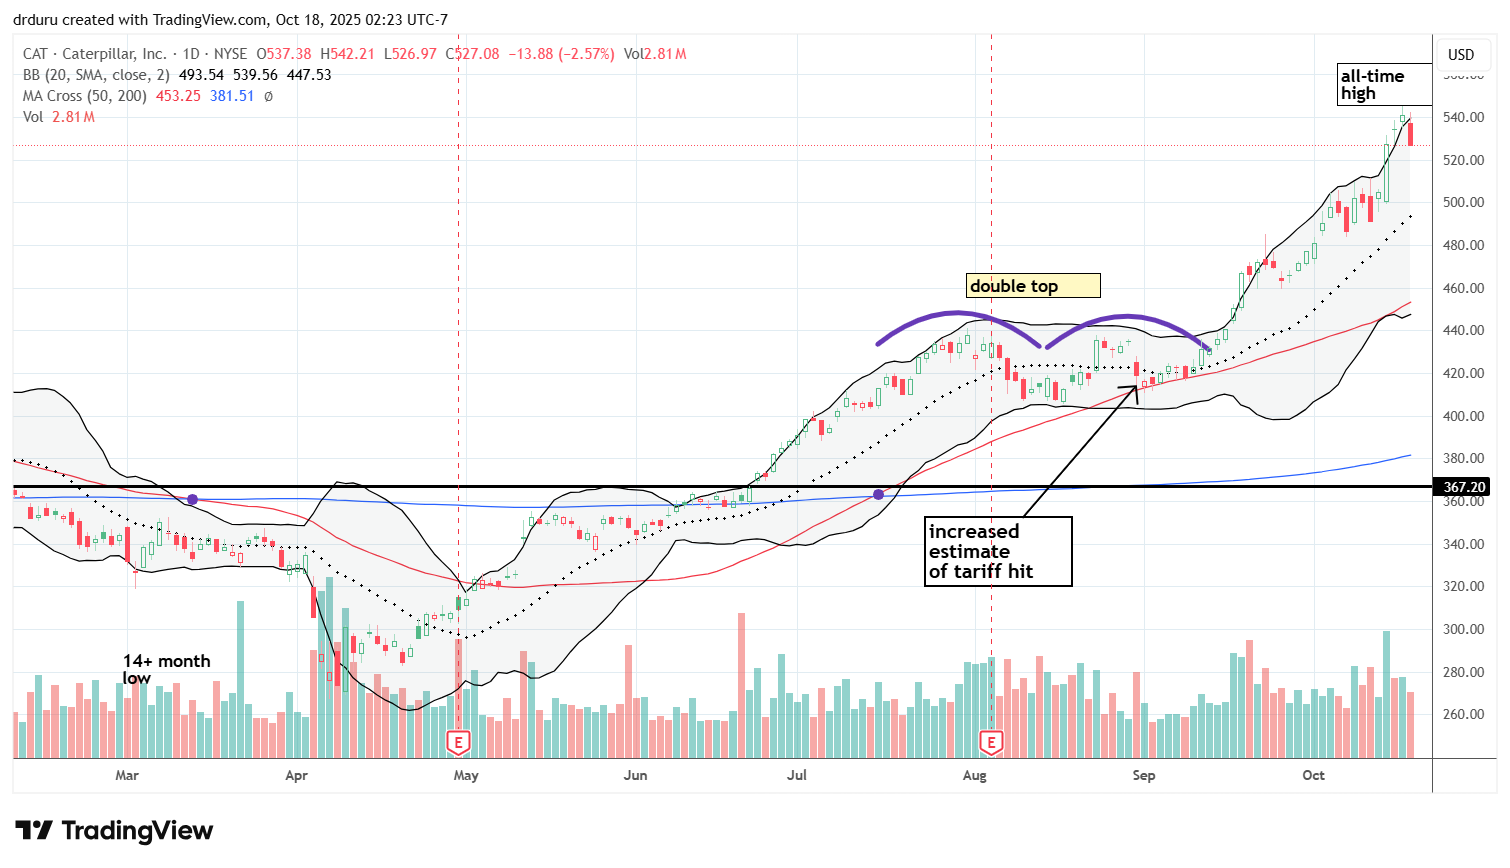
Caterpillar (CAT)
Description: Caterpillar manufactures heavy equipment for construction and mining industries.
Technical status: CAT remains in a strong uptrend, defying market weakness to hit new all-time highs. Incredibly, CAT managed to translate bad news on increased tariff costs to this impressive run-up. Friday’s gap down and 2.6% loss looks like a topping pattern, but, like SLV, CAT setup a slingshot bullish trade.
Trade commentary: I unwound a hedged trade earlier in the week and jumped right back into a “1-day” put option on Thursday’s over-extension above the upper Bollinger Band. I was fortunate to get the Friday pullback. The stock is well over-due for a rest, but I am not going to fight this uptrend again even as a hedge on other bullish positions. I eagerly await earnings on October 29th.
")
")
Be careful out there!
Footnotes
Subscribe for free to get email notifications of future posts!
“Above the 50” (AT50) uses the percentage of stocks trading above their respective 50-day moving averages (DMAs) to measure breadth in the stock market. Breadth defines the distribution of participation in a rally or sell-off. As a result, AT50 identifies extremes in market sentiment that are likely to reverse. Above the 50 is my alternative name for “MMFI” which is a symbol TradingView.com and other chart vendors use for this breadth indicator. Learn more about AT50 on my Market Breadth Resource Page. AT200, or MMTH, measures the percentage of stocks trading above their respective 200DMAs.
Active AT50 (MMFI) periods: Day #82 over 20%, Day #80 over 30% (overperiod), Day #1 under 40% (underperiod ending 74 days above 40%), Day #48 over 50%, Day #12 under 60%, Day #55 under 70%
Source for charts unless otherwise noted: TradingView.com
Full disclosure: long IWM shares and call options, long SPY put spreads, long QQQ call options, long DELL, long VRT, long BHP, long RIO, long EAT put spread
FOLLOW Dr. Duru’s commentary on financial markets via StockTwits, BlueSky, and even Instagram!
*Charting notes: Stock prices are not adjusted for dividends. Candlestick charts use hollow bodies: open candles indicate a close higher than the open, filled candles indicate an open higher than the close.
* Blog notes: this blog was written based on the heavily edited transcript of the following video that includes a live review of the stock charts featured in this post. I used ChatGPT to process the transcript.
Correction on my technical assessment for GLD. Like SLV, GLD also printed a slingshot bullish setup. The resolution of that slingshot vs bearish engulfing setup determines the next trade. At the time of this comment (10/20/2025 with 20 minutes left until market close), GLD confirmed a slingshot bullish setup and invalidated the topping signal. Thus the next trade is now with a stop below today’s low (approximately).